50370 Littmitz Ave · Nikiski, AK
Flood risk No data
- FEMA flood zone
- —
- Chance of flooding over 30 yrs
- —
- Est. flood insurance / yr
- —
Fire risk No data
- Est. fire insurance / yr
- —
Heat risk No data
- Hot days now (above threshold)
- —
- Hot days in 30 yrs
- —
Wind risk No data
- Chance of severe wind over 30 yrs
- —
Air-quality risk No data
- Unhealthy air days now
- —
- Unhealthy air days in 30 yrs
- —
Risk factors via First Street. Map © Google.
Why this score? — see what drove the F grade
The composite is a weighted blend of 9 inputs, each scored 0–100. Each bar is that input's sub-score; the figure is the points it added to the 100-point composite (weight × sub-score).
- ARV discount +7.5/15.0
- Cash flow +7.0/30.0
- Appreciation +5.0/10.0
- Schools +3.7/10.0
- Livability +2.8/5.0
- Rent growth +2.5/5.0
- Condition / age +2.5/5.0
- 1% rule +1.9/10.0
- DSCR +1.2/10.0
$194,500
🖨 Deal sheet (PDF) 📄 Offer letter ✓ Due diligence
Listing remarks
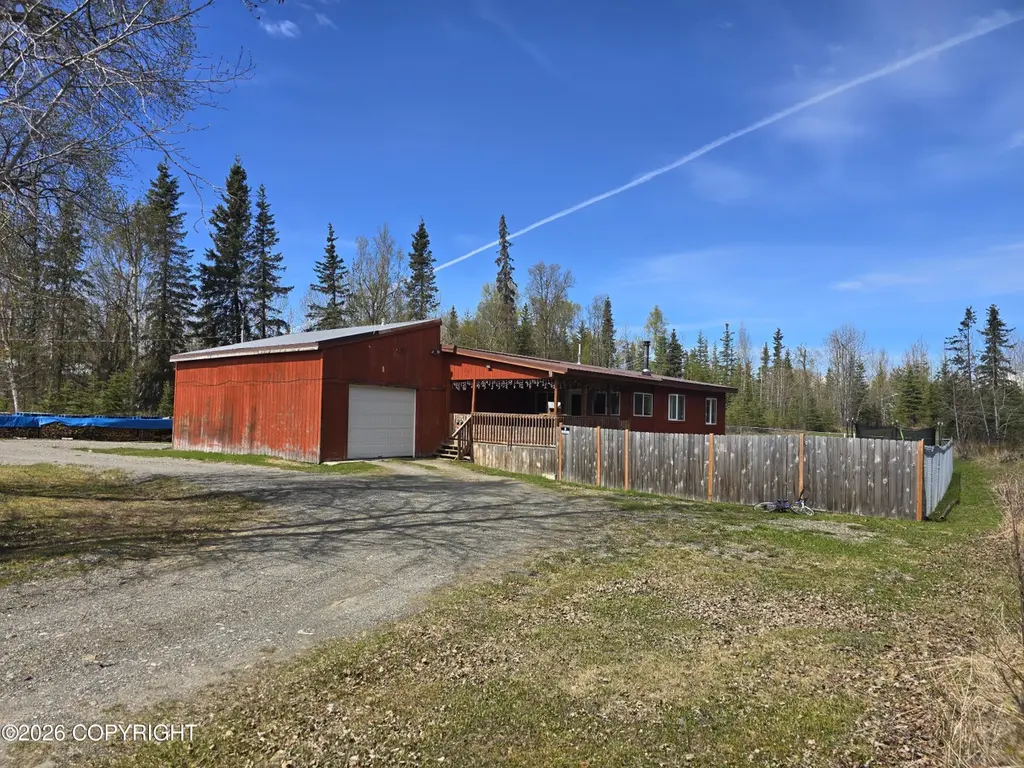
Updated 4-bedroom home in the heart of Nikiski, conveniently located off S. Miller Loop! A circular gravel driveway welcomes you home, leading to the attached garage and large covered front entry deck. The property features a fenced, pet-friendly side yard plus a large open backyard with plenty of room to enjoy Alaska living. New furnace in 2024 and an adorable woodstove keep things cozy and warm. Inside, you'll find modern appliances, updated finishes, and a beautifully tiled countertop that adds a fresh contemporary touch. Major upgrades have already been completed, including a newer furnace, brand-new well pump, and energy-efficiency improvements made within the last few years. Offering
Key facts
- New furnace
- Modern appliances
- Large open backyard
Tags
Property features AI
Exterior
- Parking: 1-car garage; No carport
- Security: Smoke detector(s)
- Utilities: Septic tank (sewer)
- Home design: Residential property; Not attached to another unit; Mobile home / wood frame construction; Built in 1974
- Construction: Wood frame and mobile home construction; Metal roof
- Exterior features: Fenced yard; Located in a fire service area; Located in a road service area; Gravel road access
Interior
- Kitchen: Dishwasher; Refrigerator; Pantry; Tile countertops
- Bedrooms: 4 bedrooms
- Flooring: Tile flooring
- Bathrooms: 2 total bathrooms (1 full bath, 1 three-quarter bath)
- Heating & cooling: Wood stove; Electric
- Interior features: Dishwasher; Refrigerator; Arctic entry; BR/BA on main level; Primary bedroom with bath on main level; Ceiling fan(s); Electric (service/heating component); Pantry; Smoke detector(s); Wood stove; Tile countertops
- Laundry & utility: Arctic entry (mudroom/utility space)
Neighborhood map
What this means for you Summary
Snapshot
- This is a 4-bed/1.0-bath manufactured listed at $194k.
Deal economics
- At list price, monthly cash flow is $-282 ($-3k/yr) — negative.
- To cash-flow at today's rent, offer at most $154k (21.0% below list).
- To meet the 1% rule (rent ≥ 1% of price), the offer needs to be $134k (30.9% below list).
- Recommended offer: $134k (30.9% below list) — sets the bar for 1% rule.
Location & tenants
- Location reads 56/100 on livability (#131 in AK) — a working-class tenant base; expect higher turnover. Strengths: housing A+; Watch: cost of living C-, health & safety C-, employment D+.
- Kenai Peninsula Borough School District (rural): math 35% / reading 48% proficiency, ranked #8 of 21 in AK (top 38%) — families likely to look elsewhere, expect single-tenant / working-renter base with shorter leases.
- Zoned schools: Nikiski North Star Elementary (math 27% / reading 37%, grade F, #104 of 156 statewide, top 70%, 242 students, 52% FRL); Nikiski Middle/Senior High School (math 22% / reading 37%, grade F, #39 of 61 statewide, top 65%, 326 students, 50% FRL) — zoned schools average 51% FRL vs 31% district-wide (20 pts higher); higher-poverty schools than district average — tighter screening recommended.
- Market conditions: 72 active listings in the ZIP; 152 units permitted in Kenai Peninsula Borough in 2024 (20 in 5+ unit buildings).
Forward outlook
- In year one you build about $7k of equity ($1k loan paydown + $6k appreciation (3.0% local appreciation)).
- Kenai Peninsula County population projected at +17% by 2050 — long-run rental-demand tailwind backs the buy-and-hold thesis.
- By year 5, paydown + projected appreciation supports a ~$31k cash-out refi (75% LTV) — recoverable capital for the next deal without selling this one.
Negotiation context
- It's been on market 25 days — a 2% lower offer ($192k) is reasonable based on typical stale-listing flexibility.
- 3 sale attempts since 28y ago with the ask held roughly flat each time — persistent listings suggest the price (not the market) is what's stuck; bring a comps-based counter.
Questions for the listing agent
- What do current leases actually rent for vs. the listed asking? Can we see a recent rent roll and the last 12 months of T-12 income?
- Built in 1974 — when were the roof, HVAC, electrical panel, plumbing, and water heater last replaced?
- Is there a deadline driving the sale (1031 exchange, divorce, estate, relocation)? That informs how much negotiation room exists.
- Schools are F-rated, which usually means shorter tenancies and higher turnover. Who's the typical renter profile here, and what's been the actual vacancy rate?
- Crime grade is D in this area — have there been break-ins, vandalism, or insurance claims at this property in the last 3 years? What carrier currently insures it and at what premium?
- The area grade is low — what's the realistic commute time and amenity access for the typical tenant pool here? Any planned neighborhood developments (good or bad) we should know about?
- What's the average days-on-market for RENTAL listings here right now (not sales)? A rising rental-DOM trend means longer vacancies and softer asking-rent achievability than the comps imply.
- What's the recent tenant-quality profile in this submarket — average credit score on applications, eviction rate, late-payment / NSF rate, and stable-employment percentage? A property-management company in the area should have these aggregated.
- How much new for-sale + rental construction is in the pipeline within 1–3 miles? Heavy new supply typically softens prices + rents 12–24 months out; constrained supply supports both.
Investment metrics
- 1% rule
- 0.69% ✗
- Cap rate
- 4.55%
- Cash-on-cash
- -6.22%
- DSCR
- 0.72
- GRM
- 12.1
CMA / ARV
No comps found within radius.
Projected returns pro-forma
3.0% appreciation · 3.0% rent growth · sell at horizon
- IRR
- 1.7%
- Equity multiple
- 1.10×
- Total profit
- $5,459
- Equity at exit
- $87,456
- IRR
- 5.4%
- Equity multiple
- 1.82×
- Total profit
- $44,706
- Equity at exit
- $134,780
Cash invested: $54,460 (down + closing). Projections, not guarantees.
Landlord ↔ Tenant lean methodology
- Overall (STATE)
- 80 Strongly Landlord-Friendly
- State Alaska
- 80 Strongly Landlord-Friendly · R+8
- County
- — inherits STATE
- City
- — inherits STATE
ZIP-level market 99635
- Active inventory
- 72
- Price-to-rent
- 12.1×
Monthly cashflow live
- Estimated rent
- $1,344 medium interval (Pro) →
- Mortgage (P&I)
- −$1,020
- Tax est. 1.5%
- −$243 /mo · $2,918/yr
- Insurance
- −$81
- HOA
- −$0
- Vacancy / Maint / Mgmt
- −$282
- Net cashflow
- $-282
Break-even live
Sensitivity live
| Price | -10% $-148 | -5% $-215 | +0% $-282 | +5% $-350 | +10% $-417 |
|---|---|---|---|---|---|
| Rent | -10% $-389 | -5% $-336 | +0% $-282 | +5% $-229 | +10% $-176 |
| Rate | -1.0pp $-185 | -0.5pp $-233 | base $-282 | +0.5pp $-333 | +1.0pp $-384 |
UW: 25.0% down · 7.5% · 30yr · 1.5% tax · 5.0% vac · 8.0% maint · 8.0% mgmt
Financing live
Cash to close
- Down payment
- $48,625
- Closing costs
- $5,835
- Reserves months
- —
- Total cash needed
- —
Loan-product check · same deal, 3 products live
Conventional
25% down · 7.5% · 30yr
- Down + closing
- —
- Monthly P&I
- —
- Monthly cashflow
- —
- DSCR
- —
- Eligible?
- —
Personal DTI + credit; lowest rate.
DSCR
20% down · 8.5% · 30yr
- Down + closing
- —
- Monthly P&I
- —
- Monthly cashflow
- —
- DSCR
- —
- Eligible?
- —
No personal income docs; deal must DSCR.
Hard money
10% down · 12.0% · 12mo
- Down + closing
- —
- Monthly P&I
- —
- Monthly cashflow
- —
- DSCR
- —
- Eligible?
- —
Short-term bridge; refi at stabilization.
Listing history 22 events
-
2026-06-22days on market $194,500 Active 25 DOM
-
2026-06-19days on market $194,500 Active 22 DOM
-
2026-06-18days on market $194,500 Active 21 DOM
-
2026-06-17days on market $194,500 Active 20 DOM
-
2026-06-16days on market $194,500 Active 19 DOM
-
2026-06-15days on market $194,500 Active 18 DOM
-
2026-06-14days on market $194,500 Active 16 DOM
-
2026-06-12pricedays on market $194,500 Active 15 DOM
-
2026-06-09days on market $199,500 Active 12 DOM
-
2026-06-08days on market $199,500 Active 11 DOM
-
2026-06-07days on market $199,500 Active 10 DOM
-
2026-06-07days on market $199,500 Active 9 DOM
-
2026-06-04days on market $199,500 Active 6 DOM
-
2026-06-02days on market $199,500 Active 5 DOM
-
2026-06-01days on market $199,500 Active 4 DOM
-
2026-05-31days on market $199,500 Active 3 DOM
-
2026-05-31days on market $199,500 Active 2 DOM
-
2026-05-28$199,500 Active
-
2018-05-15soldstatus
-
2018-01-05$129,900
-
2006-06-27soldstatus
-
1998-12-21$60,000
ⓘ Source: listings_history table (triggers on properties + properties_extension) + one-shot
backfill from property_details.listing_events for pre-trigger history.
Nearby sold comps map
Loading sold comps map…
Walkable amenities ~0.75 mi
Loading nearby amenities…
Taxation est. · year 1
- Rental income
- $16,126
- − Mortgage interest
- −$10,895
- − Property taxes
- −$2,918
- − Insurance
- −$972
- − Repairs & maintenance
- −$1,290
- − Management
- −$1,290
- − Depreciation
- −$5,658
- Taxable loss
- −$6,897
- Est. tax savings @ 24.0%
- +$1,655
- After-tax cash flow
- $-1,735/yr
For passive investors: Depreciation is non-cash, so a rental often shows a tax loss while cash-flowing — sheltering income. Rental losses are passive: they offset passive income freely, and up to $25,000/yr can offset ordinary (W-2) income if you actively participate and your MAGI is under $100k (phasing out to $0 by $150k); unused losses carry forward. On sale, claimed depreciation is recaptured at up to 25%, and gains may owe capital-gains tax (a 1031 exchange can defer both). Figures are a year-1 estimate at your 24.0% rate — not tax advice; consult a CPA.
Schools (NCES district)
- District
- Kenai Peninsula Borough School District
- NCES district ID
- 0200390
- Math proficiency
- 35% ▼ -6.00%
- Reading proficiency
- 48% ▲ 1.00%
- Median HH income
- $60,704
- Composite
- 36.71/100
- National rank
- #4594
- State rank
- #8 of 21 in AK
Livability — Nikiski
- Score
- 56/100
- State rank
- #131
- US rank
- #22928
Category grades
Schools grade is shown separately in the Schools card above.
Census & demographics
- Census place
- Nikiski, AK
- Population (ZIP)
- 106
Population outlook (Kenai Peninsula County) Hauer SSP2
- Today (2025)
- 63,736 people
- By 2030
- 66,260 · +4.0%
- By 2040
- 70,449 · +10.5%
- By 2050
- 74,414 · +16.8%
- By 2075
- 87,508 · +37.3%
- By 2100
- 95,360 · +49.6%
Race, ethnicity, and origin ACS 2023
- Neighborhood character
- Predominantly White (98%)
- Race & ethnicity
- White 98% Hispanic / Latino 2%
- Languages at home
- 99% English-only · Spanish 1%
Political lean MEDSL · Kenai Peninsula
- 2016 margin
- R (+15.2) · D 37.7% · R 52.9% · Other 9.4%
- All cycles
- 2016: R+15.2
Not yet ingested
- Civics
- —
Market trends
- HPI YoY
- —
- Current HPI
- —
- Rent YoY
- —
- Metro
- —
- State GDP YoY
- —
- F500 in state
- 0
Price history
+232.5% since first listed5 events — show timeline
- 2026-05-28 Listed $199,500 AKMLS
- 2018-05-15 Sold (Public Records) — Public Records
- 2018-01-05 Listed $129,900 AKMLS
- 2006-06-27 Sold (Public Records) — Public Records
- 1998-12-21 Listed $60,000 AKMLS
Property tax history
-17.8%/yrLatest (2019): $229 · -72.1% YoY. Source: county tax records.
Cash-flow waterfall
monthlySold comps — $/sqft
last 12 mo · ≤1 miLoading sold comps…