500 Ripley 21n-10 · Doniphan, MO
Flood risk 1/10 · Minimal
- FEMA flood zone
- X (unshaded)
- Chance of flooding over 30 yrs
- 0.0%
- Est. flood insurance / yr
- $473 – $860
Fire risk 5/10 · Moderate
- Est. fire insurance / yr
- $1,054 – $1,958
Heat risk 5/10 · Moderate
- Hot days now (above 108°F)
- 7 days/yr
- Hot days in 30 yrs
- 20 days/yr
Wind risk 2/10 · Minimal
- Chance of severe wind over 30 yrs
- 3.0%
Air-quality risk 1/10 · Minimal
- Unhealthy air days now
- 0 days/yr
- Unhealthy air days in 30 yrs
- 0 days/yr
Risk factors via First Street. Map © Google.
Why this score? — see what drove the B+ grade
The composite is a weighted blend of 9 inputs, each scored 0–100. Each bar is that input's sub-score; the figure is the points it added to the 100-point composite (weight × sub-score).
- Cash flow +30.0/30.0
- 1% rule +10.0/10.0
- DSCR +10.0/10.0
- Appreciation +7.6/10.0
- ARV discount +7.5/15.0
- Livability +3.0/5.0
- Schools +2.7/10.0
- Rent growth +2.5/5.0
- Condition / age +2.5/5.0
$49,000
🖨 Deal sheet (PDF) 📄 Offer letter ✓ Due diligence
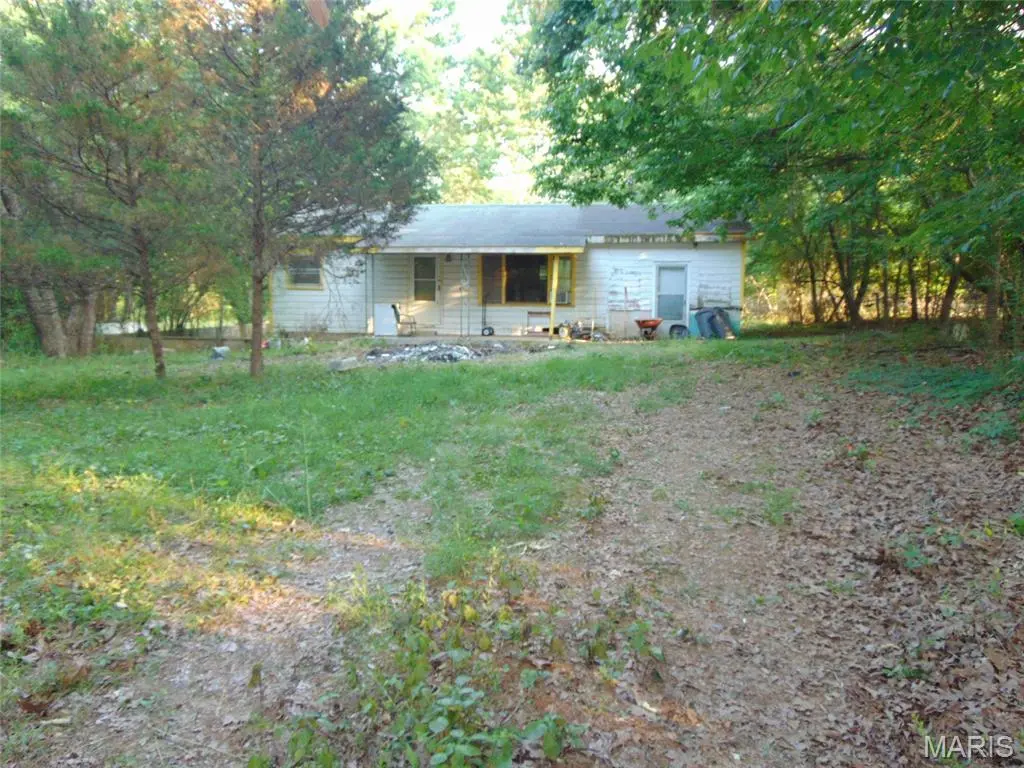
Listing remarks
Two bed, one bath home on 5 acres (m/l) just minutes north of Doniphan. Older home in rough condition but probably savable. Owned by a local real estate agent who bought it and has started cleaning it up. Would prefer to sell in its current condition. If it doesn't sell quickly, work will begin to remodel and fix up the home and price will increase accordingly. There is a small triangular lot between the home and the country road which increases privacy. There is a recorded easement to the property. 5 acre (m/l) wooded lot is narrow and deep. Fantastic spot to build a new home or put a mobile home back in the woods.
Key facts
- Wooded lot
- 5 acres
- Triangular lot
Tags
Property features AI
Finance
- Other: Road/right-of-way easement
- Financial info: Lease not considered; No second mortgage indicated; Seller may consider concessions
Exterior
- Utilities: Public water; Septic tank sewer; Electricity with 220 volts; Electricity, sewer and water connected
- Home design: Single-family residence; One story; Private ownership; Property listed as fixer
- Construction: Constructed with other/unspecified materials
- Exterior features: Partial fencing; Level, wooded lot
Interior
- Kitchen: No appliances specified
- Bedrooms: 2 bedrooms (both on the main level)
- Bathrooms: 1 full bathroom (on the main level)
- Heating & cooling: Forced air heating; Gravity heating; Window air conditioning units
- Interior features: No basement; 6 total rooms
- Laundry & utility: No laundry appliances specified
Neighborhood map
What this means for you Summary
Snapshot
- This is a 2-bed/1.0-bath manufactured listed at $49k.
Deal economics
- At list price, monthly cash flow is $392 ($5k/yr) — positive.
- The deal already cash-flows at list — no discount required.
- Meets the 1% rule at list price ($869 rent vs $49k).
- Recommended offer: $48k (1.5% below list) — sets the bar for market timing.
- Cap rate 15.9% vs local median 2.6% in Doniphan — top-decile yield for the area; either an underpriced asset or a hidden risk that comps aren't pricing in. Stress-test before assuming the spread holds.
Location & tenants
- Location reads 59/100 on livability (#568 in MO) — a working-class tenant base; expect higher turnover. Strengths: cost of living A+, housing A-; Watch: health & safety C-, amenities F, commute F.
- Doniphan R-I (rural): math 27% / reading 39% proficiency, ranked #254 of 324 in MO (top 78%) — families likely to look elsewhere, expect single-tenant / working-renter base with shorter leases; 63% free/reduced lunch — lower-income household profile, screen leases tightly.
- Zoned schools: Doniphan Elem. (378 students, 99% FRL); Doniphan High (math 54% / reading 57%, grade C, #61 of 521 statewide, top 12%, 476 students, 99% FRL) — zoned schools average 99% FRL vs 63% district-wide (36 pts higher); higher-poverty schools than district average — tighter screening recommended.
- Zoned-school proficiency averages 56% at this address vs 33% district-wide (+23 pts) — the actual schools serving this property are materially stronger than the Doniphan R-I average implies; a family-tenant draw the district grade alone would hide.
- Market conditions: 128 active listings in the ZIP.
Forward outlook
- In year one you build about $3k of equity ($339 loan paydown + $3k appreciation (5.1% local appreciation)).
- Ripley County population projected at -20% by 2050 — secular population decline; favor cash flow + early exit over multi-decade hold.
- At projected returns (5.1% appreciation + 3.0% rent growth), your $14k cash investment doubles in ~2 years — after that, you're playing with house money.
Negotiation context
- It's been on market 21 days — a 2% lower offer ($48k) is reasonable based on typical stale-listing flexibility.
Risks & watch-outs
- Climate carrying-cost: moderate wildfire risk; extreme-heat days projected 7→20/yr by 2055 (HVAC capex compounding) — expect insurance premiums to compound above CPI over the hold.
Questions for the listing agent
- Built in 1969 — when were the roof, HVAC, electrical panel, plumbing, and water heater last replaced?
- Is there a deadline driving the sale (1031 exchange, divorce, estate, relocation)? That informs how much negotiation room exists.
- Schools are D-rated, which usually means shorter tenancies and higher turnover. Who's the typical renter profile here, and what's been the actual vacancy rate?
- What's the average days-on-market for RENTAL listings here right now (not sales)? A rising rental-DOM trend means longer vacancies and softer asking-rent achievability than the comps imply.
- What's the recent tenant-quality profile in this submarket — average credit score on applications, eviction rate, late-payment / NSF rate, and stable-employment percentage? A property-management company in the area should have these aggregated.
- How much new for-sale + rental construction is in the pipeline within 1–3 miles? Heavy new supply typically softens prices + rents 12–24 months out; constrained supply supports both.
Investment metrics
- 1% rule
- 1.77% ✓
- Cap rate
- 15.90%
- Cash-on-cash
- 34.33%
- DSCR
- 2.53
- GRM
- 4.7
CMA / ARV
No comps found within radius.
Projected returns pro-forma
5.14% appreciation · 3.0% rent growth · sell at horizon
- IRR
- 43.3%
- Equity multiple
- 3.67×
- Total profit
- $36,667
- Equity at exit
- $28,184
- IRR
- 41.1%
- Equity multiple
- 7.49×
- Total profit
- $89,035
- Equity at exit
- $48,990
Cash invested: $13,720 (down + closing). Projections, not guarantees.
Landlord ↔ Tenant lean methodology
- Overall (STATE)
- 81 Strongly Landlord-Friendly
- State Missouri
- 81 Strongly Landlord-Friendly · R+10
- County
- — inherits STATE
- City
- — inherits STATE
ZIP-level market 63935
- Home prices YoY
- 4.4%
- Active inventory
- 128
- Price-to-rent
- 4.7×
Monthly cashflow live
- Estimated rent
- $869 medium interval (Pro) →
- Mortgage (P&I)
- −$257
- Tax from tax record
- −$16 /mo · $196/yr
- Insurance
- −$20
- HOA
- −$0
- Vacancy / Maint / Mgmt
- −$182
- Net cashflow
- $392
Break-even live
Sensitivity live
| Price | -10% $420 | -5% $406 | +0% $392 | +5% $379 | +10% $365 |
|---|---|---|---|---|---|
| Rent | -10% $324 | -5% $358 | +0% $392 | +5% $427 | +10% $461 |
| Rate | -1.0pp $417 | -0.5pp $405 | base $392 | +0.5pp $380 | +1.0pp $367 |
UW: 25.0% down · 7.5% · 30yr · 1.5% tax · 5.0% vac · 8.0% maint · 8.0% mgmt
Financing live
Cash to close
- Down payment
- $12,250
- Closing costs
- $1,470
- Reserves months
- —
- Total cash needed
- —
Loan-product check · same deal, 3 products live
Conventional
25% down · 7.5% · 30yr
- Down + closing
- —
- Monthly P&I
- —
- Monthly cashflow
- —
- DSCR
- —
- Eligible?
- —
Personal DTI + credit; lowest rate.
DSCR
20% down · 8.5% · 30yr
- Down + closing
- —
- Monthly P&I
- —
- Monthly cashflow
- —
- DSCR
- —
- Eligible?
- —
No personal income docs; deal must DSCR.
Hard money
10% down · 12.0% · 12mo
- Down + closing
- —
- Monthly P&I
- —
- Monthly cashflow
- —
- DSCR
- —
- Eligible?
- —
Short-term bridge; refi at stabilization.
Listing history 9 events
-
2026-06-09status $49,000 Pending 21 DOM
-
2026-06-08days on market $49,000 Active 21 DOM
-
2026-06-07days on market $49,000 Active 20 DOM
-
2026-06-07days on market $49,000 Active 19 DOM
-
2026-06-04days on market $49,000 Active 16 DOM
-
2026-06-02days on market $49,000 Active 15 DOM
-
2026-06-01days on market $49,000 Active 14 DOM
-
2026-05-31days on market $49,000 Active 13 DOM
-
2026-05-18$49,000 Active
ⓘ Source: listings_history table (triggers on properties + properties_extension) + one-shot
backfill from property_details.listing_events for pre-trigger history.
Tax reassessment forecast MO · Resets to sale price
- Current annual tax
- $196 · $16/mo
- Projected year-2 tax
- $475 · $40/mo
- Expected delta
- +$279/yr (+$23/mo · 142.2%)
ⓘ Screening estimate from a state-policy table — verify with the county assessor before closing.
Climate risk First Street
- Flood 1/10 Low FEMA zone X (unshaded) · 0% chance over 30 yrs
- Wildfire 5/10 Major
- Heat 5/10 Major 7 d/yr ≥108°F today · 20 d/yr by 30 yrs out
- Wind 2/10 Low 3% chance of damaging wind over 30 yrs
- Air quality 1/10 Low 0 unhealthy d/yr today · 0 by 30 yrs out
Nearby sold comps map
Loading sold comps map…
Walkable amenities ~0.75 mi
Loading nearby amenities…
Taxation est. · year 1
- Rental income
- $10,423
- − Mortgage interest
- −$2,745
- − Property taxes
- −$196
- − Insurance
- −$245
- − Repairs & maintenance
- −$834
- − Management
- −$834
- − Depreciation
- −$1,425
- Taxable income
- $4,144
- Est. tax owed @ 24.0%
- −$995
- After-tax cash flow
- $3,715/yr
For passive investors: Depreciation is non-cash, so a rental often shows a tax loss while cash-flowing — sheltering income. Rental losses are passive: they offset passive income freely, and up to $25,000/yr can offset ordinary (W-2) income if you actively participate and your MAGI is under $100k (phasing out to $0 by $150k); unused losses carry forward. On sale, claimed depreciation is recaptured at up to 25%, and gains may owe capital-gains tax (a 1031 exchange can defer both). Figures are a year-1 estimate at your 24.0% rate — not tax advice; consult a CPA.
Schools (NCES district)
- District
- Doniphan R-I
- NCES district ID
- 2910920
- Math proficiency
- 27% ▼ -3.00%
- Reading proficiency
- 39% ▼ -1.00%
- Median HH income
- $31,818
- Composite
- 26.91/100
- National rank
- #7085
- State rank
- #254 of 324 in MO
Livability — Doniphan
- Score
- 59/100
- State rank
- #568
- US rank
- #20561
Category grades
Schools grade is shown separately in the Schools card above.
Census & demographics
- Population (ZIP)
- 8,017
Population outlook (Ripley County) Hauer SSP2
- Today (2025)
- 13,011 people
- By 2030
- 12,515 · -3.8%
- By 2040
- 11,512 · -11.5%
- By 2050
- 10,427 · -19.9%
- By 2075
- 7,833 · -39.8%
- By 2100
- 5,692 · -56.3%
Race, ethnicity, and origin ACS 2023
- Neighborhood character
- Predominantly White (93%)
- Race & ethnicity
- White 93% Two or more races 5% Hispanic / Latino 1%
- Common ancestry
- Romanian 3% Slovak 3% Serbian 2%
- Foreign-born
- 1% · Canada
Political lean MEDSL · Ripley
- 2024 margin
- Solid R (+73.0) · D 13.2% · R 86.2%
- 2008→2024 swing
- -43.0pp toward R · 2008: -30.1pp · 2024: -73.0pp
- All cycles
- 2024: R+73.0 2020: R+70.1 2016: R+66.9 2012: R+44.6 2008: R+30.1
Not yet ingested
- Civics
- —
Market trends
- HPI YoY
- ▲ 5.14%
- Current HPI
- 122.3339
- Rent YoY
- —
- Metro
- —
- State GDP YoY
- ▲ 1.84%
- F500 in state
- 20
Industry mix (Fortune 500 HQ in MO)
| Industry | F500 HQs | Revenue |
|---|---|---|
| Healthcare | 1 | $163B |
|
||
| Insurance | 1 | $21B |
|
||
| Industrial Technology | 1 | $17B |
|
||
| Retail | 1 | $16B |
|
||
| Industrial Distribution | 1 | $10B |
|
||
| Utilities | 1 | $9B |
|
||
Price history
1 event — show timeline
- 2026-05-18 Listed $49,000 MARIS as Distributed by MLS Grid
Property tax history
+1.0%/yrLatest (2025): $196 · -3.2% YoY. Source: county tax records.
Cash-flow waterfall
monthlySold comps — $/sqft
last 12 mo · ≤1 miLoading sold comps…