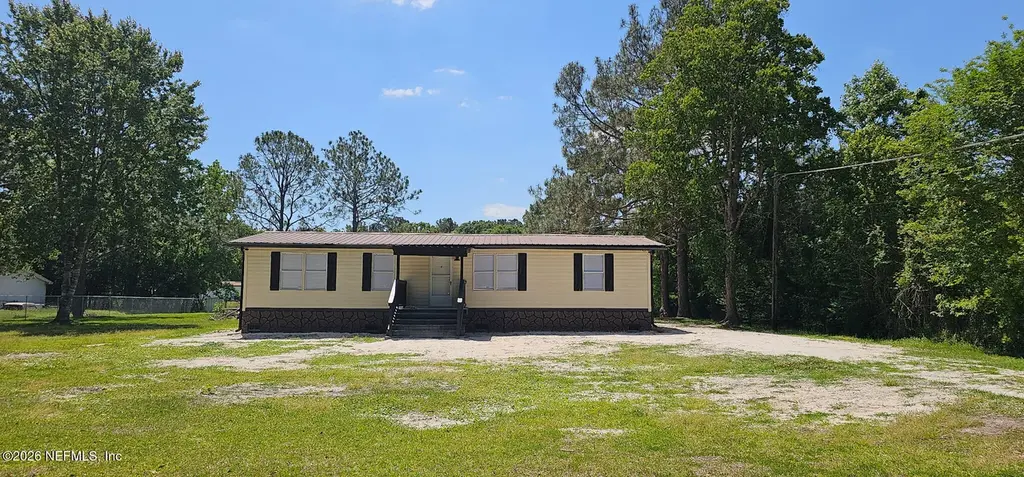
54332 Pelican Rd · Nassau Village-Ratliff, FL
Flood risk 5/10 · Moderate
- FEMA flood zone
- X (unshaded)
- Chance of flooding over 30 yrs
- 0.66%
- Est. flood insurance / yr
- $507 – $1,088
Fire risk 7/10 · Major
- Est. fire insurance / yr
- $947 – $1,759
Heat risk 9/10 · Severe
- Hot days now (above 108°F)
- 7 days/yr
- Hot days in 30 yrs
- 20 days/yr
Wind risk 9/10 · Severe
- Chance of severe wind over 30 yrs
- 99.0%
Air-quality risk 5/10 · Moderate
- Unhealthy air days now
- 8 days/yr
- Unhealthy air days in 30 yrs
- 8 days/yr
Risk factors via First Street. Map © Google.
Why this score? — see what drove the D- grade
The composite is a weighted blend of 9 inputs, each scored 0–100. Each bar is that input's sub-score; the figure is the points it added to the 100-point composite (weight × sub-score).
- Appreciation +10.0/10.0
- Cash flow +8.2/30.0
- Schools +6.0/10.0
- Rent growth +2.5/5.0
- Livability +2.5/5.0
- Condition / age +2.5/5.0
- DSCR +2.2/10.0
- 1% rule +1.4/10.0
- ARV discount +0.0/15.0
$235,000
🖨 Deal sheet (PDF) 📄 Offer letter ✓ Due diligence
Listing remarks
Welcome to this beautifully updated mobile home that perfectly blends charm, comfort, & convenience. Nestled on a spacious, fully fenced lot, this property offers both privacy & room to enjoy outdoor living-whether that's entertaining, gardening, or simply relaxing under the open sky. Step inside to find a thoughtfully renovated interior featuring modern finishes, fresh updates, and a move-in-ready feel. Every detail has been designed to maximize both style and functionality, making this home an ideal choice for first-time buyers, downsizers, or anyone looking for an affordable upgrade. Location is a standout feature here--conveniently situated just minutes from major interstates
Key facts
- Modern finishes
- Move in ready
- Fully fenced lot
Tags
Property features AI
Finance
- HOA & community: Not a senior community
Exterior
- Parking: Other parking
- Utilities: Septic tank; Electricity connected; Water connected; Sewer connected
- Home design: Manufactured double-wide home
- Construction: Metal roof
- Exterior features: Covered front porch; Full fencing; Shed(s) on the property; Asphalt road access
Interior
- Kitchen: Electric range; Refrigerator
- Bedrooms: 3 bedrooms
- Flooring: Vinyl
- Bathrooms: 2 full bathrooms
- Heating & cooling: Central heating (electric); Central air (electric)
- Interior features: Primary bathroom with tub and shower; Split-bedroom floorplan
- Laundry & utility: Electric water heater
Neighborhood map
What this means for you Summary
Snapshot
- This is a 3-bed/2.0-bath manufactured listed at $235k.
Deal economics
- At list price, monthly cash flow is $-223 ($-3k/yr) — negative.
- To cash-flow at today's rent, offer at most $196k (16.7% below list).
- To meet the 1% rule (rent ≥ 1% of price), the offer needs to be $150k (36.0% below list).
- Recommended offer: $150k (36.0% below list) — sets the bar for 1% rule.
- Cap rate 5.2% vs local median 2.1% in Nassau Village-Ratliff — top-decile yield for the area; either an underpriced asset or a hidden risk that comps aren't pricing in. Stress-test before assuming the spread holds.
Location & tenants
- Location reads: area grade D — affects rentability + tenant quality, not the cash-flow math above.
- Nassau (town): math 74% / reading 65% proficiency, ranked #4 of 73 in FL (top 6%) — acceptable for families but not a draw, mixed tenant base, ~2y average lease.
- Zoned schools: Callahan Elementary School (658 students, 51% FRL); Callahan Middle School (math 79% / reading 65%, grade A, #52 of 571 statewide, top 10%, 705 students, 46% FRL); West Nassau County High School (math 39% / reading 55%, grade D-, #207 of 667 statewide, top 32%, 974 students, 40% FRL).
- Market conditions: 103 active listings in the ZIP; 953 units permitted in Nassau County in 2024 (24 in 5+ unit buildings).
Forward outlook
- In year one you build about $25k of equity ($2k loan paydown + $24k appreciation (10.0% local appreciation)).
- Nassau County population projected at +17% by 2050 — long-run rental-demand tailwind backs the buy-and-hold thesis.
- By year 2, paydown + projected appreciation supports a ~$40k cash-out refi (75% LTV) — recoverable capital for the next deal without selling this one.
Negotiation context
- It's been on market 65 days — a 6% lower offer ($221k) is reasonable based on typical stale-listing flexibility.
Risks & watch-outs
- Climate carrying-cost: moderate flood risk; severe wind risk, 99% chance of damaging wind over 30y; major wildfire risk; extreme-heat days projected 7→20/yr by 2055 (HVAC capex compounding) — expect insurance premiums to compound above CPI over the hold.
Questions for the listing agent
- What do current leases actually rent for vs. the listed asking? Can we see a recent rent roll and the last 12 months of T-12 income?
- It's been on market 65 days. Have you received any prior offers? Is the seller open to a 36% concession, seller financing, or rate buy-down credit?
- Why hasn't it sold? Are there any deal-killer items the seller is aware of (foundation, flood, title, zoning, code violations)?
- Is there a deadline driving the sale (1031 exchange, divorce, estate, relocation)? That informs how much negotiation room exists.
- The area grade is low — what's the realistic commute time and amenity access for the typical tenant pool here? Any planned neighborhood developments (good or bad) we should know about?
- What's the average days-on-market for RENTAL listings here right now (not sales)? A rising rental-DOM trend means longer vacancies and softer asking-rent achievability than the comps imply.
- What's the recent tenant-quality profile in this submarket — average credit score on applications, eviction rate, late-payment / NSF rate, and stable-employment percentage? A property-management company in the area should have these aggregated.
- How much new for-sale + rental construction is in the pipeline within 1–3 miles? Heavy new supply typically softens prices + rents 12–24 months out; constrained supply supports both.
Investment metrics
- 1% rule
- 0.64% ✗
- Cap rate
- 5.16%
- Cash-on-cash
- -4.06%
- DSCR
- 0.82
- GRM
- 13.0
CMA / ARV
- ARV (on-the-fly)
- $164,736
- Comps found
- 5
Show comp detail 5 sales within ~0.75 mi
| Address | Dist | Beds/Ba | Sqft | Sold | Price | $/sf | Match |
|---|---|---|---|---|---|---|---|
| 54361 Seagull Dr | 0.07mi | 3/2.0 | 1,248 (+8%) | 6mo | $179,000 | $143 | 78 |
| 54041 Heller Rd | 0.26mi | 3/2.0 | 1,216 (+6%) | 23mo | $75,000 | $62 | 60 |
| 54055 Heller Rd | 0.28mi | 3/2.0 | 1,216 (+6%) | 23mo | $85,000 | $70 | 59 |
| 54002 Trooper Ct | 0.52mi | 2/2.0 (-1) | 1,056 (-8%) | 1mo | $155,000 | $147 | 56 |
| 54202 Sunshine Dr | 0.44mi | 2/2.0 (-1) | 1,086 (-6%) | 15mo | $215,000 | $198 | 52 |
Match score weights: distance 35% · size 25% · config 20% · recency 20%. Top-matched comps best support the ARV.
Projected returns pro-forma
10.0% appreciation · 3.0% rent growth · sell at horizon
- IRR
- 21.4%
- Equity multiple
- 2.73×
- Total profit
- $113,702
- Equity at exit
- $211,707
- IRR
- 19.3%
- Equity multiple
- 6.25×
- Total profit
- $345,766
- Equity at exit
- $456,553
Cash invested: $65,800 (down + closing). Projections, not guarantees.
Landlord ↔ Tenant lean methodology
- Overall (STATE)
- 87 Strongly Landlord-Friendly
- State Florida
- 87 Strongly Landlord-Friendly · R+3
- County
- — inherits STATE
- City
- — inherits STATE
ZIP-level market 32011
- Home prices YoY
- 19.2%
- Active inventory
- 103
- Price-to-rent
- 13.0×
Monthly cashflow live
- Estimated rent
- $1,503 medium interval (Pro) →
- Mortgage (P&I)
- −$1,232
- Tax from tax record
- −$80 /mo · $959/yr
- Insurance
- −$98
- HOA
- −$0
- Vacancy / Maint / Mgmt
- −$316
- Net cashflow
- $-223
Break-even live
Sensitivity live
| Price | -10% $-90 | -5% $-156 | +0% $-223 | +5% $-289 | +10% $-356 |
|---|---|---|---|---|---|
| Rent | -10% $-341 | -5% $-282 | +0% $-223 | +5% $-163 | +10% $-104 |
| Rate | -1.0pp $-104 | -0.5pp $-163 | base $-223 | +0.5pp $-283 | +1.0pp $-345 |
UW: 25.0% down · 7.5% · 30yr · 1.5% tax · 5.0% vac · 8.0% maint · 8.0% mgmt
Financing live
Cash to close
- Down payment
- $58,750
- Closing costs
- $7,050
- Reserves months
- —
- Total cash needed
- —
Loan-product check · same deal, 3 products live
Conventional
25% down · 7.5% · 30yr
- Down + closing
- —
- Monthly P&I
- —
- Monthly cashflow
- —
- DSCR
- —
- Eligible?
- —
Personal DTI + credit; lowest rate.
DSCR
20% down · 8.5% · 30yr
- Down + closing
- —
- Monthly P&I
- —
- Monthly cashflow
- —
- DSCR
- —
- Eligible?
- —
No personal income docs; deal must DSCR.
Hard money
10% down · 12.0% · 12mo
- Down + closing
- —
- Monthly P&I
- —
- Monthly cashflow
- —
- DSCR
- —
- Eligible?
- —
Short-term bridge; refi at stabilization.
Listing history 17 events
-
2026-06-21days on market $235,000 Active 65 DOM
-
2026-06-18days on market $235,000 Active 62 DOM
-
2026-06-17days on market $235,000 Active 61 DOM
-
2026-06-16days on market $235,000 Active 60 DOM
-
2026-06-15days on market $235,000 Active 59 DOM
-
2026-06-13days on market $235,000 Active 57 DOM
-
2026-06-13days on market $235,000 Active 56 DOM
-
2026-06-09days on market $235,000 Active 53 DOM
-
2026-06-08days on market $235,000 Active 52 DOM
-
2026-06-07days on market $235,000 Active 51 DOM
-
2026-06-05days on market $235,000 Active 48 DOM
-
2026-06-03days on market $235,000 Active 47 DOM
-
2026-06-02days on market $235,000 Active 46 DOM
-
2026-06-01days on market $235,000 Active 45 DOM
-
2026-05-31days on market $235,000 Active 44 DOM
-
2026-05-15price $235,000
-
2026-04-16$249,000 Active
ⓘ Source: listings_history table (triggers on properties + properties_extension) + one-shot
backfill from property_details.listing_events for pre-trigger history.
Tax reassessment forecast FL · Resets to sale price
- Current annual tax
- $959 · $80/mo
- Projected year-2 tax
- $1,950 · $163/mo
- Expected delta
- +$992/yr (+$83/mo · 103.5%)
ⓘ Screening estimate from a state-policy table — verify with the county assessor before closing.
Climate risk First Street
- Flood 5/10 Major FEMA zone X (unshaded) · 66% chance over 30 yrs
- Wildfire 7/10 Severe
- Heat 9/10 Extreme 7 d/yr ≥108°F today · 20 d/yr by 30 yrs out
- Wind 9/10 Extreme 99% chance of damaging wind over 30 yrs
- Air quality 5/10 Major 8 unhealthy d/yr today · 8 by 30 yrs out
Nearby sold comps map
Loading sold comps map…
Walkable amenities ~0.75 mi
Loading nearby amenities…
Taxation est. · year 1
- Rental income
- $18,039
- − Mortgage interest
- −$13,164
- − Property taxes
- −$959
- − Insurance
- −$1,175
- − Repairs & maintenance
- −$1,443
- − Management
- −$1,443
- − Depreciation
- −$6,836
- Taxable loss
- −$6,981
- Est. tax savings @ 24.0%
- +$1,675
- After-tax cash flow
- $-996/yr
For passive investors: Depreciation is non-cash, so a rental often shows a tax loss while cash-flowing — sheltering income. Rental losses are passive: they offset passive income freely, and up to $25,000/yr can offset ordinary (W-2) income if you actively participate and your MAGI is under $100k (phasing out to $0 by $150k); unused losses carry forward. On sale, claimed depreciation is recaptured at up to 25%, and gains may owe capital-gains tax (a 1031 exchange can defer both). Figures are a year-1 estimate at your 24.0% rate — not tax advice; consult a CPA.
Schools (NCES district)
- District
- Nassau
- NCES district ID
- 1201350
- Math proficiency
- 74% ▼ -2.00%
- Reading proficiency
- 65% ▼ -2.00%
- Median HH income
- $58,267
- Composite
- 59.79/100
- National rank
- #899
- State rank
- #4 of 73 in FL
Livability — Nassau Village-Ratliff
No livability data for this city. (Only ~50 U.S. cities are tracked.)
Census & demographics
- Census place
- Nassau Village-Ratliff, FL
- Population (ZIP)
- 15,716
Population outlook (Nassau County) Hauer SSP2
- Today (2025)
- 88,419 people
- By 2030
- 92,679 · +4.8%
- By 2040
- 99,257 · +12.3%
- By 2050
- 103,378 · +16.9%
- By 2075
- 109,726 · +24.1%
- By 2100
- 107,006 · +21.0%
Race, ethnicity, and origin ACS 2023
- Neighborhood character
- Predominantly White (92%)
- Race & ethnicity
- White 92% Black 3% Hispanic / Latino 3% Two or more races 3%
- Common ancestry
- Italian 2% Slovak 2% Lithuanian 1%
- Foreign-born
- 2% · Canada
- Languages at home
- 98% English-only · Spanish 1%
Political lean MEDSL · Nassau
- 2024 margin
- Solid R (+46.9) · D 26.1% · R 73.1%
- 2008→2024 swing
- -3.1pp toward R · 2008: -43.8pp · 2024: -46.9pp
- All cycles
- 2024: R+46.9 2020: R+45.9 2016: R+50.2 2012: R+48.6 2008: R+43.8
Not yet ingested
- Civics
- —
Market trends
- HPI YoY
- ▲ 56.56%
- Current HPI
- 351.8301
- Rent YoY
- —
- Metro
- —
- State GDP YoY
- ▲ 3.28%
- F500 in state
- 36
Industry mix (Fortune 500 HQ in FL)
| Industry | F500 HQs | Revenue |
|---|---|---|
| Industrial Technology | 2 | $29B |
|
||
| Insurance | 2 | $17B |
|
||
| Retail | 1 | $60B |
|
||
| Technology Distribution | 1 | $58B |
|
||
| Homebuilding | 1 | $35B |
|
||
| Technology Manufacturing | 1 | $35B |
|
||
Price history
-5.6% since first listed2 events — show timeline
- 2026-05-15 Price Changed $235,000 realMLS
- 2026-04-16 Listed $249,000 realMLS
Property tax history
+8.9%/yrLatest (2025): $959 · +13.7% YoY. Source: county tax records.
Cash-flow waterfall
monthlySold comps — $/sqft
last 12 mo · ≤1 miLoading sold comps…