 Multi-family
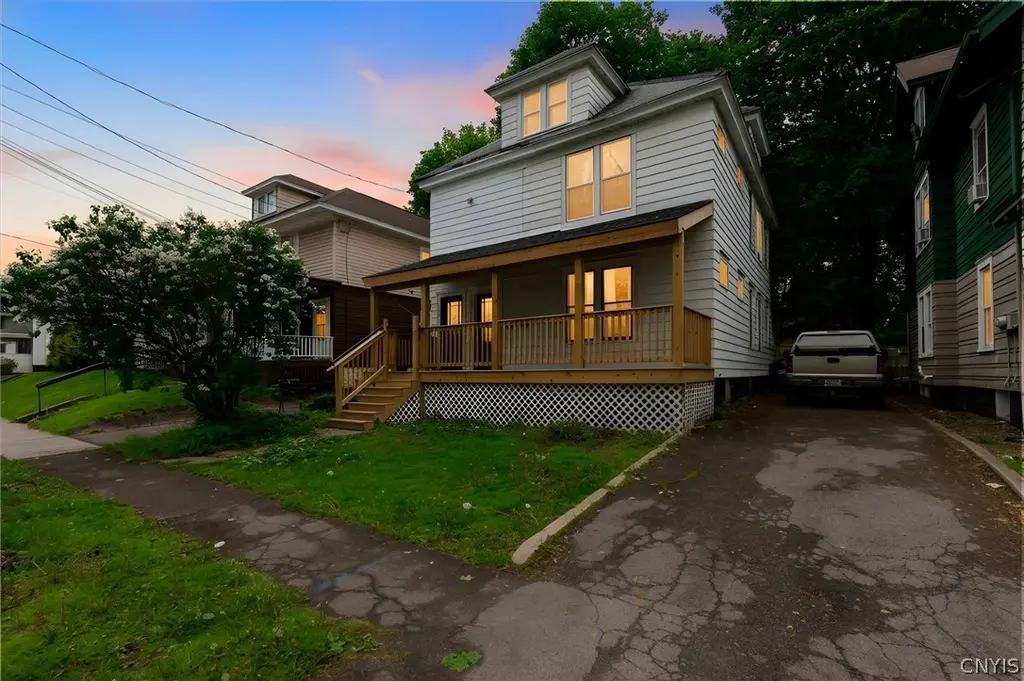
172 S Midler Ave · Syracuse, NY
Flood risk 1/10 · Minimal
- FEMA flood zone
- X (unshaded)
- Chance of flooding over 30 yrs
- 0.0%
- Est. flood insurance / yr
- $473 – $860
Fire risk 1/10 · Minimal
- Est. fire insurance / yr
- $691 – $1,283
Heat risk 3/10 · Minor
- Hot days now (above 95°F)
- 7 days/yr
- Hot days in 30 yrs
- 16 days/yr
Wind risk 1/10 · Minimal
- Chance of severe wind over 30 yrs
- 0.0%
Air-quality risk 2/10 · Minimal
- Unhealthy air days now
- 0 days/yr
- Unhealthy air days in 30 yrs
- 1 days/yr
Risk factors via First Street. Map © Google.
Why this score? — see what drove the B grade
The composite is a weighted blend of 9 inputs, each scored 0–100. Each bar is that input's sub-score; the figure is the points it added to the 100-point composite (weight × sub-score).
- Cash flow +30.0/30.0
- ARV discount +13.7/15.0
- DSCR +10.0/10.0
- 1% rule +8.3/10.0
- Rent growth +4.0/5.0
- Livability +3.9/5.0
- Condition / age +2.5/5.0
- Schools +1.8/10.0
- Appreciation +0.0/10.0
$225,000
🖨 Deal sheet 📄 Offer letter ✓ Due diligence
Multi-family units
County records classify this as Multi-Family (2-4 Unit). Listing-text estimate: 1 unit. estimate disagrees with records
Listing remarks MLS
This well maintained two unit is grossing $2450 per month.
Key facts
- Situated near parks
- 5,280 sq ft lot
- 2 parking spots
Tags
Property features AI
Finance
- Other: Two separate electric meters; Two separate gas meters; Two total dwelling units in the building; One unit reported with current rent of $1,250
- Financial info: Owner pays for water; Rent includes water; Operating expense details: See remarks
Exterior
- Parking: Two or more off-street parking spaces
- Security: No security features provided
- Utilities: Public water connected; Sewer connected
- Home design: Two-story building; Existing/resale property
- Construction: Aluminum siding
- Exterior features: Rectangular residential lot; City street frontage; Lot dimensions approximately 40 x 132
Interior
- Kitchen: No specific kitchen appliance list provided
- Bedrooms: Two 2-bedroom units
- Flooring: Hardwood; Varies by area
- Bathrooms: Each unit has one full bathroom (total 2 full bathrooms in the building)
- Heating & cooling: Gas forced-air heating
- Interior features: Full basement; Hardwood and varied flooring throughout
- Laundry & utility: Gas water heater
Neighborhood map
What this means for you Summary
Snapshot
- This is a 4-bed/2.0-bath multifamily listed at $225k.
Deal economics
- At list price, monthly cash flow is $973 ($12k/yr) — positive.
- The deal already cash-flows at list — no discount required.
- Meets the 1% rule at list price ($3k rent vs $225k).
- Recommended offer: $222k (1.5% below list) — sets the bar for market timing.
- Cap rate 11.5% vs local median 8.2% in Syracuse — top-decile yield for the area; either an underpriced asset or a hidden risk that comps aren't pricing in. Stress-test before assuming the spread holds.
Location & tenants
- Location reads 77/100 on livability (#187 in NY, #2,869 nationally) — a middle-class / working-renter tenant base. Strengths: amenities A+, commute A+, cost of living A+; Watch: schools D+, crime F, employment D-.
- Syracuse City School District (urban): math 18% / reading 26% proficiency, ranked #590 of 590 in NY (top 100%) — low school quality limits family demand, transient renter base, plan for 1-2y turnover; 74% free/reduced lunch — lower-income household profile, screen leases tightly.
- Market conditions: Rents rising fast (+5.8%/yr); 42 active listings in the ZIP; 3 comparable units currently listed for rent nearby; rentals at typical pace (median 21d on market — plan ~3-4 weeks tenant-placement turnaround); 616 units permitted in Onondaga County in 2024 (256 in 5+ unit buildings).
- At $3,001/mo this rent would consume 57% of the median local household income ($63k/yr) (locally 725% of renters already pay >50% of income on rent) — very limited rent-growth headroom before tenants either downsize or default.
Forward outlook
- Local home prices are declining (-3.0%/yr); year-one equity from $2k of loan paydown is wiped out by about $7k of value loss. Plan a longer hold.
- Onondaga County population projected to shrink 9% by 2050 — rents likely to lag national; underwrite the cash flow, not the appreciation.
- At projected returns (-3.0% appreciation + 5.8% rent growth), your $63k cash investment doubles in ~6 years — after that, you're playing with house money.
Negotiation context
- It's been on market 19 days — a 2% lower offer ($222k) is reasonable based on typical stale-listing flexibility.
- 2 sale attempts since 4y ago with the ask held roughly flat each time — persistent listings suggest the price (not the market) is what's stuck; bring a comps-based counter.
- Current owner paid $138k; list at $225k implies a 63% gain — meaningful room to come down on a strong offer.
Risks & watch-outs
- Watch-outs: built in 1925 — expect roof / HVAC / electrical / plumbing capex.
Questions for the listing agent
- Built in 1925 — when were the roof, HVAC, electrical panel, plumbing, and water heater last replaced?
- Is there a deadline driving the sale (1031 exchange, divorce, estate, relocation)? That informs how much negotiation room exists.
- Schools are D-rated, which usually means shorter tenancies and higher turnover. Who's the typical renter profile here, and what's been the actual vacancy rate?
- Crime grade is F in this area — have there been break-ins, vandalism, or insurance claims at this property in the last 3 years? What carrier currently insures it and at what premium?
- What's the average days-on-market for RENTAL listings here right now (not sales)? A rising rental-DOM trend means longer vacancies and softer asking-rent achievability than the comps imply.
- What's the recent tenant-quality profile in this submarket — average credit score on applications, eviction rate, late-payment / NSF rate, and stable-employment percentage? A property-management company in the area should have these aggregated.
- How much new apartment / multifamily construction is in the pipeline within 1–3 miles? Heavy new supply (>2% of stock underway) typically softens rents 12–24 months out; light construction supports rent growth.
Investment metrics
- 1% rule
- 1.33% ✓
- Cap rate
- 11.48%
- Cash-on-cash
- 18.54%
- DSCR
- 1.82
- GRM
- 6.2
CMA / ARV
- ARV (on-the-fly)
- $260,728
- Comps found
- 9
Show comp detail 9 sales within ~0.75 mi
| Address | Dist | Beds/Ba | Sqft | Sold | Price | $/sf | Match |
|---|---|---|---|---|---|---|---|
| 336 S Collingwood Ave | 0.29mi | 4/2.0 | 2,208 (-8%) | 2mo | $267,000 | $121 | 72 |
| 159 Norwood & Tyson Pl Ave | 0.35mi | 4/4.0 | 2,352 (-2%) | 18mo | $281,100 | $120 | 58 |
| 257-259 Forest Hill Dr | 0.32mi | 4/2.0 | 2,168 (-9%) | 15mo | $273,500 | $126 | 57 |
| 176 S Midler Ave | 0.28mi | 5/2.0 (+1) | 2,250 (-6%) | 19mo | $220,000 | $98 | 56 |
| 161-63 S Collingwood Ave | 0.10mi | 5/3.0 (+1) | 2,748 (+15%) | 11mo | $300,000 | $109 | 52 |
| 2107 Burnet Ave | 0.59mi | 5/2.0 (+1) | 2,354 (-2%) | 18mo | $224,900 | $96 | 50 |
| 291 N Midler Ave | 0.46mi | 3/2.0 (-1) | 2,088 (-13%) | 12mo | $190,000 | $91 | 43 |
| 300 Marlborough Rd | 0.49mi | 4/2.0 | 2,112 (-12%) | 19mo | $155,000 | $73 | 42 |
| 106 Shotwell Park | 0.55mi | 4/2.0 | 2,664 (+11%) | 20mo | $370,000 | $139 | 39 |
Match score weights: distance 35% · size 25% · config 20% · recency 20%. Top-matched comps best support the ARV.
Projected returns pro-forma
-3.0% appreciation · 5.85% rent growth · sell at horizon
- IRR
- 13.2%
- Equity multiple
- 1.54×
- Total profit
- $34,323
- Equity at exit
- $33,548
- IRR
- 24.1%
- Equity multiple
- 3.35×
- Total profit
- $147,999
- Equity at exit
- $19,454
Cash invested: $63,000 (down + closing). Projections, not guarantees.
Landlord ↔ Tenant lean methodology
- Overall (STATE)
- 15 Strongly Tenant-Friendly
- State New York
- 15 Strongly Tenant-Friendly · D+10
- County
- — inherits STATE
- City
- — inherits STATE
ZIP-level market 13206
- Home prices YoY
- -7.1%
- Rents YoY
- 5.8%
- Active inventory
- 42
- Price-to-rent
- 12.5×
Monthly cashflow live
- Estimated rent
- $3,001 high interval (Pro) →
- Mortgage (P&I)
- −$1,180
- Tax from tax record
- −$124 /mo · $1,487/yr
- Insurance
- −$94
- HOA
- −$0
- Vacancy / Maint / Mgmt
- −$630
- Net cashflow
- $973
Break-even live
2-unit breakdown (identical units grouped — click to expand)
| Units | Beds | Baths | Est. rent |
|---|---|---|---|
| 2× units | 2 | 1 | $3,002 |
| #1 | 2 | 1 | $1,501 |
| #2 | 2 | 1 | $1,501 |
| Total (2 units) | $3,001 | ||
UW: 25.0% down · 7.5% · 30yr · 1.5% tax · 5.0% vac · 8.0% maint · 8.0% mgmt
Financing live
Cash to close
- Down payment
- $56,250
- Closing costs
- $6,750
- Reserves months
- —
- Total cash needed
- —
Loan-product check · same deal, 3 products live
Conventional
25% down · 7.5% · 30yr
- Down + closing
- —
- Monthly P&I
- —
- Monthly cashflow
- —
- DSCR
- —
- Eligible?
- —
Personal DTI + credit; lowest rate.
DSCR
20% down · 8.5% · 30yr
- Down + closing
- —
- Monthly P&I
- —
- Monthly cashflow
- —
- DSCR
- —
- Eligible?
- —
No personal income docs; deal must DSCR.
Hard money
10% down · 12.0% · 12mo
- Down + closing
- —
- Monthly P&I
- —
- Monthly cashflow
- —
- DSCR
- —
- Eligible?
- —
Short-term bridge; refi at stabilization.
Rent comps 3 comps
| Address | Beds | Baths | Sqft | Rent | $/sqft | DOM | Units | Dist |
|---|---|---|---|---|---|---|---|---|
| 202 Stafford Ave Syracuse, NY | 3.0 | 1.0 | 1692 | $1,800 | $1.06 | 13d | 1 | 0.40mi |
| 1607 Burnet Ave Unit 1 Syracuse, NY | 3.0 | 1.0 | 2538 | $1,650 | $0.65 | 21d | 1 | 0.86mi |
| 409 Westmoreland Ave Unit 9 Syracuse, NY | 3.0 | 1.0 | 2480 | $2,200 | $0.89 | 43d | 1 | 1.46mi |
Listing history 18 events
-
2026-06-13status $225,000 Pending 19 DOM
-
2026-06-10days on market $225,000 Active Under Contract 19 DOM
-
2026-06-09days on market $225,000 Active Under Contract 18 DOM
-
2026-06-08days on market $225,000 Active Under Contract 17 DOM
-
2026-06-07days on market $225,000 Active Under Contract 16 DOM
-
2026-06-05days on market $225,000 Active Under Contract 13 DOM
-
2026-06-02days on market $225,000 Active Under Contract 11 DOM
-
2026-06-01days on market $225,000 Active Under Contract 10 DOM
-
2026-05-31days on market $225,000 Active Under Contract 9 DOM
-
2026-05-30statusdays on market $225,000 Active Under Contract 8 DOM
-
2026-05-21$225,000 Active
-
2023-12-15soldstatus $138,000
-
2023-12-14status Pending Sale 58-char remark
Show marketing remark (58 chars)
This well maintained two unit is grossing $2450 per month.
-
2023-12-11soldstatus $138,000 Closed Sale or Rented 58-char remark
Show marketing remark (58 chars)
This well maintained two unit is grossing $2450 per month.
-
2023-01-28historical 58-char remark
Show marketing remark (58 chars)
This well maintained two unit is grossing $2450 per month.
-
2022-12-12historical Continue to Show- Under Contract 58-char remark
Show marketing remark (58 chars)
This well maintained two unit is grossing $2450 per month.
-
2022-08-30$139,900 Active 58-char remark
Show marketing remark (58 chars)
This well maintained two unit is grossing $2450 per month.
-
2020-01-27soldstatus $59,500
ⓘ Source: listings_history table (triggers on properties + properties_extension) + one-shot
backfill from property_details.listing_events for pre-trigger history.
Tax reassessment forecast NY · Partial reset (capped growth)
- Current annual tax
- $1,487 · $124/mo
- Projected year-2 tax
- $2,645 · $220/mo
- Expected delta
- +$1,158/yr (+$96/mo · 77.9%)
ⓘ Screening estimate from a state-policy table — verify with the county assessor before closing.
Climate risk First Street
- Flood 1/10 Low FEMA zone X (unshaded) · 0% chance over 30 yrs
- Wildfire 1/10 Low
- Heat 3/10 Moderate 7 d/yr ≥95°F today · 16 d/yr by 30 yrs out
- Wind 1/10 Low 0% chance of damaging wind over 30 yrs
- Air quality 2/10 Low 0 unhealthy d/yr today · 1 by 30 yrs out
Nearby sold comps map
Loading sold comps map…
Walkable amenities ~0.75 mi
Loading nearby amenities…
Taxation est. · year 1
- Rental income
- $36,012
- − Mortgage interest
- −$12,603
- − Property taxes
- −$1,487
- − Insurance
- −$1,125
- − Repairs & maintenance
- −$2,881
- − Management
- −$2,881
- − Depreciation
- −$6,545
- Taxable income
- $8,489
- Est. tax owed @ 24.0%
- −$2,037
- After-tax cash flow
- $9,641/yr
For passive investors: Depreciation is non-cash, so a rental often shows a tax loss while cash-flowing — sheltering income. Rental losses are passive: they offset passive income freely, and up to $25,000/yr can offset ordinary (W-2) income if you actively participate and your MAGI is under $100k (phasing out to $0 by $150k); unused losses carry forward. On sale, claimed depreciation is recaptured at up to 25%, and gains may owe capital-gains tax (a 1031 exchange can defer both). Figures are a year-1 estimate at your 24.0% rate — not tax advice; consult a CPA.
Schools (NCES district)
- District
- Syracuse City School District
- NCES district ID
- 3628590
- Math proficiency
- 18% ▼ -5.00%
- Reading proficiency
- 26% ▬ 0.00%
- Median HH income
- $32,097
- Composite
- 17.83/100
- National rank
- #9007
- State rank
- #590 of 590 in NY
Livability — Syracuse
- Score
- 77/100
- State rank
- #187
- US rank
- #2869
Category grades
Schools grade is shown separately in the Schools card above.
Census & demographics
- Census place
- Syracuse, NY
- County
- Onondaga County · 247,257 people
- City population
- 152,627
- Metro
- Syracuse, NY
- Population (ZIP)
- 16,245
- Household income
- $63,136
- Rent vs Own
- Severe rent burden
- 725.0
Population outlook (Onondaga County) Hauer SSP2
- Today (2025)
- 467,894 people
- By 2030
- 463,381 · -1.0%
- By 2040
- 447,697 · -4.3%
- By 2050
- 426,399 · -8.9%
- By 2075
- 373,661 · -20.1%
- By 2100
- 307,967 · -34.2%
Race, ethnicity, and origin ACS 2023
- Neighborhood character
- Predominantly White (67%)
- Race & ethnicity
- White 67% Black 13% Two or more races 9% Hispanic / Latino 8% Asian 5%
- Hispanic origin (detail)
- Puerto Rican 4%
- Common ancestry
- Romanian 6% Lithuanian 4% Slovak 2%
- Foreign-born
- 8% · Canada, Jamaica, China
- Languages at home
- 89% English-only · Spanish 3% Arabic 2% Other Indo-European 1%
Political lean MEDSL · Onondaga
- 2024 margin
- D (+17.3) · D 58.6% · R 41.4%
- 2008→2024 swing
- -3.0pp toward R · 2008: 20.3pp · 2024: 17.3pp
- All cycles
- 2024: D+17.3 2020: D+20.6 2016: D+12.8 2012: D+21.1 2008: D+20.3
Not yet ingested
- Civics
- —
Market trends
- HPI YoY
- ▼ -24.60%
- Current HPI
- 322.231
- Rent YoY
- ▲ 5.85%
- Metro
- Syracuse, NY
- State GDP YoY
- ▲ 2.60%
- F500 in state
- 92
Industry mix (Fortune 500 HQ in NY)
| Industry | F500 HQs | Revenue |
|---|---|---|
| Financial Services | 10 | $950B |
|
||
| Consumer Goods | 9 | $162B |
|
||
| Insurance | 4 | $225B |
|
||
| Telecommunications | 2 | $144B |
|
||
| Pharmaceuticals | 2 | $112B |
|
||
| Media / Entertainment | 2 | $69B |
|
||
Price history
+278.2% since first listed8 events — show timeline
- 2026-05-21 Listed $225,000 CNYIS
- 2023-12-15 Sold (Public Records) $138,000 Public Records
- 2023-12-14 Pending — CNYIS
- 2023-12-11 Sold (MLS) $138,000 CNYIS
- 2023-01-28 Listing Removed — CNYIS
- 2022-12-12 Contingent — CNYIS
- 2022-08-30 Listed $139,900 CNYIS
- 2020-01-27 Sold (Public Records) $59,500 Public Records
Property tax history
+2.6%/yrLatest (2025): $1,487 · +0.0% YoY. Source: county tax records.
Cash-flow waterfall
monthlySold comps — $/sqft
last 12 mo · ≤1 miLoading sold comps…