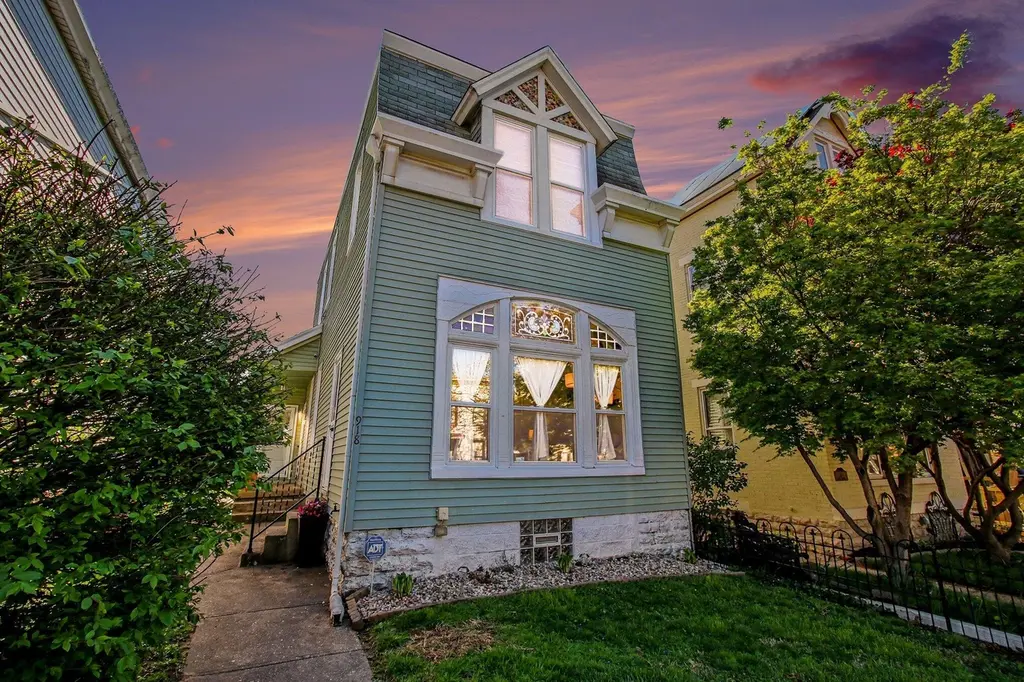
918 Park Ave · Newport, KY
Flood risk 1/10 · Minimal
- FEMA flood zone
- X (unshaded)
- Chance of flooding over 30 yrs
- 0.0%
- Est. flood insurance / yr
- $473 – $860
Fire risk 1/10 · Minimal
- Est. fire insurance / yr
- $839 – $1,559
Heat risk 5/10 · Moderate
- Hot days now (above 103°F)
- 7 days/yr
- Hot days in 30 yrs
- 19 days/yr
Wind risk 2/10 · Minimal
- Chance of severe wind over 30 yrs
- 1.0%
Air-quality risk 3/10 · Minor
- Unhealthy air days now
- 2 days/yr
- Unhealthy air days in 30 yrs
- 3 days/yr
Risk factors via First Street. Map © Google.
Why this score? — see what drove the D grade
The composite is a weighted blend of 9 inputs, each scored 0–100. Each bar is that input's sub-score; the figure is the points it added to the 100-point composite (weight × sub-score).
- ARV discount +15.0/15.0
- Cash flow +11.1/30.0
- Livability +4.1/5.0
- Rent growth +3.7/5.0
- DSCR +3.2/10.0
- Condition / age +2.5/5.0
- 1% rule +2.0/10.0
- Schools +1.7/10.0
- Appreciation +0.0/10.0
$274,900
🖨 Deal sheet (PDF) 📄 Offer letter ✓ Due diligence
Listing remarks MLS
**********Sold When Submitted*********************
Key facts
- Mini-split system
- Updated kitchen
- Off-street parking
Tags
Property features AI
Finance
- Financial info: Home warranty included
Exterior
- Parking: Driveway; Off-street parking; On-street parking
- Utilities: Public water; Public sewer; Natural gas available
- Home design: Single family residence; Two levels; Existing structure; Built in 1893
- Construction: Stone construction; Stone foundation; Composition shingle roof
- Exterior features: Deck; Private yard; Shed(s); Metal and privacy fencing; Paved road access
Interior
- Kitchen: Stainless steel appliances; Gas range; Dishwasher; Refrigerator
- Bedrooms: Primary Bedroom (15 x 15); Bedroom 2 (15 x 15)
- Bathrooms: 1 full bathroom; 2 half bathrooms; Primary Bath (8 x 5); Bathroom 2 (4 x 5)
- Heating & cooling: Has heating; Ductless cooling
- Interior features: Kitchen island; Granite counters; Ceiling fan(s); Inoperable fireplace
- Laundry & utility: Washer; Dryer; Gas dryer hookup; Laundry in basement
Neighborhood map
What this means for you Summary
Snapshot
- This is a 2-bed/1.5-bath single-family listed at $275k.
Deal economics
- At list price, monthly cash flow is $-113 ($-1k/yr) — negative.
- To cash-flow at today's rent, offer at most $255k (7.2% below list).
- To meet the 1% rule (rent ≥ 1% of price), the offer needs to be $193k (29.6% below list).
- Recommended offer: $193k (29.6% below list) — sets the bar for 1% rule.
Location & tenants
- Location reads 82/100 on livability (#58 in KY, #1,070 nationally) — a professional / high-income tenant draw. Strengths: amenities A+, commute A+, cost of living A+; Watch: crime F, employment D-.
- Newport Independent (suburban): math 14% / reading 26% proficiency, ranked #160 of 165 in KY (top 97%) — low school quality limits family demand, transient renter base, plan for 1-2y turnover; 79% free/reduced lunch — lower-income household profile, screen leases tightly.
- Zoned schools: Newport Intermediate School (math 12% / reading 22%, grade F, #607 of 676 statewide, top 91%, 387 students, 89% FRL); Newport High School (math 16% / reading 28%, grade F, #202 of 254 statewide, top 82%, 579 students, 84% FRL).
- Market conditions: Rents rising fast (+4.6%/yr); 239 active listings in the ZIP; 19 comparable units currently listed for rent nearby; rentals leasing fast (median 0d on market — plan ~1-2 weeks tenant-placement turnaround); 247 units permitted in Campbell County in 2024 (77 in 5+ unit buildings).
- This rent runs 39% of the median local income ($60k/yr) — at the standard rent-burdened threshold; future hikes will face affordability resistance.
Forward outlook
- Local home prices are declining (-3.0%/yr); year-one equity from $2k of loan paydown is wiped out by about $8k of value loss. Plan a longer hold.
Negotiation context
- Only 11 days on market — expect competitive offers; lowballing is unlikely to land.
- 5 sale attempts since 23y ago with the ask held roughly flat each time — persistent listings suggest the price (not the market) is what's stuck; bring a comps-based counter.
Risks & watch-outs
- Watch-outs: built in 1893 — expect roof / HVAC / electrical / plumbing capex.
- Climate carrying-cost: extreme-heat days projected 7→19/yr by 2055 (HVAC capex compounding) — expect insurance premiums to compound above CPI over the hold.
Questions for the listing agent
- What do current leases actually rent for vs. the listed asking? Can we see a recent rent roll and the last 12 months of T-12 income?
- Built in 1893 — when were the roof, HVAC, electrical panel, plumbing, and water heater last replaced?
- Is there a deadline driving the sale (1031 exchange, divorce, estate, relocation)? That informs how much negotiation room exists.
- Schools are D-rated, which usually means shorter tenancies and higher turnover. Who's the typical renter profile here, and what's been the actual vacancy rate?
- Crime grade is F in this area — have there been break-ins, vandalism, or insurance claims at this property in the last 3 years? What carrier currently insures it and at what premium?
- The area grade is low — what's the realistic commute time and amenity access for the typical tenant pool here? Any planned neighborhood developments (good or bad) we should know about?
- What's the average days-on-market for RENTAL listings here right now (not sales)? A rising rental-DOM trend means longer vacancies and softer asking-rent achievability than the comps imply.
- What's the recent tenant-quality profile in this submarket — average credit score on applications, eviction rate, late-payment / NSF rate, and stable-employment percentage? A property-management company in the area should have these aggregated.
- How much new for-sale + rental construction is in the pipeline within 1–3 miles? Heavy new supply typically softens prices + rents 12–24 months out; constrained supply supports both.
Investment metrics
- 1% rule
- 0.70% ✗
- Cap rate
- 5.80%
- Cash-on-cash
- -1.76%
- DSCR
- 0.92
- GRM
- 11.8
CMA / ARV
- ARV (median comp)
- $371,774
- List price
- $274,900
- Delta
- -26.06%
- Verdict
- UNDERPRICED
- Comps
- 20 within 1.0 mi
Show comp detail 12 sales within ~0.75 mi
| Address | Dist | Beds/Ba | Sqft | Sold | Price | $/sf | Match |
|---|---|---|---|---|---|---|---|
| 918 Park Ave | 0.00mi | 2/2.0 | 1,854 (0%) | 1mo | $280,000 | $151 | 97 |
| 335 E 10th St | 0.11mi | 3/1.5 (+1) | 1,950 (+5%) | 3mo | $275,000 | $141 | 79 |
| 506 Center St | 0.17mi | 2/1.0 | 1,611 (-13%) | 3mo | $315,000 | $196 | 66 |
| 909 York St | 0.43mi | 3/2.0 (+1) | 1,917 (+3%) | 3mo | $360,000 | $188 | 64 |
| 29 15th St | 0.49mi | 3/1.5 (+1) | 1,912 (+3%) | 4mo | $315,000 | $165 | 64 |
| 562 E 4th St E | 0.48mi | 3/1.5 (+1) | 1,680 (-9%) | 2mo | $462,425 | $275 | 55 |
| 1019 Monmouth St | 0.32mi | 3/3.0 (+1) | 1,625 (-12%) | 1mo | $545,000 | $335 | 53 |
| 519 Lexington Ave | 0.53mi | 2/2.0 | 1,610 (-13%) | 1mo | $439,900 | $273 | 50 |
| 530 Lexington Ave | 0.51mi | 3/2.5 (+1) | 2,122 (+14%) | 0mo | $600,000 | $283 | 43 |
| 64 Parkview Ave | 0.62mi | 3/2.0 (+1) | 1,620 (-13%) | 2mo | $130,000 | $80 | 41 |
| 118 Beech St | 0.68mi | 3/2.0 (+1) | 1,610 (-13%) | 2mo | $300,000 | $186 | 38 |
| 39 19th St | 0.74mi | 3/2.5 (+1) | 1,590 (-14%) | 4mo | $260,000 | $164 | 30 |
Match score weights: distance 35% · size 25% · config 20% · recency 20%. Top-matched comps best support the ARV.
Projected returns pro-forma
-3.0% appreciation · 4.64% rent growth · sell at horizon
- IRR
- -17.7%
- Equity multiple
- 0.37×
- Total profit
- $-48,608
- Equity at exit
- $40,988
- IRR
- -7.4%
- Equity multiple
- 0.50×
- Total profit
- $-38,331
- Equity at exit
- $23,768
Cash invested: $76,972 (down + closing). Projections, not guarantees.
Landlord ↔ Tenant lean methodology
- Overall (STATE)
- 83 Strongly Landlord-Friendly
- State Kentucky
- 83 Strongly Landlord-Friendly · R+16
- County
- — inherits STATE
- City
- — inherits STATE
ZIP-level market 41071
- Rents YoY
- 4.6%
- Active inventory
- 239
- Price-to-rent
- 11.8×
Monthly cashflow live
- Estimated rent
- $1,934 high interval (Pro) →
- Mortgage (P&I)
- −$1,442
- Tax from tax record
- −$84 /mo · $1,014/yr
- Insurance
- −$115
- HOA
- −$0
- Vacancy / Maint / Mgmt
- −$406
- Net cashflow
- $-113
Break-even live
Sensitivity live
| Price | -10% $43 | -5% $-35 | +0% $-113 | +5% $-190 | +10% $-268 |
|---|---|---|---|---|---|
| Rent | -10% $-265 | -5% $-189 | +0% $-113 | +5% $-36 | +10% $40 |
| Rate | -1.0pp $26 | -0.5pp $-43 | base $-113 | +0.5pp $-184 | +1.0pp $-256 |
UW: 25.0% down · 7.5% · 30yr · 1.5% tax · 5.0% vac · 8.0% maint · 8.0% mgmt
Financing live
Cash to close
- Down payment
- $68,725
- Closing costs
- $8,247
- Reserves months
- —
- Total cash needed
- —
Loan-product check · same deal, 3 products live
Conventional
25% down · 7.5% · 30yr
- Down + closing
- —
- Monthly P&I
- —
- Monthly cashflow
- —
- DSCR
- —
- Eligible?
- —
Personal DTI + credit; lowest rate.
DSCR
20% down · 8.5% · 30yr
- Down + closing
- —
- Monthly P&I
- —
- Monthly cashflow
- —
- DSCR
- —
- Eligible?
- —
No personal income docs; deal must DSCR.
Hard money
10% down · 12.0% · 12mo
- Down + closing
- —
- Monthly P&I
- —
- Monthly cashflow
- —
- DSCR
- —
- Eligible?
- —
Short-term bridge; refi at stabilization.
Rent comps 19 comps
| Address | Beds | Baths | Sqft | Rent | $/sqft | DOM | Units | Dist |
|---|---|---|---|---|---|---|---|---|
| 929 Boone St Newport, KY | 2.0 | 2.0 | 1458 | $1,495 | $1.03 | 45d | 1 | 0.09mi |
| 814 Washington Ave Unit 2 Newport, KY | 2.0 | 2.0 | 1450 | $1,500 | $1.03 | 25d | 1 | 0.20mi |
| 1044 Washington Ave #2 Newport, KY | 2.0 | 2.0 | 1250 | $1,800 | $1.44 | 45d | 1 | 0.26mi |
| 100 Aqua Way Newport, KY | 1.0–3.0 | 1.0–2.0 | 1092 | $2,854 | $2.61 | 0d | 5 | 0.61mi |
| 203 W 8th St Newport, KY | 2.0 | 1.5 | 1456 | $2,300 | $1.58 | 0d | 1 | 0.64mi |
| 118 Beech St Newport, KY | 3.0 | 2.0 | 1610 | $2,400 | $1.49 | 0d | 1 | 0.65mi |
| 809 Isabella St Newport, KY | 2.0 | 2.0 | 1519 | $2,200 | $1.45 | 45d | 1 | 0.70mi |
| 140 W 13th St Newport, KY | 3.0 | 3.5 | 2505 | $4,200 | $1.68 | 14d | 1 | 0.73mi |
| 327 Covert Run Pike Unit 1 Bellevue, KY | 2.0 | 2.0 | 1580 | $1,850 | $1.17 | 25d | 1 | 0.79mi |
| 601 E Pete Rose Way Cincinnati, OH | 3.0 | 1.0–2.5 | 1039 | $2,471 | $2.38 | 0d | 30 | 1.06mi |
| 621 E Mehring Way Cincinnati, OH | 1.0–2.0 | 1.0–2.0 | 1082 | $2,674 | $2.47 | 0d | 19 | 1.11mi |
| 236 Ward Ave Bellevue, KY | 3.0 | 2.0 | 1500 | $2,585 | $1.72 | 14d | 1 | 1.12mi |
| 103 E 3rd St Covington, KY | 2.0 | 2.0–2.5 | 1148 | $3,035 | $2.64 | 0d | 2 | 1.32mi |
| 1055 St Paul Pl Cincinnati, OH | 3.0 | 1.0–2.0 | 975 | $2,395 | $2.46 | 0d | 10 | 1.38mi |
| 121 E Freedom Way Cincinnati, OH | 2.0 | 1.0–2.0 | 988 | $2,999 | $3.03 | 0d | 29 | 1.40mi |
| 1125 Saint Gregory St #202 Cincinnati, OH | 1.0 | 1.5 | 1290 | $3,000 | $2.33 | 25d | 1 | 1.40mi |
| 3949 Vision CIR Southgate, KY | 1.0–2.0 | 1.0–2.0 | 1132 | $2,515 | $2.22 | 0d | 9 | 1.47mi |
| 50 W Rivercenter Blvd Covington, KY | 2.0 | 1.0–2.5 | 1138 | $3,925 | $3.45 | 0d | 11 | 1.48mi |
| 923 Paradrome St Cincinnati, OH | 3.0 | 2.5 | 2098 | $3,000 | $1.43 | 25d | 1 | 1.50mi |
Listing history 13 events
-
2026-05-04status Pending 597-char remark
-
2026-04-23$274,900 Active 597-char remark
-
2021-12-22soldstatus $229,000
-
2021-12-17soldstatus $229,000 Sold 50-char remark
Show marketing remark (50 chars)
**********Sold When Submitted*********************
-
2021-11-14$229,000 Active 50-char remark
Show marketing remark (50 chars)
**********Sold When Submitted*********************
-
2013-06-06soldstatus $112,000
-
2013-05-30soldstatus $112,000
Show marketing remark (388 chars)
This great home in Newport's East Row Historic District has been improved, updated and thoroughly enjoyed since purchased! Roof, refinished hardwood floors, carpet, HVAC, paint, water heater, washer, dryer, and kitchen. Speaking of kitchen--installed an island, tons of granite counters, and new appliances! This home has charm to spare. Home warranty and all the appliances are included.
-
2013-02-06$114,900
Show marketing remark (388 chars)
This great home in Newport's East Row Historic District has been improved, updated and thoroughly enjoyed since purchased! Roof, refinished hardwood floors, carpet, HVAC, paint, water heater, washer, dryer, and kitchen. Speaking of kitchen--installed an island, tons of granite counters, and new appliances! This home has charm to spare. Home warranty and all the appliances are included.
-
2005-08-10soldstatus $117,500
-
2005-07-28soldstatus $117,500
-
2005-03-22$124,500
-
2003-10-30historical
-
2003-07-02$124,900
ⓘ Source: listings_history table (triggers on properties + properties_extension) + one-shot
backfill from property_details.listing_events for pre-trigger history.
Tax reassessment forecast KY · Resets to sale price
- Current annual tax
- $1,014 · $84/mo
- Projected year-2 tax
- $2,364 · $197/mo
- Expected delta
- +$1,350/yr (+$113/mo · 133.2%)
ⓘ Screening estimate from a state-policy table — verify with the county assessor before closing.
Climate risk First Street
- Flood 1/10 Low FEMA zone X (unshaded) · 0% chance over 30 yrs
- Wildfire 1/10 Low
- Heat 5/10 Major 7 d/yr ≥103°F today · 19 d/yr by 30 yrs out
- Wind 2/10 Low 100% chance of damaging wind over 30 yrs
- Air quality 3/10 Moderate 2 unhealthy d/yr today · 3 by 30 yrs out
Nearby sold comps map
Loading sold comps map…
Walkable amenities ~0.75 mi
Loading nearby amenities…
Taxation est. · year 1
- Rental income
- $23,210
- − Mortgage interest
- −$15,399
- − Property taxes
- −$1,014
- − Insurance
- −$1,374
- − Repairs & maintenance
- −$1,857
- − Management
- −$1,857
- − Depreciation
- −$7,997
- Taxable loss
- −$6,288
- Est. tax savings @ 24.0%
- +$1,509
- After-tax cash flow
- $157/yr
For passive investors: Depreciation is non-cash, so a rental often shows a tax loss while cash-flowing — sheltering income. Rental losses are passive: they offset passive income freely, and up to $25,000/yr can offset ordinary (W-2) income if you actively participate and your MAGI is under $100k (phasing out to $0 by $150k); unused losses carry forward. On sale, claimed depreciation is recaptured at up to 25%, and gains may owe capital-gains tax (a 1031 exchange can defer both). Figures are a year-1 estimate at your 24.0% rate — not tax advice; consult a CPA.
Schools (NCES district)
- District
- Newport Independent
- NCES district ID
- 2104440
- Math proficiency
- 14% ▼ -11.00%
- Reading proficiency
- 26% ▼ -6.00%
- Median HH income
- $35,783
- Composite
- 16.51/100
- National rank
- #9182
- State rank
- #160 of 165 in KY
Livability — Newport
- Score
- 82/100
- State rank
- #58
- US rank
- #1070
Category grades
Schools grade is shown separately in the Schools card above.
Census & demographics
- Census place
- Newport, KY
- County
- Campbell County · 84,793 people
- City population
- 19,680
- Metro
- Cincinnati, OH-KY-IN
- Population (ZIP)
- 19,680
- Household income
- $59,976
- Rent vs Own
- Severe rent burden
- 1136.0
Population outlook (Campbell County) Hauer SSP2
- Today (2025)
- 95,668 people
- By 2030
- 96,886 · +1.3%
- By 2040
- 97,734 · +2.2%
- By 2050
- 96,413 · +0.8%
- By 2075
- 90,211 · -5.7%
- By 2100
- 79,434 · -17.0%
Race, ethnicity, and origin ACS 2023
- Neighborhood character
- Predominantly White (84%)
- Race & ethnicity
- White 84% Black 7% Two or more races 6% Hispanic / Latino 5%
- Common ancestry
- Slovak 3% Lithuanian 2% Italian 2%
- Foreign-born
- 4% · Canada
- Languages at home
- 95% English-only · Spanish 3% Other Indo-European 1%
Political lean MEDSL · Campbell
- 2024 margin
- R (+19.7) · D 39.2% · R 58.9% · Other 1.9%
- 2008→2024 swing
- +1.2pp toward D · 2008: -20.9pp · 2024: -19.7pp
- All cycles
- 2024: R+19.7 2020: R+18.6 2016: R+24.5 2012: R+22.8 2008: R+20.9
Not yet ingested
- Civics
- —
Market trends
- HPI YoY
- ▼ -193.38%
- Current HPI
- 244.9069
- Rent YoY
- ▲ 4.64%
- Metro
- Cincinnati, OH-KY-IN
- State GDP YoY
- ▲ 1.81%
- F500 in state
- 4
Industry mix (Fortune 500 HQ in KY)
| Industry | F500 HQs | Revenue |
|---|---|---|
| Healthcare | 1 | $118B |
|
||
| Food / Beverage | 1 | $7B |
|
||
Price history
+124.2% since first listed15 events — show timeline
- 2026-06-02 Sold (Public Records) $280,000 Public Records
- 2026-05-29 Sold (MLS) $280,000 NKMLS
- 2026-05-04 Pending — NKMLS
- 2026-04-23 Listed $274,900 NKMLS
- 2021-12-22 Sold (Public Records) $229,000 Public Records
- 2021-12-17 Sold (MLS) $229,000 NKMLS
- 2021-11-14 Listed $229,000 NKMLS
- 2013-06-06 Sold (Public Records) $112,000 Public Records
- 2013-05-30 Sold (MLS) $112,000 NKMLS
- 2013-02-06 Listed $114,900 NKMLS
- 2005-08-10 Sold (Public Records) $117,500 Public Records
- 2005-07-28 Sold (MLS) $117,500 NKMLS
- 2005-03-22 Listed $124,500 NKMLS
- 2003-10-30 Listing Removed — NKMLS
- 2003-07-02 Listed $124,900 NKMLS
Property tax history
+6.8%/yrLatest (2025): $1,014 · -3.9% YoY. Source: county tax records.
Cash-flow waterfall
monthlySold comps — $/sqft
last 12 mo · ≤1 miLoading sold comps…