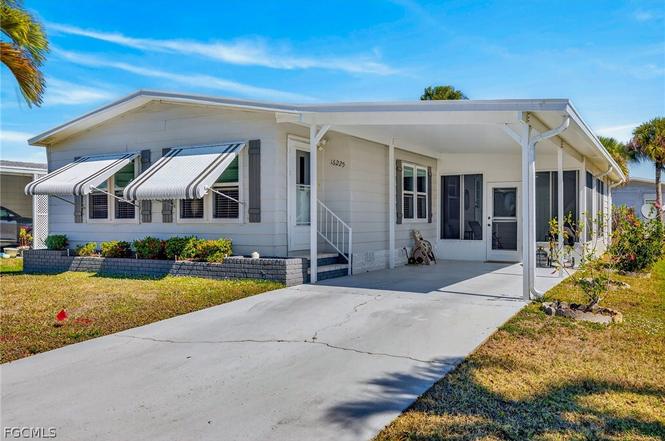
16225 Asheboro Ct · Iona, FL
Flood risk 9/10 · Severe
- FEMA flood zone
- AE
- Chance of flooding over 30 yrs
- 0.99%
- Est. flood insurance / yr
- $1,737 – $8,500
Fire risk 3/10 · Minor
- Est. fire insurance / yr
- $947 – $1,759
Heat risk 10/10 · Severe
- Hot days now (above 107°F)
- 7 days/yr
- Hot days in 30 yrs
- 28 days/yr
Wind risk 10/10 · Severe
- Chance of severe wind over 30 yrs
- 99.0%
Air-quality risk 2/10 · Minimal
- Unhealthy air days now
- 1 days/yr
- Unhealthy air days in 30 yrs
- 1 days/yr
Risk factors via First Street. Map © Google.
Why this score? — see what drove the C+ grade
The composite is a weighted blend of 9 inputs, each scored 0–100. Each bar is that input's sub-score; the figure is the points it added to the 100-point composite (weight × sub-score).
- Cash flow +25.3/30.0
- DSCR +8.3/10.0
- 1% rule +7.7/10.0
- ARV discount +7.3/15.0
- Schools +4.1/10.0
- Livability +3.6/5.0
- Condition / age +2.5/5.0
- Rent growth +2.2/5.0
- Appreciation +0.0/10.0
$165,000
🖨 Deal sheet 📄 Offer letter ✓ Due diligence
Listing remarks MLS
WOW!!!! THE SELLER HAS PRICED THIS TO SELL NOW!!!Great home in desirable 55+ lee Plantation! This community is close to the beaches, shopping and dining. Lee Plantation is a lifestyle community that will fill your days and nights with fun. The clubhouse features a full social calendar. The social committee has everything from cards, day trips, potlucks and dances. Lee Plantation also has a community pool, tennis, shuffleboard, and so much more. This home is a 2 bedroom and 2 bathroom with a Florida room. The kitchen has newer appliances and an open feel to it. The bedrooms are a nice size and the furniture is available for sale. Outside, a shed provides storage that is protected. You won't need a lawn mower because your HOA does that for you leaving more free time to play! Call for for your showing today.
Key facts
- Resort style pool
- Outdoor hot tub
- Tennis courts
Tags
Property features AI
Finance
- Other: Community pool
- Financial info: Pet policy may be conditional — typically 1 pet up to 25 lbs
- HOA & community: Homeowners association with quarterly fee ($525); Association covers management, grounds maintenance, recreation facilities, road maintenance, and street lights; Community amenities include clubhouse, fitness center, library, pool, spa/hot tub, and tennis courts; Community has approximately 150 units; Senior community
Exterior
- Parking: Attached carport (1 covered space); Has carport (1 space)
- Security: Gated community
- Utilities: Public water; Public sewer; Cable available; Municipal irrigation
- Home design: Single-story; Entry level: 1; Faces west; Exposure: East
- Construction: Metal roof; Aluminum siding; Modular/prefab construction; Rectangular lot; Paved road
- Exterior features: Screened lanai/porch; Porch; Storage; Workshop
Interior
- Kitchen: Refrigerator; Range; Microwave; Dishwasher
- Bedrooms: Master bedroom; Additional bedroom (12 x 11)
- Flooring: Carpet; Laminate
- Bathrooms: 2 full bathrooms; Separate shower
- Heating & cooling: Central air; Ceiling fans; Electric cooling
- Interior features: Furnished; Dual sinks in bathroom; Living and dining room area; Separate shower (shower only); Window treatments; Single-hung windows
- Laundry & utility: Washer; Dryer; Laundry located inside (utility room)
Neighborhood map
What this means for you Summary
Snapshot
- This is a 2-bed/2.0-bath manufactured listed at $165k.
Deal economics
- At list price, monthly cash flow is $-53 ($-637/yr) — negative.
- To cash-flow at today's rent, offer at most $156k (5.7% below list).
- Meets the 1% rule at list price ($2k rent vs $165k).
- Recommended offer: $150k (9.0% below list) — sets the bar for market timing.
- Cap rate 9.0% vs local median 2.1% in Iona — top-decile yield for the area; either an underpriced asset or a hidden risk that comps aren't pricing in. Stress-test before assuming the spread holds.
Location & tenants
- Location reads 72/100 on livability (#359 in FL) — a middle-class / working-renter tenant base. Strengths: crime A+, housing A, health & safety A; Watch: schools D-, amenities F, commute F.
- Lee (suburban): math 47% / reading 50% proficiency, ranked #42 of 73 in FL (top 58%) — families likely to look elsewhere, expect single-tenant / working-renter base with shorter leases.
- Market conditions: Rents soft (-1.2%/yr); 1244 active listings in the ZIP; 40 comparable units currently listed for rent nearby; rentals at typical pace (median 21d on market — plan ~3-4 weeks tenant-placement turnaround); solid renter incomes; 15,411 units permitted in Lee County in 2024 (4,686 in 5+ unit buildings).
- This rent runs 33% of the median local income ($75k/yr) — at the standard rent-burdened threshold; future hikes will face affordability resistance.
Forward outlook
- Local home prices are declining (-3.0%/yr); year-one equity from $1k of loan paydown is wiped out by about $5k of value loss. Plan a longer hold.
- Lee County population projected at +44% by 2050 — long-run rental-demand tailwind backs the buy-and-hold thesis.
Negotiation context
- It's been on market 97 days — a 9% lower offer ($150k) is reasonable based on typical stale-listing flexibility.
- 2 sale attempts; this cycle's ask has dropped $55k (25%) from the opening price — seller is motivated, your offer sets the floor, not the list.
Risks & watch-outs
- Watch-outs: flood insurance adds $427/mo.
- Climate carrying-cost: in FEMA flood zone AE (mandatory federal flood insurance); severe wind risk, 99% chance of damaging wind over 30y; extreme-heat days projected 7→28/yr by 2055 (HVAC capex compounding) — expect insurance premiums to compound above CPI over the hold.
Questions for the listing agent
- What do current leases actually rent for vs. the listed asking? Can we see a recent rent roll and the last 12 months of T-12 income?
- It's been on market 97 days. Have you received any prior offers? Is the seller open to a 9% concession, seller financing, or rate buy-down credit?
- What's the actual annual flood-insurance premium (NFIP or private), and is the property in a SFHA with mandatory coverage?
- What does the HOA fee cover, when was the last increase, and are there any pending special assessments or reserve-fund shortfalls?
- Why hasn't it sold? Are there any deal-killer items the seller is aware of (foundation, flood, title, zoning, code violations)?
- Is there a deadline driving the sale (1031 exchange, divorce, estate, relocation)? That informs how much negotiation room exists.
- Schools are D-rated, which usually means shorter tenancies and higher turnover. Who's the typical renter profile here, and what's been the actual vacancy rate?
- What's the average days-on-market for RENTAL listings here right now (not sales)? A rising rental-DOM trend means longer vacancies and softer asking-rent achievability than the comps imply.
- What's the recent tenant-quality profile in this submarket — average credit score on applications, eviction rate, late-payment / NSF rate, and stable-employment percentage? A property-management company in the area should have these aggregated.
- How much new for-sale + rental construction is in the pipeline within 1–3 miles? Heavy new supply typically softens prices + rents 12–24 months out; constrained supply supports both.
Investment metrics
- 1% rule
- 1.27% ✓
- Cap rate
- 9.01%
- Cash-on-cash
- 9.70%
- DSCR
- 1.43
- GRM
- 6.6
CMA / ARV
- ARV (on-the-fly)
- $164,268
- Comps found
- 5
Show comp detail 5 sales within ~0.75 mi
| Address | Dist | Beds/Ba | Sqft | Sold | Price | $/sf | Match |
|---|---|---|---|---|---|---|---|
| 10503 Winchester Ct | 0.08mi | 2/2.0 | 1,069 (+5%) | 1mo | $169,500 | $159 | 87 |
| 287 Dillard Ave | 0.41mi | 2/2.0 | 921 (-9%) | 2mo | $190,000 | $206 | 64 |
| 318 Rosa Lee Ave | 0.43mi | 2/2.0 | 1,080 (+6%) | 7mo | $239,500 | $222 | 63 |
| 16070 Siesta Dr | 0.67mi | 2/2.0 | 950 (-6%) | 18mo | $154,000 | $162 | 43 |
| 42 Ronald Dr NE | 0.58mi | 2/1.0 | 872 (-14%) | 12mo | $90,000 | $103 | 35 |
Match score weights: distance 35% · size 25% · config 20% · recency 20%. Top-matched comps best support the ARV.
Projected returns pro-forma
-3.0% appreciation · 0.0% rent growth · sell at horizon
- IRR
- -23.6%
- Equity multiple
- 0.22×
- Total profit
- $-35,864
- Equity at exit
- $24,602
- IRR
- -40.4%
- Equity multiple
- -0.25×
- Total profit
- $-57,723
- Equity at exit
- $14,266
Cash invested: $46,200 (down + closing). Projections, not guarantees.
Landlord ↔ Tenant lean methodology
- Overall (STATE)
- 87 Strongly Landlord-Friendly
- State Florida
- 87 Strongly Landlord-Friendly · R+3
- County
- — inherits STATE
- City
- — inherits STATE
ZIP-level market 33908
- Home prices YoY
- -32.8%
- Rents YoY
- -1.2%
- Active inventory
- 1244
- Price-to-rent
- 6.6×
Monthly cashflow live
- Estimated rent
- $2,091 high interval (Pro) →
- Mortgage (P&I)
- −$865
- Tax from tax record
- −$169 /mo · $2,030/yr
- Insurance
- −$69
- Flood insurance flood zone
- −$427 /mo · $5,118/yr
- HOA
- −$175
- Vacancy / Maint / Mgmt
- −$439
- Net cashflow
- $-53
Break-even live
UW: 25.0% down · 7.5% · 30yr · 1.5% tax · 5.0% vac · 8.0% maint · 8.0% mgmt
Financing live
Cash to close
- Down payment
- $41,250
- Closing costs
- $4,950
- Reserves months
- —
- Total cash needed
- —
Loan-product check · same deal, 3 products live
Conventional
25% down · 7.5% · 30yr
- Down + closing
- —
- Monthly P&I
- —
- Monthly cashflow
- —
- DSCR
- —
- Eligible?
- —
Personal DTI + credit; lowest rate.
DSCR
20% down · 8.5% · 30yr
- Down + closing
- —
- Monthly P&I
- —
- Monthly cashflow
- —
- DSCR
- —
- Eligible?
- —
No personal income docs; deal must DSCR.
Hard money
10% down · 12.0% · 12mo
- Down + closing
- —
- Monthly P&I
- —
- Monthly cashflow
- —
- DSCR
- —
- Eligible?
- —
Short-term bridge; refi at stabilization.
Rent comps 40 comps
| Address | Beds | Baths | Sqft | Rent | $/sqft | DOM | Units | Dist |
|---|---|---|---|---|---|---|---|---|
| 16645 Lake Circle Dr #732 Fort Myers, FL | 2.0 | 2.0 | 1154 | $4,000 | $3.47 | 23d | 1 | 0.26mi |
| 16635 Lake Circle Dr Fort Myers, FL | 2.0 | 2.0 | 1277 | $2,150 | $1.68 | 15d | 2 | 0.29mi |
| 16685 Lake Circle Dr Fort Myers, FL | 2.0 | 2.0 | 1228 | $2,000 | $1.63 | 23d | 2 | 0.32mi |
| 16625 Lake Circle Dr #523 Fort Myers, FL | 2.0 | 2.0 | 1154 | $2,100 | $1.82 | 23d | 1 | 0.34mi |
| 11021 Gulf Reflections Dr Fort Myers, FL | 2.0–3.0 | 2.0 | 1674 | $2,600 | $1.55 | 23d | 2 | 0.41mi |
| 11021 Gulf Reflections Dr #303 Fort Myers, FL | 2.0 | 2.0 | 1500 | $4,200 | $2.80 | 3d | 1 | 0.41mi |
| 11041 Gulf Reflections Dr #305 Fort Myers, FL | 2.0 | 2.0 | 1500 | $1,800 | $1.20 | 23d | 1 | 0.45mi |
| 11093 Kelly Rd Fort Myers, FL | 2.0 | 1.0 | 830 | $2,000 | $2.41 | 21d | 1 | 0.49mi |
| 11262 Summerwinds Ct Fort Myers, FL | 2.0 | 1.0 | 1049 | $1,699 | $1.62 | 21d | 1 | 0.58mi |
| 11298 Summerwinds Ct Fort Myers, FL | 2.0 | 1.0 | 861 | $1,599 | $1.86 | 21d | 1 | 0.62mi |
| 11389 Summerwinds Ct Fort Myers, FL | 2.0 | 1.0 | 927 | $1,599 | $1.72 | 21d | 1 | 0.69mi |
| 11460 Summerwinds Ct Fort Myers, FL | 2.0 | 1.0 | 912 | $1,699 | $1.86 | 21d | 1 | 0.74mi |
| 16841 Juanita Ave Unit B Fort Myers, FL | 2.0 | 1.0 | 840 | $1,845 | $2.20 | 23d | 1 | 0.77mi |
| 16901 Juanita Ave Fort Myers, FL | 2.0 | 1.0 | 780 | $1,500 | $1.92 | 23d | 1 | 0.81mi |
| 15773 Beachcomber Ave Unit 1264830P Fort Myers, FL | 3.0 | 2.0 | 1496 | $3,133 | $2.09 | 13d | 1 | 0.83mi |
| 15449 Bellamar Cir #1225 Fort Myers, FL | 3.0 | 2.0 | 1043 | $1,700 | $1.63 | 13d | 1 | 0.85mi |
| 11430 Kimble Dr Unit 11432 front Fort Myers, FL | 2.0 | 1.0 | 700 | $1,300 | $1.86 | 3d | 1 | 0.86mi |
| 11430 Kimble Dr Unit 11430 front Fort Myers, FL | 2.0 | 1.0 | 700 | $1,295 | $1.85 | 3d | 1 | 0.86mi |
| 15655 Ocean Walk Cir Fort Myers, FL | 1.0–2.0 | 1.0–2.0 | 856 | $3,200 | $3.74 | 14d | 2 | 0.90mi |
| 15433 Bellamar Cir Fort Myers, FL | 3.0 | 2.0 | 1021 | $2,575 | $2.52 | 23d | 2 | 0.90mi |
| 15645 Ocean Walk Cir Fort Myers, FL | 3.0 | 2.0 | 1287 | $3,699 | $2.87 | 2d | 2 | 0.91mi |
| 15645 Ocean Walk Cir Fort Myers, FL | 3.0 | 2.0 | 1227 | $2,774 | $2.26 | 3d | 3 | 0.91mi |
| 11451 Char Ann Dr Fort Myers, FL | 2.0 | 1.0 | 1300 | $1,950 | $1.50 | 1d | 1 | 0.91mi |
| 10743 Robinson St Fort Myers, FL | 3.0 | 2.0 | 1216 | $2,000 | $1.64 | 23d | 1 | 0.91mi |
| 15430 Bellamar Cir Fort Myers, FL | 3.0 | 2.0 | 1043 | $2,400 | $2.30 | 15d | 2 | 0.92mi |
| 11470 Char Ann Dr Fort Myers, FL | 2.0 | 1.0 | 834 | $1,200 | $1.44 | 3d | 1 | 0.92mi |
| 15430 Bellamar Cir #3023 Fort Myers, FL | 3.0 | 2.0 | 1043 | $3,500 | $3.36 | 3d | 1 | 0.92mi |
| 15430 Bellamar Cir Unit 1546283P Fort Myers, FL | 3.0 | 2.0 | 1033 | $1,873 | $1.81 | 14d | 1 | 0.92mi |
| 16890 Carmen Ave Unit 16902 Fort Myers, FL | 2.0 | 1.0 | 800 | $1,295 | $1.62 | 3d | 1 | 0.93mi |
| 15585 Ocean Walk Cir #302 Fort Myers, FL | 1.0 | 1.0 | 828 | $1,700 | $2.05 | 23d | 1 | 0.94mi |
| 16910 Carmen Ave #16922 Fort Myers, FL | 2.0 | 1.0 | 780 | $1,400 | $1.79 | 23d | 1 | 0.94mi |
| 16920 Carmen Ave Fort Myers, FL | 2.0 | 1.0 | 800 | $1,300 | $1.62 | 23d | 1 | 0.95mi |
| 15417 Bellamar Cir #823 Fort Myers, FL | 3.0 | 2.0 | 1043 | $1,650 | $1.58 | 21d | 1 | 0.97mi |
| 15417 Bellamar Cir #823 Fort Myers, FL | 3.0 | 2.0 | 1043 | $1,650 | $1.58 | 23d | 1 | 0.97mi |
| 11400 Ocean Walk Ln Fort Myers, FL | 1.0–2.0 | 1.0–2.0 | 856 | $1,500 | $1.75 | 3d | 2 | 0.97mi |
| 16580 Ginger Ln #3242 Fort Myers, FL | 2.0 | 2.0 | 982 | $1,800 | $1.83 | 23d | 1 | 0.98mi |
| 16214 Via Solera Cir #5 Fort Myers, FL | 2.0 | 2.5 | 1300 | $1,750 | $1.35 | 23d | 1 | 0.98mi |
| 15401 Bellamar Cir #621 Fort Myers, FL | 3.0 | 2.0 | 1040 | $1,700 | $1.63 | 11d | 1 | 1.01mi |
| 15625 Ocean Walk Cir #103 Fort Myers, FL | 2.0 | 2.0 | 1287 | $1,450 | $1.13 | 21d | 1 | 1.01mi |
| 15385 Bellamar Cir #413 Fort Myers, FL | 3.0 | 2.0 | 1043 | $1,600 | $1.53 | 23d | 1 | 1.01mi |
HOA detail
- Monthly dues
- $175 · $2,100/yr
- Likely covers
- pool
Listing history 13 events
-
2026-05-25status Pending
-
2026-03-26price $165,000
-
2026-03-24price $169,000
-
2026-02-17$219,900 Active
-
2026-02-01historical
-
2025-03-09price $249,000
-
2025-02-01$265,000 Active
-
2021-05-12soldstatus $169,000
-
2013-03-28soldstatus $77,000
-
2013-03-20soldstatus $77,000 816-char remark
Show marketing remark (816 chars)
WOW!!!! THE SELLER HAS PRICED THIS TO SELL NOW!!!Great home in desirable 55+ lee Plantation! This community is close to the beaches, shopping and dining. Lee Plantation is a lifestyle community that will fill your days and nights with fun. The clubhouse features a full social calendar. The social committee has everything from cards, day trips, potlucks and dances. Lee Plantation also has a community pool, tennis, shuffleboard, and so much more. This home is a 2 bedroom and 2 bathroom with a Florida room. The kitchen has newer appliances and an open feel to it. The bedrooms are a nice size and the furniture is available for sale. Outside, a shed provides storage that is protected. You won't need a lawn mower because your HOA does that for you leaving more free time to play! Call for for your showing today.
-
2013-02-21price $79,900 816-char remark
Show marketing remark (816 chars)
WOW!!!! THE SELLER HAS PRICED THIS TO SELL NOW!!!Great home in desirable 55+ lee Plantation! This community is close to the beaches, shopping and dining. Lee Plantation is a lifestyle community that will fill your days and nights with fun. The clubhouse features a full social calendar. The social committee has everything from cards, day trips, potlucks and dances. Lee Plantation also has a community pool, tennis, shuffleboard, and so much more. This home is a 2 bedroom and 2 bathroom with a Florida room. The kitchen has newer appliances and an open feel to it. The bedrooms are a nice size and the furniture is available for sale. Outside, a shed provides storage that is protected. You won't need a lawn mower because your HOA does that for you leaving more free time to play! Call for for your showing today.
-
2006-10-31soldstatus $145,000
-
1993-03-19soldstatus $65,000
ⓘ Source: listings_history table (triggers on properties + properties_extension) + one-shot
backfill from property_details.listing_events for pre-trigger history.
Tax reassessment forecast FL · Resets to sale price
- Current annual tax
- $2,030 · $169/mo
- Projected year-2 tax
- $2,031 · $169/mo
- Expected delta
- $0/yr ($0/mo · 0.0%)
ⓘ Screening estimate from a state-policy table — verify with the county assessor before closing.
Climate risk First Street
- Flood 9/10 Extreme FEMA zone AE · 99% chance over 30 yrs
- Wildfire 3/10 Moderate
- Heat 10/10 Extreme 7 d/yr ≥107°F today · 28 d/yr by 30 yrs out
- Wind 10/10 Extreme 99% chance of damaging wind over 30 yrs
- Air quality 2/10 Low 1 unhealthy d/yr today · 1 by 30 yrs out
Nearby sold comps map
Loading sold comps map…
Walkable amenities ~0.75 mi
Loading nearby amenities…
Taxation est. · year 1
- Rental income
- $25,090
- − Mortgage interest
- −$9,243
- − Property taxes
- −$2,030
- − Insurance
- −$5,944
- − Repairs & maintenance
- −$2,007
- − Management
- −$2,007
- − HOA
- −$2,100
- − Depreciation
- −$4,800
- Taxable loss
- −$3,041
- Est. tax savings @ 24.0%
- +$730
- After-tax cash flow
- $93/yr
For passive investors: Depreciation is non-cash, so a rental often shows a tax loss while cash-flowing — sheltering income. Rental losses are passive: they offset passive income freely, and up to $25,000/yr can offset ordinary (W-2) income if you actively participate and your MAGI is under $100k (phasing out to $0 by $150k); unused losses carry forward. On sale, claimed depreciation is recaptured at up to 25%, and gains may owe capital-gains tax (a 1031 exchange can defer both). Figures are a year-1 estimate at your 24.0% rate — not tax advice; consult a CPA.
Schools (NCES district)
- District
- Lee
- NCES district ID
- 1201080
- Math proficiency
- 47% ▼ -11.00%
- Reading proficiency
- 50% ▼ -4.00%
- Median HH income
- $49,518
- Composite
- 41.49/100
- National rank
- #3458
- State rank
- #42 of 73 in FL
Livability — Iona
- Score
- 72/100
- State rank
- #359
- US rank
- #6253
Category grades
Schools grade is shown separately in the Schools card above.
Census & demographics
- County
- Lee County · 788,662 people
- Metro
- Cape Coral-Fort Myers, FL
- Population (ZIP)
- 37,423
- Household income
- $75,396
- Rent vs Own
- Severe rent burden
- 1944.0
Population outlook (Lee County) Hauer SSP2
- Today (2025)
- 871,946 people
- By 2030
- 955,468 · +9.6%
- By 2040
- 1,113,587 · +27.7%
- By 2050
- 1,256,891 · +44.1%
- By 2075
- 1,560,270 · +78.9%
- By 2100
- 1,726,848 · +98.0%
Race, ethnicity, and origin ACS 2023
- Neighborhood character
- Predominantly White (88%)
- Race & ethnicity
- White 88% Hispanic / Latino 6% Two or more races 5% Black 3% Asian 1%
- Hispanic origin (detail)
- Mexican 1% Puerto Rican 2%
- Common ancestry
- Romanian 5% Lithuanian 4% Slovak 3%
- Foreign-born
- 10% · Canada, Jamaica
- Languages at home
- 90% English-only · Spanish 4% Russian/Polish/Slavic 1% Other Indo-European 1%
Political lean MEDSL · Lee
- 2024 margin
- Strong R (+28.4) · D 35.5% · R 63.9%
- 2008→2024 swing
- -18.0pp toward R · 2008: -10.4pp · 2024: -28.4pp
- All cycles
- 2024: R+28.4 2020: R+19.2 2016: R+20.4 2012: R+16.6 2008: R+10.4
Not yet ingested
- Civics
- —
Market trends
- HPI YoY
- ▼ -102.22%
- Current HPI
- 209.7595
- Rent YoY
- ▼ -1.18%
- Metro
- Cape Coral-Fort Myers, FL
- State GDP YoY
- ▲ 3.28%
- F500 in state
- 36
Industry mix (Fortune 500 HQ in FL)
| Industry | F500 HQs | Revenue |
|---|---|---|
| Industrial Technology | 2 | $29B |
|
||
| Insurance | 2 | $17B |
|
||
| Retail | 1 | $60B |
|
||
| Technology Distribution | 1 | $58B |
|
||
| Homebuilding | 1 | $35B |
|
||
| Technology Manufacturing | 1 | $35B |
|
||
Price history
+153.8% since first listed13 events — show timeline
- 2026-05-25 Pending — FORTMLS
- 2026-03-26 Price Changed $165,000 FORTMLS
- 2026-03-24 Price Changed $169,000 FORTMLS
- 2026-02-17 Listed $219,900 FORTMLS
- 2026-02-01 Listing Removed — FORTMLS
- 2025-03-09 Price Changed $249,000 FORTMLS
- 2025-02-01 Listed $265,000 FORTMLS
- 2021-05-12 Sold (Public Records) $169,000 Public Records
- 2013-03-28 Sold (Public Records) $77,000 Public Records
- 2013-03-20 Sold (MLS) $77,000 FORTMLS
- 2013-02-21 Price Changed $79,900 FORTMLS
- 2006-10-31 Sold (Public Records) $145,000 Public Records
- 1993-03-19 Sold (Public Records) $65,000 Public Records
Property tax history
+2.8%/yrLatest (2025): $2,030 · -12.8% YoY. Source: county tax records.
Cash-flow waterfall
monthlySold comps — $/sqft
last 12 mo · ≤1 miLoading sold comps…