59 Charmingdale Dr Unit 74 charmingdale, 3309 Polk,3401 Polk,3107 Jackson · Richwood, LA
Flood risk 1/10 · Minimal
- FEMA flood zone
- X (shaded)
- Chance of flooding over 30 yrs
- 0.0%
- Est. flood insurance / yr
- $507 – $1,088
Fire risk 3/10 · Minor
- Est. fire insurance / yr
- $1,269 – $2,357
Heat risk 7/10 · Major
- Hot days now (above 112°F)
- 7 days/yr
- Hot days in 30 yrs
- 20 days/yr
Wind risk 7/10 · Major
- Chance of severe wind over 30 yrs
- 78.0%
Air-quality risk 1/10 · Minimal
- Unhealthy air days now
- 0 days/yr
- Unhealthy air days in 30 yrs
- 0 days/yr
Risk factors via First Street. Map © Google.
Why this score? — see what drove the F grade
The composite is a weighted blend of 9 inputs, each scored 0–100. Each bar is that input's sub-score; the figure is the points it added to the 100-point composite (weight × sub-score).
- ARV discount +7.5/15.0
- Schools +3.2/10.0
- Livability +2.9/5.0
- Rent growth +2.5/5.0
- Condition / age +2.2/5.0
- Cash flow +1.2/30.0
- 1% rule +0.0/10.0
- DSCR +0.0/10.0
- Appreciation +0.0/10.0
$199,000
🖨 Deal sheet (PDF) 📄 Offer letter ✓ Due diligence
Listing remarks MLS
Great Deal For Investors!!! 5 properties. Income producing. 59 Charmingdale-74 Charmingdale-3309 Polk-3401 Polk-3107 Jackson. All measurements are approximate. Properties to be sold "as-is/where-is". For all showings, contact Julie Hansen 318-355-7301. Please do not disturb the tenants. Fully occupied monthly income of $2940.
Key facts
- Listed 465 days
Neighborhood map
What this means for you Summary
Snapshot
- This is a condo listed at $199k. Condition is rated fair.
Deal economics
- At list price, monthly cash flow is $-802 ($-10k/yr) — negative.
- To cash-flow at today's rent, offer at most $83k (58.4% below list).
- To meet the 1% rule (rent ≥ 1% of price), the offer needs to be $72k (63.6% below list).
- Recommended offer: $72k (63.6% below list) — sets the bar for 1% rule.
Location & tenants
- Location reads 58/100 on livability (#303 in LA) — a working-class tenant base; expect higher turnover. Strengths: cost of living A+, housing A+; Watch: health & safety D, schools F, crime F.
- Ouachita Parish (suburban): math 31% / reading 45% proficiency, ranked #26 of 98 in LA (top 26%) — families likely to look elsewhere, expect single-tenant / working-renter base with shorter leases.
- Market conditions: 69 active listings in the ZIP; 1 comparable units currently listed for rent nearby; 345 units permitted in Ouachita Parish in 2024 (0 in 5+ unit buildings).
Forward outlook
- Local home prices are declining (-3.0%/yr); year-one equity from $1k of loan paydown is wiped out by about $6k of value loss. Plan a longer hold.
Negotiation context
- It's been on market 466 days — a 12% lower offer ($175k) is reasonable based on typical stale-listing flexibility.
Risks & watch-outs
- Climate carrying-cost: major wind risk, 78% chance of damaging wind over 30y; extreme-heat days projected 7→20/yr by 2055 (HVAC capex compounding) — expect insurance premiums to compound above CPI over the hold.
Questions for the listing agent
- What do current leases actually rent for vs. the listed asking? Can we see a recent rent roll and the last 12 months of T-12 income?
- It's been on market 466 days. Have you received any prior offers? Is the seller open to a 64% concession, seller financing, or rate buy-down credit?
- Have any recent inspections been done? Can we get a copy of the seller's disclosures and any deferred-maintenance estimates?
- Any open or pending special assessments — roof, HVAC, plumbing, elevator, façade? What's the per-unit balance and payoff schedule, and is the seller paying it off at close or rolling it to the buyer?
- Why hasn't it sold? Are there any deal-killer items the seller is aware of (foundation, flood, title, zoning, code violations)?
- Is there a deadline driving the sale (1031 exchange, divorce, estate, relocation)? That informs how much negotiation room exists.
- Schools are F-rated, which usually means shorter tenancies and higher turnover. Who's the typical renter profile here, and what's been the actual vacancy rate?
- Crime grade is F in this area — have there been break-ins, vandalism, or insurance claims at this property in the last 3 years? What carrier currently insures it and at what premium?
- The area grade is low — what's the realistic commute time and amenity access for the typical tenant pool here? Any planned neighborhood developments (good or bad) we should know about?
- What's the average days-on-market for RENTAL listings here right now (not sales)? A rising rental-DOM trend means longer vacancies and softer asking-rent achievability than the comps imply.
- What's the recent tenant-quality profile in this submarket — average credit score on applications, eviction rate, late-payment / NSF rate, and stable-employment percentage? A property-management company in the area should have these aggregated.
- How much new apartment / multifamily construction is in the pipeline within 1–3 miles? Heavy new supply (>2% of stock underway) typically softens rents 12–24 months out; light construction supports rent growth.
Investment metrics
- 1% rule
- 0.36% ✗
- Cap rate
- 1.45%
- Cash-on-cash
- -17.28%
- DSCR
- 0.23
- GRM
- 22.9
CMA / ARV
No comps found within radius.
Projected returns pro-forma
-3.0% appreciation · 3.0% rent growth · sell at horizon
- IRR
- -50.6%
- Equity multiple
- -0.50×
- Total profit
- $-83,347
- Equity at exit
- $29,672
- IRR
- —
- Equity multiple
- -1.48×
- Total profit
- $-138,346
- Equity at exit
- $17,206
Cash invested: $55,720 (down + closing). Projections, not guarantees.
Landlord ↔ Tenant lean methodology
- Overall (STATE)
- 90 Strongly Landlord-Friendly
- State Louisiana
- 90 Strongly Landlord-Friendly · R+12
- County
- — inherits STATE
- City
- — inherits STATE
ZIP-level market 71202
- Active inventory
- 69
- Price-to-rent
- 22.9×
Monthly cashflow live
- Estimated rent
- $725 medium interval (Pro) →
- Mortgage (P&I)
- −$1,044
- Tax est. 1.5%
- −$249 /mo · $2,985/yr
- Insurance
- −$83
- HOA
- −$0
- Vacancy / Maint / Mgmt
- −$152
- Net cashflow
- $-802
Break-even live
Sensitivity live
| Price | -10% $-665 | -5% $-734 | +0% $-802 | +5% $-871 | +10% $-940 |
|---|---|---|---|---|---|
| Rent | -10% $-860 | -5% $-831 | +0% $-802 | +5% $-774 | +10% $-745 |
| Rate | -1.0pp $-702 | -0.5pp $-752 | base $-802 | +0.5pp $-854 | +1.0pp $-907 |
UW: 25.0% down · 7.5% · 30yr · 1.5% tax · 5.0% vac · 8.0% maint · 8.0% mgmt
Financing live
Cash to close
- Down payment
- $49,750
- Closing costs
- $5,970
- Reserves months
- —
- Total cash needed
- —
Loan-product check · same deal, 3 products live
Conventional
25% down · 7.5% · 30yr
- Down + closing
- —
- Monthly P&I
- —
- Monthly cashflow
- —
- DSCR
- —
- Eligible?
- —
Personal DTI + credit; lowest rate.
DSCR
20% down · 8.5% · 30yr
- Down + closing
- —
- Monthly P&I
- —
- Monthly cashflow
- —
- DSCR
- —
- Eligible?
- —
No personal income docs; deal must DSCR.
Hard money
10% down · 12.0% · 12mo
- Down + closing
- —
- Monthly P&I
- —
- Monthly cashflow
- —
- DSCR
- —
- Eligible?
- —
Short-term bridge; refi at stabilization.
Rent comps 1 comps
| Address | Beds | Baths | Sqft | Rent | $/sqft | DOM | Units | Dist |
|---|---|---|---|---|---|---|---|---|
| 59 Charmingdale Dr Monroe, LA | 3.0 | 1.0 | — | $725 | — | 21d | 1 | 0.03mi |
HOA detail condo
- Monthly dues
- $0 · $0/yr
- Assessments
- None detected in remarks — confirm with the listing agent.
Listing history 18 events
-
2026-06-19days on market $199,000 Active 466 DOM
-
2026-06-18days on market $199,000 Active 465 DOM
-
2026-06-17days on market $199,000 Active 464 DOM
-
2026-06-16days on market $199,000 Active 463 DOM
-
2026-06-15days on market $199,000 Active 462 DOM
-
2026-06-14days on market $199,000 Active 460 DOM
-
2026-06-13days on market $199,000 Active 459 DOM
-
2026-06-10days on market $199,000 Active 457 DOM
-
2026-06-09days on market $199,000 Active 456 DOM
-
2026-06-08days on market $199,000 Active 455 DOM
-
2026-06-07days on market $199,000 Active 454 DOM
-
2026-06-03days on market $199,000 Active 450 DOM
-
2026-06-02days on market $199,000 Active 449 DOM
-
2026-06-01days on market $199,000 Active 448 DOM
-
2026-05-31days on market $199,000 Active 447 DOM
-
2026-05-30days on market $199,000 Active 446 DOM
-
2025-09-17price $199,000 338-char remark
Show marketing remark (338 chars)
Great Deal For Investors!!! 5 properties. Income producing. 59 Charmingdale-74 Charmingdale-3309 Polk-3401 Polk-3107 Jackson. All measurements are approximate. Properties to be sold "as-is/where-is". For all showings, contact Julie Hansen 318-355-7301. Please do not disturb the tenants. Fully occupied monthly income of $2940.
-
2025-03-08$244,000 Active 338-char remark
Show marketing remark (338 chars)
Great Deal For Investors!!! 5 properties. Income producing. 59 Charmingdale-74 Charmingdale-3309 Polk-3401 Polk-3107 Jackson. All measurements are approximate. Properties to be sold "as-is/where-is". For all showings, contact Julie Hansen 318-355-7301. Please do not disturb the tenants. Fully occupied monthly income of $2940.
ⓘ Source: listings_history table (triggers on properties + properties_extension) + one-shot
backfill from property_details.listing_events for pre-trigger history.
Climate risk First Street
- Flood 1/10 Low FEMA zone X (shaded) · 0% chance over 30 yrs
- Wildfire 3/10 Moderate
- Heat 7/10 Severe 7 d/yr ≥112°F today · 20 d/yr by 30 yrs out
- Wind 7/10 Severe 78% chance of damaging wind over 30 yrs
- Air quality 1/10 Low 0 unhealthy d/yr today · 0 by 30 yrs out
Nearby sold comps map
Loading sold comps map…
Walkable amenities ~0.75 mi
Loading nearby amenities…
Taxation est. · year 1
- Rental income
- $8,700
- − Mortgage interest
- −$11,147
- − Property taxes
- −$2,985
- − Insurance
- −$995
- − Repairs & maintenance
- −$696
- − Management
- −$696
- − Depreciation
- −$5,789
- Taxable loss
- −$13,608
- Est. tax savings @ 24.0%
- +$3,266
- After-tax cash flow
- $-6,364/yr
For passive investors: Depreciation is non-cash, so a rental often shows a tax loss while cash-flowing — sheltering income. Rental losses are passive: they offset passive income freely, and up to $25,000/yr can offset ordinary (W-2) income if you actively participate and your MAGI is under $100k (phasing out to $0 by $150k); unused losses carry forward. On sale, claimed depreciation is recaptured at up to 25%, and gains may owe capital-gains tax (a 1031 exchange can defer both). Figures are a year-1 estimate at your 24.0% rate — not tax advice; consult a CPA.
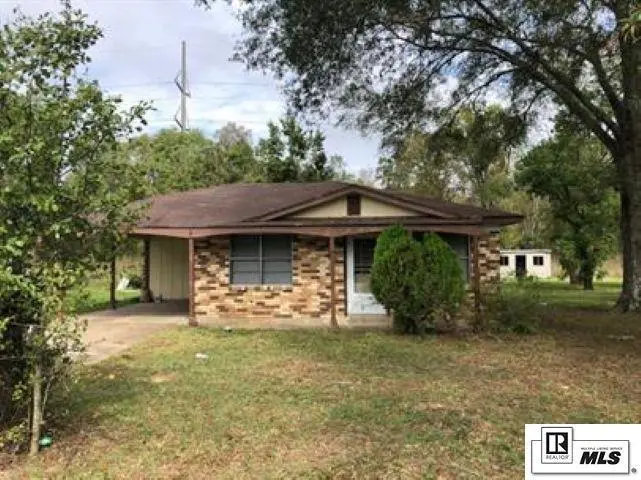
Condition & rehab AI · 4 photos
This multi-family property requires extensive repairs and maintenance, including roof replacement, siding and paint, landscaping, HVAC system, and structural repairs. Significant improvements would be needed to increase its resale and rental value.
Repairs flagged
- Major roof — Signs of wear and discoloration suggest significant damage.
- Major siding — Peeling paint and chipping paint indicate severe wear.
- Major flooring — Visible wear and tear suggest the need for replacement.
- Major interior walls/paint — Wear and tear suggest the need for repainting or replacement.
- Major landscaping — Overgrown and low curb appeal suggest the need for landscaping improvements.
- Major HVAC system — Old and possibly in need of maintenance or replacement.
- Major foundation/structure — Signs of wear and tear suggest the need for structural repairs.
- Major windows — Old and possibly in need of replacement or repair.
Value-add opportunities
- Both roof replacement — A new roof would significantly improve the home's appearance and increase its value.
- Both siding and paint — New siding and repainted walls would improve the home's curb appeal and increase its value.
- Both landscaping — A well-maintained landscape would improve the home's curb appeal and increase its value.
- Both HVAC system — A new HVAC system would improve the home's comfort and increase its value.
- Both foundation and structure repairs — Structural repairs would improve the home's safety and increase its value.
- Both windows — New windows would improve the home's energy efficiency and increase its value.
Renovation cost estimate screening
| Repair item | Severity | Est. cost |
|---|---|---|
| roof · Signs of wear and discoloration suggest significant damage. | Major | $15,000–50,000 |
| siding · Peeling paint and chipping paint indicate severe wear. | Major | $15,000–50,000 |
| flooring · Visible wear and tear suggest the need for replacement. | Major | $15,000–50,000 |
| interior walls/paint · Wear and tear suggest the need for repainting or replacement. | Major | $15,000–50,000 |
| landscaping · Overgrown and low curb appeal suggest the need for landscaping improvements. | Major | $15,000–50,000 |
| HVAC system · Old and possibly in need of maintenance or replacement. | Major | $15,000–50,000 |
| foundation/structure · Signs of wear and tear suggest the need for structural repairs. | Major | $15,000–50,000 |
| windows · Old and possibly in need of replacement or repair. | Major | $15,000–50,000 |
| Total estimated repair cost · 8 items | $120,000–400,000 |
Value-add ROI direction
- Both roof replacement — A new roof would significantly improve the home's appearance and increase its value. ↑
- Both siding and paint — New siding and repainted walls would improve the home's curb appeal and increase its value. ↑
- Both landscaping — A well-maintained landscape would improve the home's curb appeal and increase its value. ↑
- Both HVAC system — A new HVAC system would improve the home's comfort and increase its value. ↑
- Both foundation and structure repairs — Structural repairs would improve the home's safety and increase its value. ↑
- Both windows — New windows would improve the home's energy efficiency and increase its value. ↑
ⓘ Cost ranges are severity-bucket heuristics (US national rule-of-thumb). Get contractor quotes + a written scope before underwriting a rehab budget.
Schools (NCES district)
- District
- Ouachita Parish
- NCES district ID
- 2201200
- Math proficiency
- 31% ▼ -38.00%
- Reading proficiency
- 45% ▼ -31.00%
- Median HH income
- $43,316
- Composite
- 32.14/100
- National rank
- #5791
- State rank
- #26 of 98 in LA
Livability — Richwood
- Score
- 58/100
- State rank
- #303
- US rank
- #21140
Category grades
Schools grade is shown separately in the Schools card above.
Census & demographics
- Population (ZIP)
- 26,791
Population outlook (Ouachita County) Hauer SSP2
- Today (2025)
- 163,370 people
- By 2030
- 165,520 · +1.3%
- By 2040
- 167,652 · +2.6%
- By 2050
- 166,699 · +2.0%
- By 2075
- 156,348 · -4.3%
- By 2100
- 134,102 · -17.9%
Race, ethnicity, and origin ACS 2023
- Neighborhood character
- Predominantly Black (84%)
- Race & ethnicity
- Black 84% White 11% Hispanic / Latino 2% Two or more races 2%
- Common ancestry
- Lithuanian 1%
- Foreign-born
- 1% · Canada
- Languages at home
- 97% English-only · Spanish 2%
Political lean MEDSL · Ouachita
- 2024 margin
- Strong R (+27.9) · D 35.5% · R 63.3% · Other 1.2%
- 2008→2024 swing
- -2.7pp toward R · 2008: -25.2pp · 2024: -27.9pp
- All cycles
- 2024: R+27.9 2020: R+23.6 2016: R+25.4 2012: R+20.9 2008: R+25.2
Not yet ingested
- Civics
- —
Market trends
- HPI YoY
- ▼ -66.58%
- Current HPI
- 82.9973
- Rent YoY
- —
- Metro
- —
- State GDP YoY
- ▲ 3.29%
- F500 in state
- 10
Industry mix (Fortune 500 HQ in LA)
| Industry | F500 HQs | Revenue |
|---|---|---|
| Telecommunications | 2 | $23B |
|
||
| Utilities | 1 | $12B |
|
||
| Wholesale / Distribution | 1 | $5B |
|
||
| Advertising | 1 | $2B |
|
||
Price history
-18.4% since first listed2 events — show timeline
- 2025-09-17 Price Changed $199,000 NELABOR
- 2025-03-08 Listed $244,000 NELABOR
Cash-flow waterfall
monthlySold comps — $/sqft
last 12 mo · ≤1 miLoading sold comps…