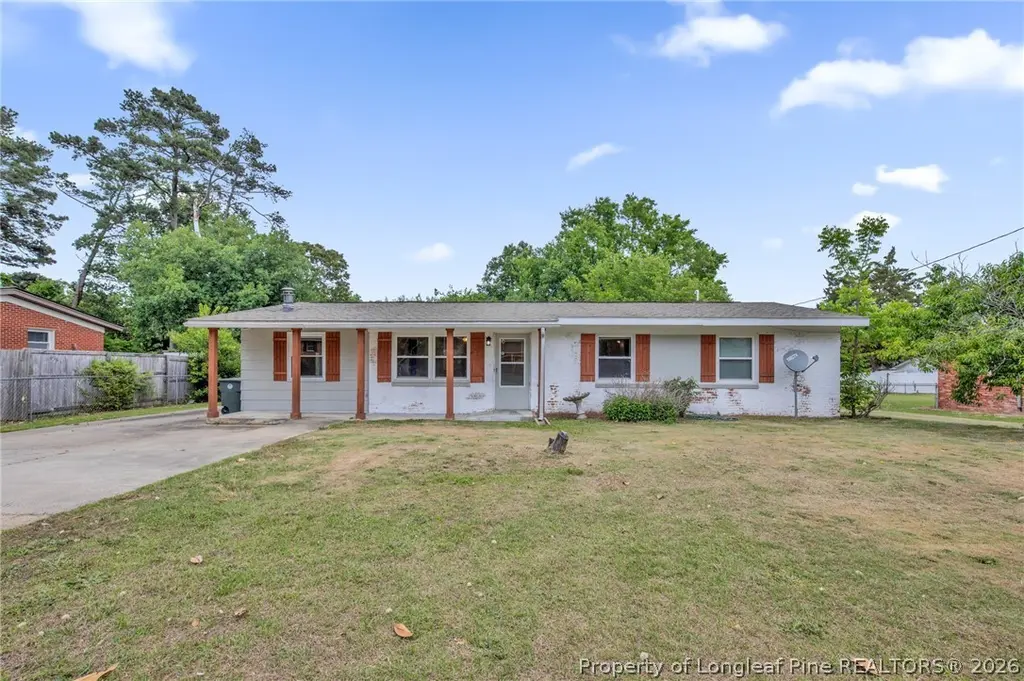
837 Montclair Rd · Fayetteville, NC
Flood risk 1/10 · Minimal
- FEMA flood zone
- X (unshaded)
- Chance of flooding over 30 yrs
- 0.0%
- Est. flood insurance / yr
- $507 – $1,088
Fire risk 4/10 · Minor
- Est. fire insurance / yr
- $906 – $1,684
Heat risk 7/10 · Major
- Hot days now (above 106°F)
- 7 days/yr
- Hot days in 30 yrs
- 16 days/yr
Wind risk 6/10 · Moderate
- Chance of severe wind over 30 yrs
- 74.0%
Air-quality risk 1/10 · Minimal
- Unhealthy air days now
- 0 days/yr
- Unhealthy air days in 30 yrs
- 0 days/yr
Risk factors via First Street. Map © Google.
Why this score? — see what drove the D grade
The composite is a weighted blend of 9 inputs, each scored 0–100. Each bar is that input's sub-score; the figure is the points it added to the 100-point composite (weight × sub-score).
- ARV discount +14.2/15.0
- Cash flow +11.1/30.0
- Livability +3.8/5.0
- Rent growth +3.3/5.0
- DSCR +3.2/10.0
- 1% rule +3.1/10.0
- Schools +3.1/10.0
- Condition / age +2.5/5.0
- Appreciation +0.0/10.0
$162,500
🖨 Deal sheet (PDF) 📄 Offer letter ✓ Due diligence
Listing remarks
Welcome home to this 3-bedroom, 2-bath property offering a functional layout and flexible living spaces. The entry opens directly into a comfortable seating area that flows seamlessly into the open kitchen, complete with space for eat-in dining—ideal for everyday living and gathering. Just off the kitchen, a utility room leads to a bonus room that was previously converted from a carport, providing additional living space with a wood stove for added character and warmth. This area continues through to the laundry room, which comes equipped with a washer and dryer for your convenience. Step outside to enjoy a partially fenced backyard with a wooded view, offering both privacy and a peac
Key facts
- Built 1961
- Listed 37 days
Property features AI
Exterior
- Parking: No garage
- Utilities: Public water; Public sewer
- Home design: Single-family residence; Residential property; Brick veneer construction; Zoned SF10 (Single Family Res 10)
- Construction: Brick veneer exterior
- Exterior features: Front porch; Porch and patio; Partial fencing
Interior
- Kitchen: Gas range; Dishwasher; Refrigerator
- Bedrooms: Total of 6 rooms (includes bedrooms and living spaces)
- Flooring: Parquet flooring; Vinyl flooring
- Bathrooms: 2 full bathrooms
- Heating & cooling: Natural gas heating; Ceiling fans for cooling
- Interior features: Ceiling fans; Eat-in kitchen; Laminate countertops; Wood-burning stove fireplace
- Laundry & utility: Washer and dryer in unit
Neighborhood map
What this means for you Summary
Snapshot
- This is a 3-bed/2.0-bath single-family listed at $162k.
Deal economics
- At list price, monthly cash flow is $-65 ($-782/yr) — negative.
- To cash-flow at today's rent, offer at most $151k (7.1% below list).
- To meet the 1% rule (rent ≥ 1% of price), the offer needs to be $132k (18.9% below list).
- Recommended offer: $132k (18.9% below list) — sets the bar for 1% rule.
- Cap rate 5.8% vs local median 4.8% in Fayetteville — meaningfully above typical; check what's discounted (condition, days-on-market, listing class) to confirm the premium yield is real.
Location & tenants
- Location reads 75/100 on livability (#45 in NC, #4,031 nationally) — a middle-class / working-renter tenant base. Strengths: commute A+, cost of living A+, housing A+; Watch: crime F, employment D-.
- Cumberland County Schools (urban): math 32% / reading 41% proficiency, ranked #126 of 178 in NC (top 71%) — families likely to look elsewhere, expect single-tenant / working-renter base with shorter leases.
- Zoned schools: Montclair Elementary (math 17% / reading 22%, grade F, #1,242 of 1,410 statewide, top 90%, 418 students, 99% FRL); Douglas Byrd Middle (math 13% / reading 30%, grade F, #422 of 475 statewide, top 89%, 935 students, 100% FRL); Douglas Byrd High (math 22% / reading 42%, grade F, #445 of 535 statewide, top 84%, 940 students, 99% FRL) — zoned schools average 99% FRL vs 55% district-wide (45 pts higher); higher-poverty schools than district average — tighter screening recommended.
- Zoned-school proficiency averages 24% at this address vs 36% district-wide (-12 pts) — the specific schools serving this property underperform the Cumberland County Schools average; the district grade overstates school quality for this exact location.
- Market conditions: Rents rising (+3.1%/yr); 435 active listings in the ZIP; 36 comparable units currently listed for rent nearby; rentals at typical pace (median 25d on market — plan ~3-4 weeks tenant-placement turnaround); 1,125 units permitted in Cumberland County in 2024 (104 in 5+ unit buildings).
Forward outlook
- Local home prices are declining (-3.0%/yr); year-one equity from $1k of loan paydown is wiped out by about $5k of value loss. Plan a longer hold.
Negotiation context
- It's been on market 38 days — a 3% lower offer ($158k) is reasonable based on typical stale-listing flexibility.
Risks & watch-outs
- Climate carrying-cost: major wind risk, 74% chance of damaging wind over 30y; extreme-heat days projected 7→16/yr by 2055 (HVAC capex compounding) — expect insurance premiums to compound above CPI over the hold.
Questions for the listing agent
- What do current leases actually rent for vs. the listed asking? Can we see a recent rent roll and the last 12 months of T-12 income?
- It's been on market 38 days. Have you received any prior offers? Is the seller open to a 19% concession, seller financing, or rate buy-down credit?
- Built in 1961 — when were the roof, HVAC, electrical panel, plumbing, and water heater last replaced?
- Is there a deadline driving the sale (1031 exchange, divorce, estate, relocation)? That informs how much negotiation room exists.
- Crime grade is F in this area — have there been break-ins, vandalism, or insurance claims at this property in the last 3 years? What carrier currently insures it and at what premium?
- The area grade is low — what's the realistic commute time and amenity access for the typical tenant pool here? Any planned neighborhood developments (good or bad) we should know about?
- What's the average days-on-market for RENTAL listings here right now (not sales)? A rising rental-DOM trend means longer vacancies and softer asking-rent achievability than the comps imply.
- What's the recent tenant-quality profile in this submarket — average credit score on applications, eviction rate, late-payment / NSF rate, and stable-employment percentage? A property-management company in the area should have these aggregated.
- How much new for-sale + rental construction is in the pipeline within 1–3 miles? Heavy new supply typically softens prices + rents 12–24 months out; constrained supply supports both.
Investment metrics
- 1% rule
- 0.81% ✗
- Cap rate
- 5.81%
- Cash-on-cash
- -1.72%
- DSCR
- 0.92
- GRM
- 10.3
CMA / ARV
- ARV (on-the-fly)
- $190,734
- Comps found
- 12
Show comp detail 12 sales within ~0.75 mi
| Address | Dist | Beds/Ba | Sqft | Sold | Price | $/sf | Match |
|---|---|---|---|---|---|---|---|
| 769 Newport Rd | 0.16mi | 3/2.0 | 1,114 (-3%) | 2mo | $121,000 | $109 | 86 |
| 821 Moriston Rd | 0.37mi | 3/2.0 | 1,117 (-3%) | 4mo | $185,000 | $166 | 75 |
| 4459 Kinkead Ct | 0.27mi | 3/2.0 | 1,237 (+8%) | 2mo | $220,000 | $178 | 73 |
| 682 Montclair Rd | 0.43mi | 3/2.0 | 1,155 (+0%) | 7mo | $210,000 | $182 | 73 |
| 4711 Watauga Rd | 0.54mi | 3/2.0 | 1,144 (-0%) | 5mo | $190,000 | $166 | 70 |
| 4709 Pamlico Rd | 0.60mi | 3/2.0 | 1,089 (-5%) | 2mo | $216,000 | $198 | 61 |
| 209 Faison Ave | 0.62mi | 3/1.0 | 1,153 (+0%) | 9mo | $90,000 | $78 | 59 |
| 4617 Belford Rd | 0.47mi | 3/1.0 | 1,040 (-10%) | 4mo | $140,000 | $135 | 55 |
| 4424 Briton Cir | 0.42mi | 3/2.0 | 1,315 (+14%) | 8mo | $220,000 | $167 | 50 |
| 4608 Ile Ct | 0.66mi | 3/2.0 | 1,281 (+12%) | 9mo | $188,000 | $147 | 42 |
| 402 Faison Ave | 0.69mi | 3/1.0 | 1,300 (+13%) | 2mo | $155,000 | $119 | 41 |
| 496 Tradewinds Dr | 0.70mi | 3/2.0 | 1,305 (+14%) | 8mo | $232,000 | $178 | 38 |
Match score weights: distance 35% · size 25% · config 20% · recency 20%. Top-matched comps best support the ARV.
Projected returns pro-forma
-3.0% appreciation · 3.11% rent growth · sell at horizon
- IRR
- -19.0%
- Equity multiple
- 0.33×
- Total profit
- $-30,326
- Equity at exit
- $24,229
- IRR
- -11.3%
- Equity multiple
- 0.32×
- Total profit
- $-31,110
- Equity at exit
- $14,050
Cash invested: $45,500 (down + closing). Projections, not guarantees.
Landlord ↔ Tenant lean methodology
- Overall (STATE)
- 85 Strongly Landlord-Friendly
- State North Carolina
- 85 Strongly Landlord-Friendly · R+3
- County
- — inherits STATE
- City
- — inherits STATE
ZIP-level market 28314
- Home prices YoY
- -15.7%
- Rents YoY
- 3.1%
- Active inventory
- 435
- Price-to-rent
- 10.3×
Monthly cashflow live
- Estimated rent
- $1,318 high interval (Pro) →
- Mortgage (P&I)
- −$852
- Tax from tax record
- −$187 /mo · $2,241/yr
- Insurance
- −$68
- HOA
- −$0
- Vacancy / Maint / Mgmt
- −$277
- Net cashflow
- $-65
Break-even live
Sensitivity live
| Price | -10% $27 | -5% $-19 | +0% $-65 | +5% $-111 | +10% $-157 |
|---|---|---|---|---|---|
| Rent | -10% $-169 | -5% $-117 | +0% $-65 | +5% $-13 | +10% $39 |
| Rate | -1.0pp $17 | -0.5pp $-24 | base $-65 | +0.5pp $-107 | +1.0pp $-150 |
UW: 25.0% down · 7.5% · 30yr · 1.5% tax · 5.0% vac · 8.0% maint · 8.0% mgmt
Financing live
Cash to close
- Down payment
- $40,625
- Closing costs
- $4,875
- Reserves months
- —
- Total cash needed
- —
Loan-product check · same deal, 3 products live
Conventional
25% down · 7.5% · 30yr
- Down + closing
- —
- Monthly P&I
- —
- Monthly cashflow
- —
- DSCR
- —
- Eligible?
- —
Personal DTI + credit; lowest rate.
DSCR
20% down · 8.5% · 30yr
- Down + closing
- —
- Monthly P&I
- —
- Monthly cashflow
- —
- DSCR
- —
- Eligible?
- —
No personal income docs; deal must DSCR.
Hard money
10% down · 12.0% · 12mo
- Down + closing
- —
- Monthly P&I
- —
- Monthly cashflow
- —
- DSCR
- —
- Eligible?
- —
Short-term bridge; refi at stabilization.
Rent comps 36 comps
| Address | Beds | Baths | Sqft | Rent | $/sqft | DOM | Units | Dist |
|---|---|---|---|---|---|---|---|---|
| 4810 Alamance Rd Fayetteville, NC | 1.0–2.0 | 1.0–2.0 | 827 | $1,200 | $1.45 | 24d | 1 | 0.49mi |
| 1309 Ireland Dr Fayetteville, NC | 2.0 | 1.5 | 900 | $1,000 | $1.11 | 15d | 1 | 0.57mi |
| 1313 Ireland Dr Unit B Fayetteville, NC | 2.0 | 1.5 | 900 | $1,000 | $1.11 | 24d | 1 | 0.58mi |
| 400 Roxie Ave Fayetteville, NC | 2.0 | 2.0 | 1162 | $1,700 | $1.46 | 15d | 1 | 0.73mi |
| 3411 Lainey Ln Fayetteville, NC | 2.0 | 2.0 | 1142 | $1,300 | $1.14 | 24d | 1 | 0.75mi |
| 4909 Walnut Dr Fayetteville, NC | 3.0 | 2.0 | 1188 | $1,500 | $1.26 | 24d | 1 | 0.77mi |
| 609 Ashbrook Ct Fayetteville, NC | 2.0 | 1.5 | 997 | $1,049 | $1.05 | 24d | 1 | 0.81mi |
| 613 Ashbrook Ct Fayetteville, NC | 3.0 | 1.5 | 1103 | $1,299 | $1.18 | 24d | 1 | 0.82mi |
| 4935 Walnut Dr Fayetteville, NC | 3.0 | 1.5 | 1024 | $1,200 | $1.17 | 15d | 1 | 0.83mi |
| 600 Ashbrook Ct Fayetteville, NC | 2.0–3.0 | 1.5 | 1050 | $1,299 | $1.24 | 22d | 6 | 0.83mi |
| 910 Miller Ave Unit 910 Fayetteville, NC | 2.0 | 2.0 | 1000 | $1,250 | $1.25 | 24d | 1 | 0.86mi |
| 409 Tradewinds Dr Fayetteville, NC | 1.0–2.0 | 1.0–2.0 | 867 | $1,195 | $1.38 | 15d | 16 | 0.87mi |
| 855 King Arthur Dr Fayetteville, NC | 1.0–2.0 | 1.0–2.0 | 810 | $1,182 | $1.46 | 15d | 9 | 0.87mi |
| 4809 Belford Rd Fayetteville, NC | 3.0 | 1.5 | 1459 | $1,300 | $0.89 | 24d | 1 | 0.92mi |
| 4627 Keg Ct Fayetteville, NC | 3.0 | 1.5 | 1272 | $1,300 | $1.02 | 24d | 1 | 0.94mi |
| 3212 Tallywood Dr Unit 03 Fayetteville, NC | 2.0 | 1.0 | 900 | $900 | $1.00 | 24d | 1 | 0.94mi |
| 5200 Cypress Rd Fayetteville, NC | 3.0 | 1.0 | 1210 | $1,250 | $1.03 | 24d | 1 | 0.94mi |
| 4547 Chambersburg Rd Fayetteville, NC | 3.0 | 1.5 | 1198 | $1,500 | $1.25 | 24d | 1 | 0.95mi |
| 3211 Tallywood Dr Fayetteville, NC | 1.0–3.0 | 1.0–1.5 | 925 | $999 | $1.08 | 24d | 1 | 0.97mi |
| 3210 Tallywood Dr Unit 09 Fayetteville, NC | 2.0 | 1.0 | 900 | $900 | $1.00 | 22d | 1 | 0.97mi |
| 3210 Tallywood Dr #12 Fayetteville, NC | 3.0 | 1.5 | 1000 | $1,000 | $1.00 | 22d | 1 | 0.98mi |
| 3210 Tallywood Dr #04 Fayetteville, NC | 2.0 | 1.0 | 900 | $900 | $1.00 | 24d | 1 | 0.98mi |
| 3209 Tallywood Dr Unit 06 Fayetteville, NC | 2.0 | 1.0 | 800 | $900 | $1.12 | 24d | 1 | 0.99mi |
| 1005 Ancestry Dr #2 Fayetteville, NC | 2.0 | 2.0 | 950 | $995 | $1.05 | 15d | 1 | 1.12mi |
| 1008 Ancestry Dr Fayetteville, NC | 2.0 | 2.5 | 1200 | $1,045 | $0.87 | 24d | 1 | 1.12mi |
| 1031 Ancestry Dr Fayetteville, NC | 2.0 | 2.0 | 950 | $935 | $0.98 | 24d | 1 | 1.16mi |
| 821 Sandalwood Dr Fayetteville, NC | 3.0 | 1.0 | 1204 | $1,200 | $1.00 | 15d | 1 | 1.16mi |
| 4101 Coventry Rd Fayetteville, NC | 3.0 | 1.0 | 1132 | $1,150 | $1.02 | 15d | 1 | 1.17mi |
| 1044 Ancestry Dr Fayetteville, NC | 2.0 | 2.5 | 1200 | $1,045 | $0.87 | 15d | 1 | 1.19mi |
| 3526 Furman Dr Fayetteville, NC | 3.0 | 1.5 | 1050 | $1,500 | $1.43 | 24d | 1 | 1.23mi |
| 909 Sandalwood Dr Fayetteville, NC | 3.0 | 1.0 | 1346 | $1,595 | $1.18 | 24d | 1 | 1.23mi |
| 1100 Marlborough Rd Fayetteville, NC | 2.0 | 2.0 | 1025 | $1,198 | $1.17 | 15d | 5 | 1.33mi |
| 1100 Marlborough Rd Fayetteville, NC | 2.0 | 2.0 | 1025 | $1,198 | $1.17 | 22d | 5 | 1.33mi |
| 1401 Habersham Dr Fayetteville, NC | 3.0 | 2.0 | 1250 | $1,700 | $1.36 | 24d | 1 | 1.43mi |
| 5842 Aftonshire Dr Fayetteville, NC | 2.0 | 1.5 | 1010 | $1,000 | $0.99 | 24d | 1 | 1.49mi |
| 5864 Aftonshire Dr Fayetteville, NC | 2.0 | 2.0 | 1100 | $1,100 | $1.00 | 24d | 1 | 1.49mi |
Listing history 18 events
-
2026-06-21days on market $162,500 Active 38 DOM
-
2026-06-18days on market $162,500 Active 35 DOM
-
2026-06-17days on market $162,500 Active 34 DOM
-
2026-06-16days on market $162,500 Active 33 DOM
-
2026-06-15days on market $162,500 Active 32 DOM
-
2026-06-14days on market $162,500 Active 30 DOM
-
2026-06-13days on market $162,500 Active 29 DOM
-
2026-06-10pricedays on market $162,500 Active 27 DOM
-
2026-06-09days on market $165,000 Active 26 DOM
-
2026-06-08days on market $165,000 Active 25 DOM
-
2026-06-07days on market $165,000 Active 24 DOM
-
2026-06-03days on market $165,000 Active 20 DOM
-
2026-06-02days on market $165,000 Active 19 DOM
-
2026-06-01days on market $165,000 Active 18 DOM
-
2026-05-31days on market $165,000 Active 17 DOM
-
2026-05-30days on market $165,000 Active 16 DOM
-
2026-05-15$165,000 Active
-
2026-05-12historical $165,000
ⓘ Source: listings_history table (triggers on properties + properties_extension) + one-shot
backfill from property_details.listing_events for pre-trigger history.
Tax reassessment forecast NC · Resets to sale price
- Current annual tax
- $2,241 · $187/mo
- Projected year-2 tax
- $2,241 · $187/mo
- Expected delta
- $0/yr ($0/mo · 0.0%)
ⓘ Screening estimate from a state-policy table — verify with the county assessor before closing.
Climate risk First Street
- Flood 1/10 Low FEMA zone X (unshaded) · 0% chance over 30 yrs
- Wildfire 4/10 Moderate
- Heat 7/10 Severe 7 d/yr ≥106°F today · 16 d/yr by 30 yrs out
- Wind 6/10 Major 74% chance of damaging wind over 30 yrs
- Air quality 1/10 Low 0 unhealthy d/yr today · 0 by 30 yrs out
Nearby sold comps map
Loading sold comps map…
Walkable amenities ~0.75 mi
Loading nearby amenities…
Taxation est. · year 1
- Rental income
- $15,820
- − Mortgage interest
- −$9,103
- − Property taxes
- −$2,241
- − Insurance
- −$812
- − Repairs & maintenance
- −$1,266
- − Management
- −$1,266
- − Depreciation
- −$4,727
- Taxable loss
- −$3,595
- Est. tax savings @ 24.0%
- +$863
- After-tax cash flow
- $81/yr
For passive investors: Depreciation is non-cash, so a rental often shows a tax loss while cash-flowing — sheltering income. Rental losses are passive: they offset passive income freely, and up to $25,000/yr can offset ordinary (W-2) income if you actively participate and your MAGI is under $100k (phasing out to $0 by $150k); unused losses carry forward. On sale, claimed depreciation is recaptured at up to 25%, and gains may owe capital-gains tax (a 1031 exchange can defer both). Figures are a year-1 estimate at your 24.0% rate — not tax advice; consult a CPA.
Schools (NCES district)
- District
- Cumberland County Schools
- NCES district ID
- 3700011
- Math proficiency
- 32% ▼ -2.00%
- Reading proficiency
- 41% ▼ -1.00%
- Median HH income
- $44,168
- Composite
- 31.0/100
- National rank
- #6096
- State rank
- #126 of 178 in NC
Livability — Fayetteville
- Score
- 75/100
- State rank
- #45
- US rank
- #4031
Category grades
Schools grade is shown separately in the Schools card above.
Census & demographics
- Census place
- Fayetteville, NC
- County
- Cumberland County · 265,314 people
- City population
- 226,118
- Metro
- Fayetteville, NC
- Population (ZIP)
- 55,834
- Household income
- $62,249
- Rent vs Own
- Severe rent burden
- 2511.0
Population outlook (Cumberland County) Hauer SSP2
- Today (2025)
- 330,855 people
- By 2030
- 333,523 · +0.8%
- By 2040
- 335,583 · +1.4%
- By 2050
- 335,325 · +1.4%
- By 2075
- 342,853 · +3.6%
- By 2100
- 340,698 · +3.0%
Race, ethnicity, and origin ACS 2023
- Neighborhood character
- Diverse neighborhood (Simpson 0.67)
- Race & ethnicity
- Black 49% White 25% Hispanic / Latino 16% Two or more races 11% Asian 3%
- Hispanic origin (detail)
- Mexican 5% Puerto Rican 6% Dominican 1%
- Common ancestry
- Slovak 1% Romanian 1% Lithuanian 1%
- Foreign-born
- 9% · Canada, South Korea
- Languages at home
- 84% English-only · Spanish 10% Korean 1% Other Asian/Pacific 1%
Political lean MEDSL · Cumberland
- 2024 margin
- D (+13.4) · D 56.1% · R 42.7% · Other 1.2%
- 2008→2024 swing
- -4.3pp toward R · 2008: 17.7pp · 2024: 13.4pp
- All cycles
- 2024: D+13.4 2020: D+16.6 2016: D+16.0 2012: D+19.7 2008: D+17.7
Not yet ingested
- Civics
- —
Market trends
- HPI YoY
- ▼ -43.20%
- Current HPI
- 231.873
- Rent YoY
- ▲ 3.11%
- Metro
- Fayetteville, NC
- State GDP YoY
- ▲ 3.28%
- F500 in state
- 26
Industry mix (Fortune 500 HQ in NC)
| Industry | F500 HQs | Revenue |
|---|---|---|
| Financial Services | 2 | $213B |
|
||
| Retail | 2 | $95B |
|
||
| Industrial Conglomerate | 1 | $38B |
|
||
| Metals / Steel | 1 | $35B |
|
||
| Utilities | 1 | $30B |
|
||
| Industrial Machinery | 1 | $19B |
|
||
Price history
+0.0% since first listed2 events — show timeline
- 2026-05-15 Listed $165,000 LPRMLS
- 2026-05-12 Coming Soon $165,000 LPRMLS
Property tax history
+5.7%/yrLatest (2025): $2,241 · +37.1% YoY. Source: county tax records.
Cash-flow waterfall
monthlySold comps — $/sqft
last 12 mo · ≤1 miLoading sold comps…