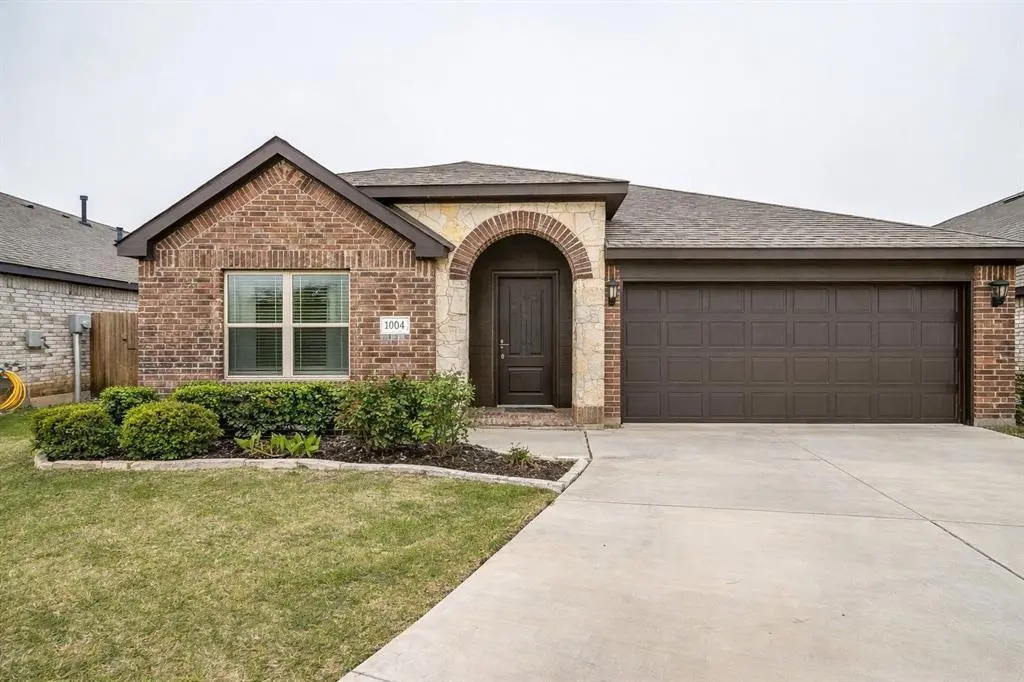
1004 Fairfax Dr · Godley, TX
Flood risk 1/10 · Minimal
- FEMA flood zone
- X (unshaded)
- Chance of flooding over 30 yrs
- 0.0%
- Est. flood insurance / yr
- $507 – $1,088
Fire risk 6/10 · Moderate
- Est. fire insurance / yr
- $1,222 – $2,270
Heat risk 7/10 · Major
- Hot days now (above 109°F)
- 7 days/yr
- Hot days in 30 yrs
- 23 days/yr
Wind risk 6/10 · Moderate
- Chance of severe wind over 30 yrs
- 27.0%
Air-quality risk 3/10 · Minor
- Unhealthy air days now
- 2 days/yr
- Unhealthy air days in 30 yrs
- 3 days/yr
Risk factors via First Street. Map © Google.
Why this score? — see what drove the D- grade
The composite is a weighted blend of 9 inputs, each scored 0–100. Each bar is that input's sub-score; the figure is the points it added to the 100-point composite (weight × sub-score).
- ARV discount +13.4/15.0
- Cash flow +7.8/30.0
- Livability +3.7/5.0
- 1% rule +3.5/10.0
- Schools +3.2/10.0
- Rent growth +2.5/5.0
- Condition / age +2.5/5.0
- DSCR +1.9/10.0
- Appreciation +0.0/10.0
$289,999
🖨 Deal sheet 📄 Offer letter ✓ Due diligence
Listing remarks MLS
GODLEY ISD! Listed in the heart of Godley. This beautiful 3 bedroom 2 bath home has it all. The living room has an open concept, natural light, and plenty of space for entertaining. Kitchen includes: lots of cabinet space for storage, island, stainless steel appliances, granite counters, large pantry, and an eat in dining area. The home features generously sized bedrooms, including a comfortable primary suite with a private bath, providing a peaceful retreat at the end of the day. Additional bedrooms offer flexibility for guests, a home office, or growing family. The backyard is a private sanctuary perfect for outdoor activities and relaxation. Spend your evenings unwinding on the patio, enjoying the Texas sunset. Garage has epoxy floors, AC unit, room for hangouts, and a pool table!
Key facts
- 6,186 sq ft lot
- 2 garage spots
- Built 2020
Neighborhood map
What this means for you Summary
Snapshot
- This is a 3-bed/2.0-bath single-family listed at $290k.
Deal economics
- At list price, monthly cash flow is $-324 ($-4k/yr) — negative.
- To cash-flow at today's rent, offer at most $233k (19.7% below list).
- To meet the 1% rule (rent ≥ 1% of price), the offer needs to be $246k (15.0% below list).
- Recommended offer: $233k (19.7% below list) — sets the bar for cash-flow.
- Cap rate 5.0% vs local median 2.8% in Godley — top-decile yield for the area; either an underpriced asset or a hidden risk that comps aren't pricing in. Stress-test before assuming the spread holds.
Location & tenants
- Location reads 73/100 on livability (#226 in TX) — a middle-class / working-renter tenant base. Strengths: crime A+, cost of living A+, housing A+; Watch: schools D+, health & safety D+, amenities F.
- Godley ISD (rural): math 34% / reading 38% proficiency, ranked #466 of 826 in TX (top 56%) — families likely to look elsewhere, expect single-tenant / working-renter base with shorter leases.
- Market conditions: 565 active listings in the ZIP; 8 comparable units currently listed for rent nearby; rentals at typical pace (median 17d on market — plan ~3-4 weeks tenant-placement turnaround); 2,152 units permitted in Johnson County in 2024 (76 in 5+ unit buildings).
Forward outlook
- Local home prices are declining (-3.0%/yr); year-one equity from $2k of loan paydown is wiped out by about $9k of value loss. Plan a longer hold.
- Johnson County population projected at +24% by 2050 — long-run rental-demand tailwind backs the buy-and-hold thesis.
Negotiation context
- It's been on market 69 days — a 6% lower offer ($273k) is reasonable based on typical stale-listing flexibility.
Risks & watch-outs
- Climate carrying-cost: major wind risk, 27% chance of damaging wind over 30y; major wildfire risk; extreme-heat days projected 7→23/yr by 2055 (HVAC capex compounding) — expect insurance premiums to compound above CPI over the hold.
Questions for the listing agent
- What do current leases actually rent for vs. the listed asking? Can we see a recent rent roll and the last 12 months of T-12 income?
- It's been on market 69 days. Have you received any prior offers? Is the seller open to a 20% concession, seller financing, or rate buy-down credit?
- What does the HOA fee cover, when was the last increase, and are there any pending special assessments or reserve-fund shortfalls?
- Why hasn't it sold? Are there any deal-killer items the seller is aware of (foundation, flood, title, zoning, code violations)?
- Is there a deadline driving the sale (1031 exchange, divorce, estate, relocation)? That informs how much negotiation room exists.
- Schools are D-rated, which usually means shorter tenancies and higher turnover. Who's the typical renter profile here, and what's been the actual vacancy rate?
- The area grade is low — what's the realistic commute time and amenity access for the typical tenant pool here? Any planned neighborhood developments (good or bad) we should know about?
- What's the average days-on-market for RENTAL listings here right now (not sales)? A rising rental-DOM trend means longer vacancies and softer asking-rent achievability than the comps imply.
- What's the recent tenant-quality profile in this submarket — average credit score on applications, eviction rate, late-payment / NSF rate, and stable-employment percentage? A property-management company in the area should have these aggregated.
- How much new for-sale + rental construction is in the pipeline within 1–3 miles? Heavy new supply typically softens prices + rents 12–24 months out; constrained supply supports both.
Investment metrics
- 1% rule
- 0.85% ✗
- Cap rate
- 4.95%
- Cash-on-cash
- -4.78%
- DSCR
- 0.79
- GRM
- 9.8
CMA / ARV
- ARV (median comp)
- $334,053
- List price
- $289,999
- Delta
- -13.19%
- Verdict
- UNDERPRICED
- Comps
- 20 within 1.0 mi
Show comp detail 12 sales within ~0.75 mi
| Address | Dist | Beds/Ba | Sqft | Sold | Price | $/sf | Match |
|---|---|---|---|---|---|---|---|
| 1156 Goldenrod Dr | 0.30mi | 3/2.0 | 1,711 (+0%) | 5mo | $235,000 | $137 | 81 |
| 1027 Stockton Dr | 0.12mi | 3/2.0 | 1,859 (+9%) | 1mo | $315,000 | $169 | 78 |
| 933 Creekhollow Dr | 0.44mi | 3/2.0 | 1,672 (-2%) | 1mo | $320,000 | $191 | 76 |
| 517 Mckittrick Ct | 0.46mi | 3/2.0 | 1,759 (+3%) | 6mo | $369,000 | $210 | 68 |
| 924 Creekhollow Dr | 0.47mi | 3/2.0 | 1,672 (-2%) | 8mo | $314,000 | $188 | 68 |
| 517 Highview Ct | 0.48mi | 3/2.0 | 1,798 (+6%) | 2mo | $335,000 | $186 | 67 |
| 525 Mckittrick Ct | 0.44mi | 3/2.0 | 1,807 (+6%) | 3mo | $359,500 | $199 | 67 |
| 200 High Ridge Ct | 0.44mi | 4/2.0 (+1) | 1,762 (+4%) | 6mo | $369,000 | $209 | 63 |
| 432 Avian Way | 0.54mi | 2/2.0 (-1) | 1,794 (+5%) | 1mo | $299,990 | $167 | 60 |
| 904 River Oaks Dr | 0.44mi | 3/2.0 | 1,840 (+8%) | 8mo | $355,000 | $193 | 59 |
| 300 W Godley Ave | 0.62mi | 3/2.0 | 1,531 (-10%) | 7mo | $265,000 | $173 | 48 |
| 448 Avian Way | 0.51mi | 4/3.0 (+1) | 1,952 (+15%) | 3mo | $319,990 | $164 | 40 |
Match score weights: distance 35% · size 25% · config 20% · recency 20%. Top-matched comps best support the ARV.
Projected returns pro-forma
-3.0% appreciation · 3.0% rent growth · sell at horizon
- IRR
- -24.3%
- Equity multiple
- 0.17×
- Total profit
- $-67,396
- Equity at exit
- $43,240
- IRR
- -19.4%
- Equity multiple
- -0.04×
- Total profit
- $-84,404
- Equity at exit
- $25,074
Cash invested: $81,200 (down + closing). Projections, not guarantees.
Landlord ↔ Tenant lean methodology
- Overall (STATE)
- 87 Strongly Landlord-Friendly
- State Texas
- 87 Strongly Landlord-Friendly · R+5
- County
- — inherits STATE
- City
- — inherits STATE
ZIP-level market 76044
- Home prices YoY
- -12.4%
- Active inventory
- 565
- Price-to-rent
- 9.8×
Monthly cashflow live
- Estimated rent
- $2,464 high interval (Pro) →
- Mortgage (P&I)
- −$1,521
- Tax from tax record
- −$596 /mo · $7,148/yr
- Insurance
- −$121
- HOA
- −$33
- Vacancy / Maint / Mgmt
- −$517
- Net cashflow
- $-324
Break-even live
UW: 25.0% down · 7.5% · 30yr · 1.5% tax · 5.0% vac · 8.0% maint · 8.0% mgmt
Financing live
Cash to close
- Down payment
- $72,500
- Closing costs
- $8,700
- Reserves months
- —
- Total cash needed
- —
Loan-product check · same deal, 3 products live
Conventional
25% down · 7.5% · 30yr
- Down + closing
- —
- Monthly P&I
- —
- Monthly cashflow
- —
- DSCR
- —
- Eligible?
- —
Personal DTI + credit; lowest rate.
DSCR
20% down · 8.5% · 30yr
- Down + closing
- —
- Monthly P&I
- —
- Monthly cashflow
- —
- DSCR
- —
- Eligible?
- —
No personal income docs; deal must DSCR.
Hard money
10% down · 12.0% · 12mo
- Down + closing
- —
- Monthly P&I
- —
- Monthly cashflow
- —
- DSCR
- —
- Eligible?
- —
Short-term bridge; refi at stabilization.
Rent comps 8 comps
| Address | Beds | Baths | Sqft | Rent | $/sqft | DOM | Units | Dist |
|---|---|---|---|---|---|---|---|---|
| 920 Elk Ridge Run Godley, TX | 3.0 | 2.0 | 1692 | $2,499 | $1.48 | 16d | 1 | 0.31mi |
| 920 Elk Ridge Run Godley, TX | 3.0 | 2.0 | 1683 | $2,499 | $1.48 | 10d | 1 | 0.31mi |
| 201 Cliff Ct Godley, TX | 3.0 | 2.0 | 1852 | $2,900 | $1.57 | 10d | 1 | 0.45mi |
| 644 The Cottages Dr Godley, TX | 3.0 | 2.0 | 1662 | $1,995 | $1.20 | 43d | 1 | 0.62mi |
| 9500 County Road 1001 Godley, TX | 1.0–3.0 | 1.0–2.0 | 1063 | $2,025 | $1.90 | 1d | 13 | 0.92mi |
| 8213 Korat Vis Godley, TX | 4.0 | 2.0 | 1851 | $2,300 | $1.24 | 24d | 1 | 1.16mi |
| 812 Rodgers Ave Godley, TX | 3.0 | 2.0 | 1747 | $2,600 | $1.49 | 43d | 1 | 1.18mi |
| 226 Harp Ave Godley, TX | 3.0 | 2.0 | 1737 | $2,400 | $1.38 | 1d | 1 | 1.24mi |
HOA detail
- Monthly dues
- $33 · $396/yr
- Likely covers
- pool
Listing history 16 events
-
2026-06-18days on market $289,999 Active 69 DOM
-
2026-06-17days on market $289,999 Active 68 DOM
-
2026-06-16days on market $289,999 Active 67 DOM
-
2026-06-15days on market $289,999 Active 66 DOM
-
2026-06-13days on market $289,999 Active 64 DOM
-
2026-06-13days on market $289,999 Active 63 DOM
-
2026-06-09days on market $289,999 Active 60 DOM
-
2026-06-08days on market $289,999 Active 59 DOM
-
2026-06-07days on market $289,999 Active 58 DOM
-
2026-06-04days on market $289,999 Active 55 DOM
-
2026-06-03days on market $289,999 Active 54 DOM
-
2026-06-02days on market $289,999 Active 53 DOM
-
2026-06-01days on market $289,999 Active 52 DOM
-
2026-05-31days on market $289,999 Active 51 DOM
-
2026-04-30price $289,999 794-char remark
Show marketing remark (794 chars)
GODLEY ISD! Listed in the heart of Godley. This beautiful 3 bedroom 2 bath home has it all. The living room has an open concept, natural light, and plenty of space for entertaining. Kitchen includes: lots of cabinet space for storage, island, stainless steel appliances, granite counters, large pantry, and an eat in dining area. The home features generously sized bedrooms, including a comfortable primary suite with a private bath, providing a peaceful retreat at the end of the day. Additional bedrooms offer flexibility for guests, a home office, or growing family. The backyard is a private sanctuary perfect for outdoor activities and relaxation. Spend your evenings unwinding on the patio, enjoying the Texas sunset. Garage has epoxy floors, AC unit, room for hangouts, and a pool table!
-
2026-04-10$299,999 Active 794-char remark
Show marketing remark (794 chars)
GODLEY ISD! Listed in the heart of Godley. This beautiful 3 bedroom 2 bath home has it all. The living room has an open concept, natural light, and plenty of space for entertaining. Kitchen includes: lots of cabinet space for storage, island, stainless steel appliances, granite counters, large pantry, and an eat in dining area. The home features generously sized bedrooms, including a comfortable primary suite with a private bath, providing a peaceful retreat at the end of the day. Additional bedrooms offer flexibility for guests, a home office, or growing family. The backyard is a private sanctuary perfect for outdoor activities and relaxation. Spend your evenings unwinding on the patio, enjoying the Texas sunset. Garage has epoxy floors, AC unit, room for hangouts, and a pool table!
ⓘ Source: listings_history table (triggers on properties + properties_extension) + one-shot
backfill from property_details.listing_events for pre-trigger history.
Tax reassessment forecast TX · Resets to sale price
- Current annual tax
- $7,148 · $596/mo
- Projected year-2 tax
- $7,148 · $596/mo
- Expected delta
- $0/yr ($0/mo · 0.0%)
ⓘ Screening estimate from a state-policy table — verify with the county assessor before closing.
Climate risk First Street
- Flood 1/10 Low FEMA zone X (unshaded) · 0% chance over 30 yrs
- Wildfire 6/10 Major
- Heat 7/10 Severe 7 d/yr ≥109°F today · 23 d/yr by 30 yrs out
- Wind 6/10 Major 27% chance of damaging wind over 30 yrs
- Air quality 3/10 Moderate 2 unhealthy d/yr today · 3 by 30 yrs out
Nearby sold comps map
Loading sold comps map…
Walkable amenities ~0.75 mi
Loading nearby amenities…
Taxation est. · year 1
- Rental income
- $29,571
- − Mortgage interest
- −$16,244
- − Property taxes
- −$7,148
- − Insurance
- −$1,450
- − Repairs & maintenance
- −$2,366
- − Management
- −$2,366
- − HOA
- −$396
- − Depreciation
- −$8,436
- Taxable loss
- −$8,835
- Est. tax savings @ 24.0%
- +$2,120
- After-tax cash flow
- $-1,762/yr
For passive investors: Depreciation is non-cash, so a rental often shows a tax loss while cash-flowing — sheltering income. Rental losses are passive: they offset passive income freely, and up to $25,000/yr can offset ordinary (W-2) income if you actively participate and your MAGI is under $100k (phasing out to $0 by $150k); unused losses carry forward. On sale, claimed depreciation is recaptured at up to 25%, and gains may owe capital-gains tax (a 1031 exchange can defer both). Figures are a year-1 estimate at your 24.0% rate — not tax advice; consult a CPA.
Schools (NCES district)
- District
- Godley ISD
- NCES district ID
- 4820960
- Math proficiency
- 34% ▼ -4.00%
- Reading proficiency
- 38% ▲ 2.00%
- Median HH income
- $59,332
- Composite
- 32.06/100
- National rank
- #5820
- State rank
- #466 of 826 in TX
Livability — Godley
- Score
- 73/100
- State rank
- #226
- US rank
- #5528
Category grades
Schools grade is shown separately in the Schools card above.
Census & demographics
- Census place
- Godley, TX
- Population (ZIP)
- 8,759
Population outlook (Johnson County) Hauer SSP2
- Today (2025)
- 179,678 people
- By 2030
- 189,208 · +5.3%
- By 2040
- 207,261 · +15.4%
- By 2050
- 223,064 · +24.1%
- By 2075
- 259,979 · +44.7%
- By 2100
- 275,395 · +53.3%
Race, ethnicity, and origin ACS 2023
- Neighborhood character
- Predominantly White (76%)
- Race & ethnicity
- White 76% Hispanic / Latino 19% Two or more races 9% Black 3%
- Hispanic origin (detail)
- Mexican 14%
- Common ancestry
- Slovak 2% Romanian 1% Iranian 1%
- Foreign-born
- 4% · Canada
- Languages at home
- 88% English-only · Spanish 11%
Political lean MEDSL · Johnson
- 2024 margin
- Solid R (+51.4) · D 23.9% · R 75.3%
- 2008→2024 swing
- -3.9pp toward R · 2008: -47.5pp · 2024: -51.4pp
- All cycles
- 2024: R+51.4 2020: R+53.0 2016: R+58.3 2012: R+55.6 2008: R+47.5
Not yet ingested
- Civics
- —
Market trends
- HPI YoY
- ▼ -36.58%
- Current HPI
- 259.1029
- Rent YoY
- —
- Metro
- —
- State GDP YoY
- ▲ 3.95%
- F500 in state
- 110
Industry mix (Fortune 500 HQ in TX)
| Industry | F500 HQs | Revenue |
|---|---|---|
| Energy | 16 | $1,198B |
|
||
| Technology | 5 | $198B |
|
||
| Engineering / Construction | 4 | $72B |
|
||
| Energy Services | 3 | $60B |
|
||
| Utilities | 3 | $41B |
|
||
| Healthcare | 2 | $330B |
|
||
Price history
-3.3% since first listed2 events — show timeline
- 2026-04-30 Price Changed $289,999 NTREIS
- 2026-04-10 Listed $299,999 NTREIS
Property tax history
+101.3%/yrLatest (2025): $7,148 · +11.8% YoY. Source: county tax records.
Cash-flow waterfall
monthlySold comps — $/sqft
last 12 mo · ≤1 miLoading sold comps…