310 W Floyd Baker Blvd · Gaffney, SC
Flood risk 1/10 · Minimal
- FEMA flood zone
- X (unshaded)
- Chance of flooding over 30 yrs
- 0.0%
- Est. flood insurance / yr
- $507 – $1,088
Fire risk 3/10 · Minor
- Est. fire insurance / yr
- $783 – $1,453
Heat risk 6/10 · Moderate
- Hot days now (above 103°F)
- 7 days/yr
- Hot days in 30 yrs
- 16 days/yr
Wind risk 2/10 · Minimal
- Chance of severe wind over 30 yrs
- 3.0%
Air-quality risk 4/10 · Minor
- Unhealthy air days now
- 4 days/yr
- Unhealthy air days in 30 yrs
- 4 days/yr
Risk factors via First Street. Map © Google.
Why this score? — see what drove the B- grade
The composite is a weighted blend of 9 inputs, each scored 0–100. Each bar is that input's sub-score; the figure is the points it added to the 100-point composite (weight × sub-score).
- Cash flow +30.0/30.0
- 1% rule +10.0/10.0
- DSCR +10.0/10.0
- ARV discount +7.5/15.0
- Livability +3.3/5.0
- Schools +2.8/10.0
- Rent growth +2.5/5.0
- Condition / age +2.5/5.0
- Appreciation +0.0/10.0
$25,000
🖨 Deal sheet 📄 Offer letter ✓ Due diligence
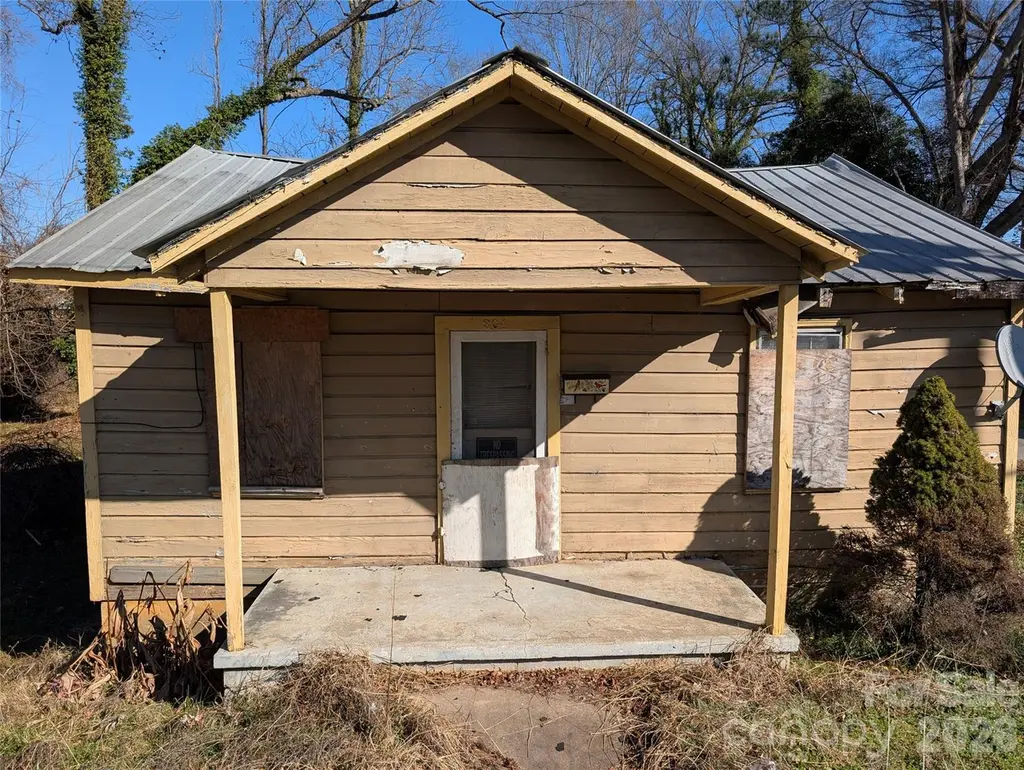
Listing remarks
Prime investment opportunity located right in the center of Gaffney, SC! This property is aggressively priced and ready for a complete renovation. The location is unbeatable—enjoy direct front road access that leads right to Exit 92, placing you just 5 minutes from I-85. You are also just 2 minutes from heavy hitters like Walmart, Lowe's, Belk, Chick-fil-A, and other major dining options. Please be advised that the property needs repairs and the Seller has no representation or information regarding city utility connections. A fantastic project for investors looking to capitalize on Gaffney's growth.
Key facts
- 5 minutes from i-85
- Complete renovation
- Major dining options
Tags
Property features AI
Finance
- Other: Property type: Residential — Single Family Residence; Lot size approximately 0.08 acres
- HOA & community: No HOA
Exterior
- Parking: No main-level garage; Other parking (back yard)
- Utilities: Water: Other (see remarks); Sewer: Other (see remarks); No other utilities listed
- Home design: Single-family residence; Site-built construction; Wood construction; One story; Facing direction not specified; Entry level not specified
- Construction: Built on a crawl space; Wood construction
- Exterior features: Back yard parking available; Paved, publicly maintained road access
Interior
- Kitchen: No appliances listed
- Bedrooms: 2 bedrooms on the main level
- Bathrooms: 1 full bathroom on the main level
- Heating & cooling: No heating or cooling systems listed
- Interior features: One-level layout; Crawl space foundation; Fireplace
- Laundry & utility: No laundry features listed
Neighborhood map
What this means for you Summary
Snapshot
- This is a 2-bed/1.0-bath single-family listed at $25k.
Deal economics
- At list price, monthly cash flow is $591 ($7k/yr) — positive.
- The deal already cash-flows at list — no discount required.
- Meets the 1% rule at list price ($945 rent vs $25k).
- Cap rate 34.7% vs local median 2.6% in Gaffney — top-decile yield for the area; either an underpriced asset or a hidden risk that comps aren't pricing in. Stress-test before assuming the spread holds.
Location & tenants
- Location reads 66/100 on livability (#112 in SC) — a middle-class / working-renter tenant base. Strengths: cost of living A+, health & safety A+, housing A-; Watch: amenities D+, crime D, schools D-.
- Cherokee 01 (rural): math 29% / reading 40% proficiency, ranked #47 of 80 in SC (top 59%) — families likely to look elsewhere, expect single-tenant / working-renter base with shorter leases; 64% free/reduced lunch — lower-income household profile, screen leases tightly.
- Market conditions: 196 active listings in the ZIP; 1 comparable units currently listed for rent nearby; 200 units permitted in Cherokee County in 2024 (0 in 5+ unit buildings).
Forward outlook
- Local home prices are declining (-3.0%/yr); year-one equity from $173 of loan paydown is wiped out by about $750 of value loss. Plan a longer hold.
- At projected returns (-3.0% appreciation + 3.0% rent growth), your $7k cash investment doubles in ~2 years — after that, you're playing with house money.
Negotiation context
- Only 3 days on market — expect competitive offers; lowballing is unlikely to land.
- Current owner paid $15k; list at $25k implies a 67% gain — meaningful room to come down on a strong offer.
Risks & watch-outs
- Watch-outs: built in 1950 — expect roof / HVAC / electrical / plumbing capex.
- Climate carrying-cost: extreme-heat days projected 7→16/yr by 2055 (HVAC capex compounding) — expect insurance premiums to compound above CPI over the hold.
Questions for the listing agent
- Built in 1950 — when were the roof, HVAC, electrical panel, plumbing, and water heater last replaced?
- Is there a deadline driving the sale (1031 exchange, divorce, estate, relocation)? That informs how much negotiation room exists.
- Schools are D-rated, which usually means shorter tenancies and higher turnover. Who's the typical renter profile here, and what's been the actual vacancy rate?
- Crime grade is D in this area — have there been break-ins, vandalism, or insurance claims at this property in the last 3 years? What carrier currently insures it and at what premium?
- What's the average days-on-market for RENTAL listings here right now (not sales)? A rising rental-DOM trend means longer vacancies and softer asking-rent achievability than the comps imply.
- What's the recent tenant-quality profile in this submarket — average credit score on applications, eviction rate, late-payment / NSF rate, and stable-employment percentage? A property-management company in the area should have these aggregated.
- How much new for-sale + rental construction is in the pipeline within 1–3 miles? Heavy new supply typically softens prices + rents 12–24 months out; constrained supply supports both.
Investment metrics
- 1% rule
- 3.78% ✓
- Cap rate
- 34.67%
- Cash-on-cash
- 101.34%
- DSCR
- 5.51
- GRM
- 2.2
CMA / ARV
- ARV (on-the-fly)
- $98,696
- Comps found
- 3
Show comp detail 3 sales within ~0.75 mi
| Address | Dist | Beds/Ba | Sqft | Sold | Price | $/sf | Match |
|---|---|---|---|---|---|---|---|
| 221 Hill St | 0.70mi | 2/1.0 | 684 (+1%) | 1mo | $107,500 | $157 | 64 |
| 115 Peachtree St St | 0.46mi | 2/1.0 | 720 (+6%) | 10mo | $105,000 | $146 | 60 |
| 611 Marion Ave | 0.54mi | 2/1.0 | 726 (+7%) | 20mo | $29,900 | $41 | 46 |
Match score weights: distance 35% · size 25% · config 20% · recency 20%. Top-matched comps best support the ARV.
Projected returns pro-forma
-3.0% appreciation · 3.0% rent growth · sell at horizon
- IRR
- —
- Equity multiple
- 5.80×
- Total profit
- $33,603
- Equity at exit
- $3,728
- IRR
- —
- Equity multiple
- 12.11×
- Total profit
- $77,756
- Equity at exit
- $2,162
Cash invested: $7,000 (down + closing). Projections, not guarantees.
Landlord ↔ Tenant lean methodology
- Overall (STATE)
- 90 Strongly Landlord-Friendly
- State South Carolina
- 90 Strongly Landlord-Friendly · R+6
- County
- — inherits STATE
- City
- — inherits STATE
ZIP-level market 29341
- Home prices YoY
- -24.1%
- Active inventory
- 196
- Price-to-rent
- 2.2×
Monthly cashflow live
- Estimated rent
- $945 medium interval (Pro) →
- Mortgage (P&I)
- −$131
- Tax from tax record
- −$14 /mo · $164/yr
- Insurance
- −$10
- HOA
- −$0
- Vacancy / Maint / Mgmt
- −$198
- Net cashflow
- $591
Break-even live
UW: 25.0% down · 7.5% · 30yr · 1.5% tax · 5.0% vac · 8.0% maint · 8.0% mgmt
Financing live
Cash to close
- Down payment
- $6,250
- Closing costs
- $750
- Reserves months
- —
- Total cash needed
- —
Loan-product check · same deal, 3 products live
Conventional
25% down · 7.5% · 30yr
- Down + closing
- —
- Monthly P&I
- —
- Monthly cashflow
- —
- DSCR
- —
- Eligible?
- —
Personal DTI + credit; lowest rate.
DSCR
20% down · 8.5% · 30yr
- Down + closing
- —
- Monthly P&I
- —
- Monthly cashflow
- —
- DSCR
- —
- Eligible?
- —
No personal income docs; deal must DSCR.
Hard money
10% down · 12.0% · 12mo
- Down + closing
- —
- Monthly P&I
- —
- Monthly cashflow
- —
- DSCR
- —
- Eligible?
- —
Short-term bridge; refi at stabilization.
Rent comps 1 comps
| Address | Beds | Baths | Sqft | Rent | $/sqft | DOM | Units | Dist |
|---|---|---|---|---|---|---|---|---|
| 506 S Oliver St Gaffney, SC | 1.0–2.0 | 1.0 | 900 | $955 | $1.06 | 16d | 5 | 0.37mi |
Listing history 5 events
-
2026-06-17status $25,000 Pending 3 DOM
-
2026-06-16days on market $25,000 Active 3 DOM
-
2026-06-15days on market $25,000 Active 2 DOM
-
2026-06-14remarks 606-char remark
-
2026-06-14$25,000 Active 1 DOM
ⓘ Source: listings_history table (triggers on properties + properties_extension) + one-shot
backfill from property_details.listing_events for pre-trigger history.
Tax reassessment forecast SC · Resets to sale price
- Current annual tax
- $164 · $14/mo
- Projected year-2 tax
- $164 · $14/mo
- Expected delta
- $0/yr ($0/mo · 0.0%)
ⓘ Screening estimate from a state-policy table — verify with the county assessor before closing.
Climate risk First Street
- Flood 1/10 Low FEMA zone X (unshaded) · 0% chance over 30 yrs
- Wildfire 3/10 Moderate
- Heat 6/10 Major 7 d/yr ≥103°F today · 16 d/yr by 30 yrs out
- Wind 2/10 Low 3% chance of damaging wind over 30 yrs
- Air quality 4/10 Moderate 4 unhealthy d/yr today · 4 by 30 yrs out
Nearby sold comps map
Loading sold comps map…
Walkable amenities ~0.75 mi
Loading nearby amenities…
Taxation est. · year 1
- Rental income
- $11,337
- − Mortgage interest
- −$1,400
- − Property taxes
- −$164
- − Insurance
- −$125
- − Repairs & maintenance
- −$907
- − Management
- −$907
- − Depreciation
- −$727
- Taxable income
- $7,106
- Est. tax owed @ 24.0%
- −$1,705
- After-tax cash flow
- $5,388/yr
For passive investors: Depreciation is non-cash, so a rental often shows a tax loss while cash-flowing — sheltering income. Rental losses are passive: they offset passive income freely, and up to $25,000/yr can offset ordinary (W-2) income if you actively participate and your MAGI is under $100k (phasing out to $0 by $150k); unused losses carry forward. On sale, claimed depreciation is recaptured at up to 25%, and gains may owe capital-gains tax (a 1031 exchange can defer both). Figures are a year-1 estimate at your 24.0% rate — not tax advice; consult a CPA.
Schools (NCES district)
- District
- Cherokee 01
- NCES district ID
- 4501500
- Math proficiency
- 29% ▼ -9.00%
- Reading proficiency
- 40% ▼ -2.00%
- Median HH income
- $34,262
- Composite
- 28.39/100
- National rank
- #6768
- State rank
- #47 of 80 in SC
Livability — Gaffney
- Score
- 66/100
- State rank
- #112
- US rank
- #11549
Category grades
Schools grade is shown separately in the Schools card above.
Census & demographics
- Census place
- Gaffney, SC
- County
- Cherokee County · 41,410 people
- City population
- 41,410
- Metro
- Gaffney, SC
- Population (ZIP)
- 20,647
- Household income
- $58,029
- Rent vs Own
- Severe rent burden
- 452.0
Population outlook (Cherokee County) Hauer SSP2
- Today (2025)
- 58,602 people
- By 2030
- 59,336 · +1.3%
- By 2040
- 60,266 · +2.8%
- By 2050
- 60,314 · +2.9%
- By 2075
- 59,276 · +1.2%
- By 2100
- 53,788 · -8.2%
Race, ethnicity, and origin ACS 2023
- Neighborhood character
- Diverse neighborhood (Simpson 0.58)
- Race & ethnicity
- White 59% Black 26% Two or more races 9% Hispanic / Latino 8%
- Hispanic origin (detail)
- Mexican 4% Puerto Rican 1%
- Common ancestry
- Italian 2% Serbian 2% Slovak 2%
- Foreign-born
- 4% · Canada
- Languages at home
- 93% English-only · Spanish 6% Other Indo-European 1%
Political lean MEDSL · Cherokee
- 2024 margin
- Solid R (+51.4) · D 23.9% · R 75.3%
- 2008→2024 swing
- -22.0pp toward R · 2008: -29.3pp · 2024: -51.4pp
- All cycles
- 2024: R+51.4 2020: R+43.8 2016: R+41.7 2012: R+29.3 2008: R+29.3
Not yet ingested
- Civics
- —
Market trends
- HPI YoY
- ▼ -64.62%
- Current HPI
- 203.8038
- Rent YoY
- —
- Metro
- Gaffney, SC
- State GDP YoY
- ▲ 4.51%
- F500 in state
- 2
Industry mix (Fortune 500 HQ in SC)
| Industry | F500 HQs | Revenue |
|---|---|---|
| Packaging | 1 | $7B |
|
||
Price history
+66.7% since first listed4 events — show timeline
- 2026-06-13 Listed $25,000 CANOPYMLS as Distributed by MLS Grid
- 2026-03-26 Price Changed $25,000 CANOPYMLS as Distributed by MLS Grid
- 2026-02-12 Price Changed $35,000 CANOPYMLS as Distributed by MLS Grid
- 2002-12-01 Sold (Public Records) $15,000 Public Records
Property tax history
+7.0%/yrLatest (2025): $164 · -69.1% YoY. Source: county tax records.
Cash-flow waterfall
monthlySold comps — $/sqft
last 12 mo · ≤1 miLoading sold comps…