 Multi-family
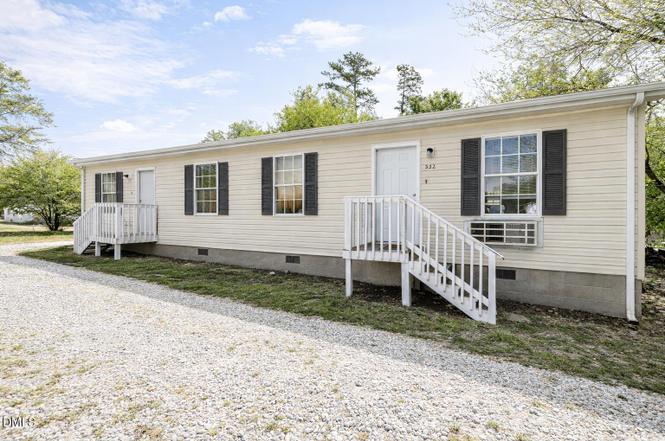
230 Maple Dr Unit 230/232 · Oxford, NC
Flood risk 1/10 · Minimal
- FEMA flood zone
- X (unshaded)
- Chance of flooding over 30 yrs
- 0.0%
- Est. flood insurance / yr
- $507 – $1,088
Fire risk 1/10 · Minimal
- Est. fire insurance / yr
- $906 – $1,684
Heat risk 6/10 · Moderate
- Hot days now (above 104°F)
- 7 days/yr
- Hot days in 30 yrs
- 17 days/yr
Wind risk 6/10 · Moderate
- Chance of severe wind over 30 yrs
- 27.0%
Air-quality risk 1/10 · Minimal
- Unhealthy air days now
- 0 days/yr
- Unhealthy air days in 30 yrs
- 0 days/yr
Risk factors via First Street. Map © Google.
Why this score? — see what drove the B- grade
The composite is a weighted blend of 9 inputs, each scored 0–100. Each bar is that input's sub-score; the figure is the points it added to the 100-point composite (weight × sub-score).
- Cash flow +30.0/30.0
- 1% rule +10.0/10.0
- DSCR +10.0/10.0
- ARV discount +7.5/15.0
- Livability +2.9/5.0
- Schools +2.8/10.0
- Rent growth +2.5/5.0
- Condition / age +2.5/5.0
- Appreciation +0.0/10.0
$179,999
🖨 Deal sheet (PDF) 📄 Offer letter ✓ Due diligence
Multi-family units
County records classify this as Multi-Family (2-4 Unit). Listing-text estimate: 1 unit. estimate disagrees with records
Listing remarks
Rare opportunity to acquire a fully leased, income-producing duplex tucked away on a quiet dead-end street just minutes from downtown Oxford. Recently reduced and strategically priced to sell, this property now offers an attractive 7.80% cap rate, making it a standout option for investors seeking dependable returns with future upside. Conveniently located near shopping, dining, and everyday amenities, the duplex is well positioned for steady, long-term rental performance in a growing market. Each unit features 2 bedrooms and 1 full bath, with both sides currently leased on month-to-month terms--providing immediate cash flow along with flexibility for future rent adjustments. Unit 230 has be
Key facts
- Tenant occupied
- Near shopping dining
- 2 parking spots
Tags
Property features AI
Finance
- Other: Living area reported as 1,296 (owner provided)
- Financial info: Two total units; Owner pays HVAC maintenance, insurance, pest control, and taxes
- HOA & community: No association
Exterior
- Parking: Driveway with 2 open parking spaces
- Utilities: Community water; Community sewer
- Home design: Duplex; One level
- Construction: Vinyl siding; Block foundation; Shingle roof; One building (duplex)
- Exterior features: Publicly maintained road access; Block foundation; Shingle roof
Interior
- Bedrooms: 4 bedrooms (units 230/232 combined total)
- Flooring: Carpet; Vinyl
- Bathrooms: 2 full bathrooms
- Heating & cooling: Ductless heating; Wall furnace; Wall cooling unit(s)
- Interior features: Carpet and vinyl flooring; Ductless heating and wall furnace; Wall-mounted cooling units
Neighborhood map
What this means for you Summary
Snapshot
- This is a 4-bed/2.0-bath multifamily listed at $180k.
Deal economics
- At list price, monthly cash flow is $2k ($19k/yr) — positive.
- The deal already cash-flows at list — no discount required.
- Meets the 1% rule at list price ($4k rent vs $180k).
- Recommended offer: $164k (9.0% below list) — sets the bar for market timing.
- Cap rate 16.8% vs local median 2.7% in Oxford — top-decile yield for the area; either an underpriced asset or a hidden risk that comps aren't pricing in. Stress-test before assuming the spread holds.
Location & tenants
- Location reads 57/100 on livability (#610 in NC) — a working-class tenant base; expect higher turnover. Strengths: cost of living A+, health & safety A+, housing A-; Watch: crime F, amenities F, commute F.
- Granville County Schools (rural): math 28% / reading 36% proficiency, ranked #137 of 178 in NC (top 77%) — families likely to look elsewhere, expect single-tenant / working-renter base with shorter leases.
- Zoned schools: Northern Granville Middle (math 17% / reading 28%, grade F, #410 of 475 statewide, top 87%, 525 students, 82% FRL) — zoned schools average 82% FRL vs 50% district-wide (32 pts higher); higher-poverty schools than district average — tighter screening recommended.
- Market conditions: 257 active listings in the ZIP; 2 comparable units currently listed for rent nearby; 428 units permitted in Granville County in 2024 (120 in 5+ unit buildings).
Forward outlook
- Local home prices are declining (-3.0%/yr); year-one equity from $1k of loan paydown is wiped out by about $5k of value loss. Plan a longer hold.
- At projected returns (-3.0% appreciation + 3.0% rent growth), your $50k cash investment doubles in ~4 years — after that, you're playing with house money.
Negotiation context
- It's been on market 92 days — a 9% lower offer ($164k) is reasonable based on typical stale-listing flexibility.
Risks & watch-outs
- Climate carrying-cost: major wind risk, 27% chance of damaging wind over 30y; extreme-heat days projected 7→17/yr by 2055 (HVAC capex compounding) — expect insurance premiums to compound above CPI over the hold.
Questions for the listing agent
- It's been on market 92 days. Have you received any prior offers? Is the seller open to a 9% concession, seller financing, or rate buy-down credit?
- Why hasn't it sold? Are there any deal-killer items the seller is aware of (foundation, flood, title, zoning, code violations)?
- Is there a deadline driving the sale (1031 exchange, divorce, estate, relocation)? That informs how much negotiation room exists.
- Schools are F-rated, which usually means shorter tenancies and higher turnover. Who's the typical renter profile here, and what's been the actual vacancy rate?
- Crime grade is F in this area — have there been break-ins, vandalism, or insurance claims at this property in the last 3 years? What carrier currently insures it and at what premium?
- What's the average days-on-market for RENTAL listings here right now (not sales)? A rising rental-DOM trend means longer vacancies and softer asking-rent achievability than the comps imply.
- What's the recent tenant-quality profile in this submarket — average credit score on applications, eviction rate, late-payment / NSF rate, and stable-employment percentage? A property-management company in the area should have these aggregated.
- How much new apartment / multifamily construction is in the pipeline within 1–3 miles? Heavy new supply (>2% of stock underway) typically softens rents 12–24 months out; light construction supports rent growth.
Investment metrics
- 1% rule
- 1.99% ✓
- Cap rate
- 16.82%
- Cash-on-cash
- 37.61%
- DSCR
- 2.67
- GRM
- 4.2
CMA / ARV
No comps found within radius.
Projected returns pro-forma
-3.0% appreciation · 3.0% rent growth · sell at horizon
- IRR
- 33.6%
- Equity multiple
- 2.42×
- Total profit
- $71,487
- Equity at exit
- $26,838
- IRR
- 40.5%
- Equity multiple
- 4.81×
- Total profit
- $192,009
- Equity at exit
- $15,563
Cash invested: $50,400 (down + closing). Projections, not guarantees.
Landlord ↔ Tenant lean methodology
- Overall (STATE)
- 85 Strongly Landlord-Friendly
- State North Carolina
- 85 Strongly Landlord-Friendly · R+3
- County
- — inherits STATE
- City
- — inherits STATE
ZIP-level market 27565
- Active inventory
- 257
- Price-to-rent
- 8.4×
Monthly cashflow live
- Estimated rent
- $3,574 medium interval (Pro) →
- Mortgage (P&I)
- −$944
- Tax est. 1.5%
- −$225 /mo · $2,700/yr
- Insurance
- −$75
- HOA
- −$0
- Vacancy / Maint / Mgmt
- −$751
- Net cashflow
- $1,580
Break-even live
Sensitivity live
| Price | -10% $1,704 | -5% $1,642 | +0% $1,580 | +5% $1,517 | +10% $1,455 |
|---|---|---|---|---|---|
| Rent | -10% $1,297 | -5% $1,438 | +0% $1,580 | +5% $1,721 | +10% $1,862 |
| Rate | -1.0pp $1,670 | -0.5pp $1,625 | base $1,580 | +0.5pp $1,533 | +1.0pp $1,485 |
2-unit breakdown (identical units grouped — click to expand)
| Units | Beds | Baths | Est. rent |
|---|---|---|---|
| 2× units | 2 | 1 | $3,574 |
| #1 | 2 | 1 | $1,787 |
| #2 | 2 | 1 | $1,787 |
| Total (2 units) | $3,574 | ||
UW: 25.0% down · 7.5% · 30yr · 1.5% tax · 5.0% vac · 8.0% maint · 8.0% mgmt
Financing live
Cash to close
- Down payment
- $45,000
- Closing costs
- $5,400
- Reserves months
- —
- Total cash needed
- —
Loan-product check · same deal, 3 products live
Conventional
25% down · 7.5% · 30yr
- Down + closing
- —
- Monthly P&I
- —
- Monthly cashflow
- —
- DSCR
- —
- Eligible?
- —
Personal DTI + credit; lowest rate.
DSCR
20% down · 8.5% · 30yr
- Down + closing
- —
- Monthly P&I
- —
- Monthly cashflow
- —
- DSCR
- —
- Eligible?
- —
No personal income docs; deal must DSCR.
Hard money
10% down · 12.0% · 12mo
- Down + closing
- —
- Monthly P&I
- —
- Monthly cashflow
- —
- DSCR
- —
- Eligible?
- —
Short-term bridge; refi at stabilization.
Rent comps 2 comps
| Address | Beds | Baths | Sqft | Rent | $/sqft | DOM | Units | Dist |
|---|---|---|---|---|---|---|---|---|
| 408 Polly Dr Oxford, NC | 3.0 | 2.5 | 1330 | $1,750 | $1.32 | 24d | 1 | 1.19mi |
| 305 Hummingbird Ln Oxford, NC | 1.0–3.0 | 1.0–2.5 | 1103 | $2,125 | $1.93 | 3d | 69 | 1.45mi |
Listing history 5 events
-
2026-05-22status Pending
-
2026-05-02price $179,999
-
2026-04-14price $197,000
-
2026-03-24price $198,900
-
2026-02-18$199,900 Active
ⓘ Source: listings_history table (triggers on properties + properties_extension) + one-shot
backfill from property_details.listing_events for pre-trigger history.
Climate risk First Street
- Flood 1/10 Low FEMA zone X (unshaded) · 0% chance over 30 yrs
- Wildfire 1/10 Low
- Heat 6/10 Major 7 d/yr ≥104°F today · 17 d/yr by 30 yrs out
- Wind 6/10 Major 27% chance of damaging wind over 30 yrs
- Air quality 1/10 Low 0 unhealthy d/yr today · 0 by 30 yrs out
Nearby sold comps map
Loading sold comps map…
Walkable amenities ~0.75 mi
Loading nearby amenities…
Taxation est. · year 1
- Rental income
- $42,888
- − Mortgage interest
- −$10,083
- − Property taxes
- −$2,700
- − Insurance
- −$900
- − Repairs & maintenance
- −$3,431
- − Management
- −$3,431
- − Depreciation
- −$5,236
- Taxable income
- $17,107
- Est. tax owed @ 24.0%
- −$4,106
- After-tax cash flow
- $14,849/yr
For passive investors: Depreciation is non-cash, so a rental often shows a tax loss while cash-flowing — sheltering income. Rental losses are passive: they offset passive income freely, and up to $25,000/yr can offset ordinary (W-2) income if you actively participate and your MAGI is under $100k (phasing out to $0 by $150k); unused losses carry forward. On sale, claimed depreciation is recaptured at up to 25%, and gains may owe capital-gains tax (a 1031 exchange can defer both). Figures are a year-1 estimate at your 24.0% rate — not tax advice; consult a CPA.
Schools (NCES district)
- District
- Granville County Schools
- NCES district ID
- 3701800
- Math proficiency
- 28% ▼ -1.00%
- Reading proficiency
- 36% ▬ 0.00%
- Median HH income
- $49,713
- Composite
- 27.81/100
- National rank
- #6887
- State rank
- #137 of 178 in NC
Livability — Oxford
- Score
- 57/100
- State rank
- #610
- US rank
- #22195
Category grades
Schools grade is shown separately in the Schools card above.
Census & demographics
- Census place
- Oxford, NC
- Population (ZIP)
- 23,658
Population outlook (Granville County) Hauer SSP2
- Today (2025)
- 60,753 people
- By 2030
- 61,381 · +1.0%
- By 2040
- 61,861 · +1.8%
- By 2050
- 61,261 · +0.8%
- By 2075
- 59,948 · -1.3%
- By 2100
- 55,273 · -9.0%
Race, ethnicity, and origin ACS 2023
- Neighborhood character
- Diverse neighborhood (Simpson 0.59)
- Race & ethnicity
- White 50% Black 39% Two or more races 6% Hispanic / Latino 6%
- Hispanic origin (detail)
- Mexican 3%
- Common ancestry
- Slovak 1% Serbian 1% Italian 1%
- Foreign-born
- 3% · Canada
- Languages at home
- 95% English-only · Spanish 4%
Political lean MEDSL · Granville
- 2024 margin
- Lean R (+9.4) · D 44.8% · R 54.2%
- 2008→2024 swing
- -16.0pp toward R · 2008: 6.6pp · 2024: -9.4pp
- All cycles
- 2024: R+9.4 2020: R+6.6 2016: R+2.5 2012: D+4.6 2008: D+6.6
Not yet ingested
- Civics
- —
Market trends
- HPI YoY
- ▼ -114.56%
- Current HPI
- 209.2788
- Rent YoY
- —
- Metro
- —
- State GDP YoY
- ▲ 3.28%
- F500 in state
- 26
Industry mix (Fortune 500 HQ in NC)
| Industry | F500 HQs | Revenue |
|---|---|---|
| Financial Services | 2 | $213B |
|
||
| Retail | 2 | $95B |
|
||
| Industrial Conglomerate | 1 | $38B |
|
||
| Metals / Steel | 1 | $35B |
|
||
| Utilities | 1 | $30B |
|
||
| Industrial Machinery | 1 | $19B |
|
||
Price history
-10.0% since first listed5 events — show timeline
- 2026-05-22 Pending — TMLS
- 2026-05-02 Price Changed $179,999 TMLS
- 2026-04-14 Price Changed $197,000 TMLS
- 2026-03-24 Price Changed $198,900 TMLS
- 2026-02-18 Listed $199,900 TMLS
Cash-flow waterfall
monthlySold comps — $/sqft
last 12 mo · ≤1 miLoading sold comps…