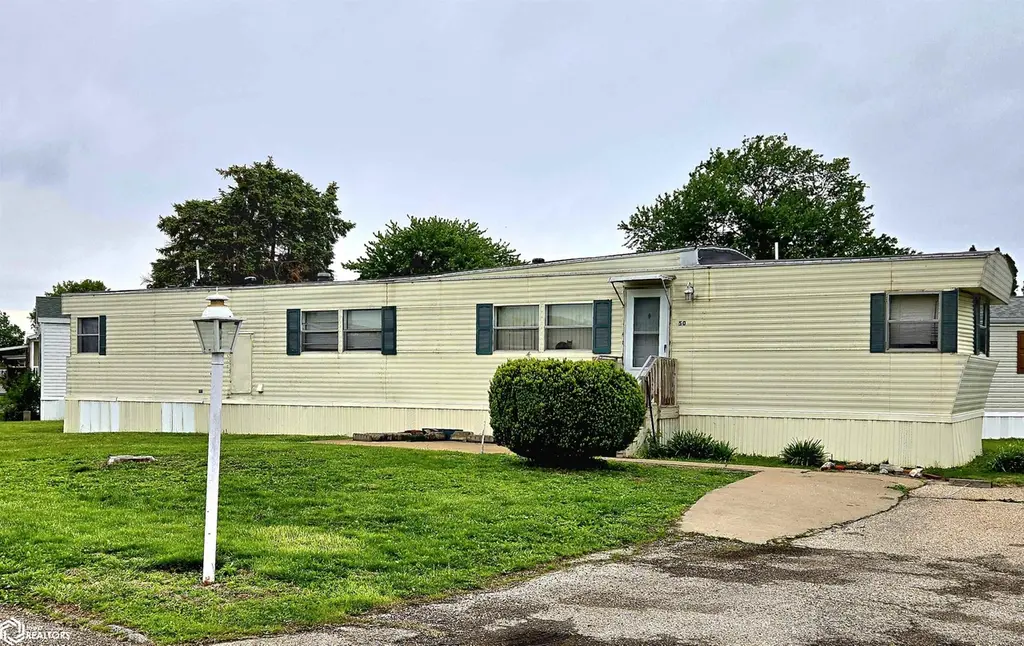
509 W Agency Rd #50 · West Burlington, IA
Flood risk 1/10 · Minimal
- FEMA flood zone
- X (unshaded)
- Chance of flooding over 30 yrs
- 0.0%
- Est. flood insurance / yr
- $507 – $1,088
Fire risk 2/10 · Minimal
- Est. fire insurance / yr
- $902 – $1,676
Heat risk 3/10 · Minor
- Hot days now (above 105°F)
- 7 days/yr
- Hot days in 30 yrs
- 16 days/yr
Wind risk 2/10 · Minimal
- Chance of severe wind over 30 yrs
- —
Air-quality risk 2/10 · Minimal
- Unhealthy air days now
- 1 days/yr
- Unhealthy air days in 30 yrs
- 2 days/yr
Risk factors via First Street. Map © Google.
Why this score? — see what drove the D+ grade
The composite is a weighted blend of 9 inputs, each scored 0–100. Each bar is that input's sub-score; the figure is the points it added to the 100-point composite (weight × sub-score).
- Cash flow +15.0/30.0
- ARV discount +7.5/15.0
- 1% rule +5.0/10.0
- DSCR +5.0/10.0
- Livability +4.1/5.0
- Schools +4.0/10.0
- Rent growth +2.5/5.0
- Condition / age +2.5/5.0
- Appreciation +0.0/10.0
$14,000
🖨 Deal sheet (PDF) 📄 Offer letter ✓ Due diligence
Listing remarks
2 bedroom 2 bath 1984 Windsor Mobile home sitting on a great lot in Western Pines Mobile Home Park. Open floor plan with primary bedroom & full bath on one end and 2nd bedroom on the other. Spacious kitchen has main level laundry and wonderful storage space as well. Backyard has storage shed sitting on a cement slab for your garden tools. Parking in front for 2 vehicles and a front patio. * These are Manufactured Homes & do not include Real Estate ground underneath the property. There are lease restrictions for the land these units are on. Contact the listing agent for details and any additional disclosures. Lot Rent is $450/month & includes trash pickup & shared tax
Key facts
- Built 1984
- Listed 37 days
Property features AI
Finance
- Other: Located in Burlington subdivision; directions: Western Pines Park off of Agency Rd across from Menards
- HOA & community: Homeowners association with a $450 monthly fee; HOA fee includes trash service
Exterior
- Parking: Outdoor parking on gravel
- Utilities: Public water; Public sewer
- Home design: Residential mobile home
- Construction: Metal siding construction
- Exterior features: Located in a manufactured home community (manufactured homes do not include the underlying real estate); Metal siding
Interior
- Bathrooms: Two full bathrooms
- Heating & cooling: Central air; Forced air heating
- Interior features: Central air conditioning; Forced air heating
Neighborhood map
What this means for you Summary
Snapshot
- This is a 2-bed/2.0-bath manufactured listed at $14k.
Deal economics
- At list price, monthly cash flow is $134 ($2k/yr) — positive.
- The deal already cash-flows at list — no discount required.
- Meets the 1% rule at list price ($861 rent vs $14k).
- Recommended offer: $14k (3.0% below list) — sets the bar for market timing.
Location & tenants
- Location reads 82/100 on livability (#47 in IA, #1,179 nationally) — a professional / high-income tenant draw. Strengths: commute A+, cost of living A+, housing A+; Watch: employment C-, crime D-, amenities F.
- Burlington Community School District (town): math 42% / reading 54% proficiency, ranked #286 of 289 in IA (top 99%) — families likely to look elsewhere, expect single-tenant / working-renter base with shorter leases.
- Market conditions: 22 active listings in the ZIP; 3 comparable units currently listed for rent nearby; rentals lingering (median 44d on market — plan ~5-8 weeks vacancy on turnover, expect pricing pressure); 100% of comp listings sitting > 30 days — soft ceiling on asking rent; 53 units permitted in Des Moines County in 2024 (40 in 5+ unit buildings).
Forward outlook
- Local home prices are declining (-3.0%/yr); year-one equity from $97 of loan paydown is wiped out by about $420 of value loss. Plan a longer hold.
- Des Moines County population projected to shrink 6% by 2050 — rents likely to lag national; underwrite the cash flow, not the appreciation.
- At projected returns (-3.0% appreciation + 3.0% rent growth), your $4k cash investment doubles in ~3 years — after that, you're playing with house money.
Negotiation context
- It's been on market 37 days — a 3% lower offer ($14k) is reasonable based on typical stale-listing flexibility.
Risks & watch-outs
- Watch-outs: HOA is 52% of rent.
Questions for the listing agent
- It's been on market 37 days. Have you received any prior offers? Is the seller open to a 3% concession, seller financing, or rate buy-down credit?
- What does the HOA fee cover, when was the last increase, and are there any pending special assessments or reserve-fund shortfalls?
- Is there a deadline driving the sale (1031 exchange, divorce, estate, relocation)? That informs how much negotiation room exists.
- Schools are B-rated — typically a magnet for longer-tenancy family renters. What's the average tenant stay here, and is there a school-zone premium baked into asking?
- Crime grade is D in this area — have there been break-ins, vandalism, or insurance claims at this property in the last 3 years? What carrier currently insures it and at what premium?
- The area grade is low — what's the realistic commute time and amenity access for the typical tenant pool here? Any planned neighborhood developments (good or bad) we should know about?
- What's the average days-on-market for RENTAL listings here right now (not sales)? A rising rental-DOM trend means longer vacancies and softer asking-rent achievability than the comps imply.
- What's the recent tenant-quality profile in this submarket — average credit score on applications, eviction rate, late-payment / NSF rate, and stable-employment percentage? A property-management company in the area should have these aggregated.
- How much new for-sale + rental construction is in the pipeline within 1–3 miles? Heavy new supply typically softens prices + rents 12–24 months out; constrained supply supports both.
Investment metrics
- 1% rule
- 6.15% ✓
- Cap rate
- 17.74%
- Cash-on-cash
- 40.90%
- DSCR
- 2.82
- GRM
- 1.4
CMA / ARV
No comps found within radius.
Projected returns pro-forma
-3.0% appreciation · 3.0% rent growth · sell at horizon
- IRR
- 38.5%
- Equity multiple
- 2.67×
- Total profit
- $6,530
- Equity at exit
- $2,087
- IRR
- 45.4%
- Equity multiple
- 5.55×
- Total profit
- $17,819
- Equity at exit
- $1,210
Cash invested: $3,920 (down + closing). Projections, not guarantees.
Landlord ↔ Tenant lean methodology
- Overall (STATE)
- 83 Strongly Landlord-Friendly
- State Iowa
- 83 Strongly Landlord-Friendly · R+6
- County
- — inherits STATE
- City
- — inherits STATE
ZIP-level market 52655
- Home prices YoY
- -5.7%
- Active inventory
- 22
- Price-to-rent
- 1.4×
Monthly cashflow live
- Estimated rent
- $861 medium interval (Pro) →
- Mortgage (P&I)
- −$73
- Tax est. 1.5%
- −$18 /mo · $210/yr
- Insurance
- −$6
- HOA
- −$450
- Vacancy / Maint / Mgmt
- −$181
- Net cashflow
- $134
Break-even live
Sensitivity live
| Price | -10% $143 | -5% $138 | +0% $134 | +5% $129 | +10% $124 |
|---|---|---|---|---|---|
| Rent | -10% $66 | -5% $100 | +0% $134 | +5% $168 | +10% $202 |
| Rate | -1.0pp $141 | -0.5pp $137 | base $134 | +0.5pp $130 | +1.0pp $126 |
UW: 25.0% down · 7.5% · 30yr · 1.5% tax · 5.0% vac · 8.0% maint · 8.0% mgmt
Financing live
Cash to close
- Down payment
- $3,500
- Closing costs
- $420
- Reserves months
- —
- Total cash needed
- —
Loan-product check · same deal, 3 products live
Conventional
25% down · 7.5% · 30yr
- Down + closing
- —
- Monthly P&I
- —
- Monthly cashflow
- —
- DSCR
- —
- Eligible?
- —
Personal DTI + credit; lowest rate.
DSCR
20% down · 8.5% · 30yr
- Down + closing
- —
- Monthly P&I
- —
- Monthly cashflow
- —
- DSCR
- —
- Eligible?
- —
No personal income docs; deal must DSCR.
Hard money
10% down · 12.0% · 12mo
- Down + closing
- —
- Monthly P&I
- —
- Monthly cashflow
- —
- DSCR
- —
- Eligible?
- —
Short-term bridge; refi at stabilization.
Rent comps 3 comps
| Address | Beds | Baths | Sqft | Rent | $/sqft | DOM | Units | Dist |
|---|---|---|---|---|---|---|---|---|
| 4051 West Ave Burlington, IA | 1.0–2.0 | 1.0 | 723 | $1,060 | $1.47 | 44d | 2 | 0.92mi |
| 2911 Market St Unit 2909 Burlington, IA | 2.0 | 1.0 | 720 | $625 | $0.87 | 44d | 1 | 1.25mi |
| 2645 Newbury Cir Burlington, IA | 2.0 | 1.0 | 825 | $825 | $1.00 | 44d | 3 | 1.41mi |
HOA detail
- Monthly dues
- $450 · $5,400/yr
- Likely covers
- trash
Listing history 12 events
-
2026-06-14days on market $14,000 Active 37 DOM
-
2026-06-12days on market $14,000 Active 36 DOM
-
2026-06-09days on market $14,000 Active 33 DOM
-
2026-06-08days on market $14,000 Active 32 DOM
-
2026-06-07days on market $14,000 Active 31 DOM
-
2026-06-07days on market $14,000 Active 30 DOM
-
2026-06-03days on market $14,000 Active 27 DOM
-
2026-06-02days on market $14,000 Active 26 DOM
-
2026-06-01days on market $14,000 Active 25 DOM
-
2026-05-31days on market $14,000 Active 24 DOM
-
2026-05-30days on market $14,000 Active 23 DOM
-
2026-05-07$14,000 Active 968-char remark
ⓘ Source: listings_history table (triggers on properties + properties_extension) + one-shot
backfill from property_details.listing_events for pre-trigger history.
Climate risk First Street
- Flood 1/10 Low FEMA zone X (unshaded) · 0% chance over 30 yrs
- Wildfire 2/10 Low
- Heat 3/10 Moderate 7 d/yr ≥105°F today · 16 d/yr by 30 yrs out
- Wind 2/10 Low
- Air quality 2/10 Low 1 unhealthy d/yr today · 2 by 30 yrs out
Nearby sold comps map
Loading sold comps map…
Walkable amenities ~0.75 mi
Loading nearby amenities…
Taxation est. · year 1
- Rental income
- $10,334
- − Mortgage interest
- −$784
- − Property taxes
- −$210
- − Insurance
- −$70
- − Repairs & maintenance
- −$827
- − Management
- −$827
- − HOA
- −$5,400
- − Depreciation
- −$407
- Taxable income
- $1,809
- Est. tax owed @ 24.0%
- −$434
- After-tax cash flow
- $1,169/yr
For passive investors: Depreciation is non-cash, so a rental often shows a tax loss while cash-flowing — sheltering income. Rental losses are passive: they offset passive income freely, and up to $25,000/yr can offset ordinary (W-2) income if you actively participate and your MAGI is under $100k (phasing out to $0 by $150k); unused losses carry forward. On sale, claimed depreciation is recaptured at up to 25%, and gains may owe capital-gains tax (a 1031 exchange can defer both). Figures are a year-1 estimate at your 24.0% rate — not tax advice; consult a CPA.
Schools (NCES district)
- District
- Burlington Community School District
- NCES district ID
- 1905790
- Math proficiency
- 42% ▼ -4.00%
- Reading proficiency
- 54% ▼ -1.00%
- Median HH income
- $41,833
- Composite
- 40.3/100
- National rank
- #3753
- State rank
- #286 of 289 in IA
Livability — West Burlington
- Score
- 82/100
- State rank
- #47
- US rank
- #1179
Category grades
Schools grade is shown separately in the Schools card above.
Census & demographics
- Census place
- West Burlington, IA
- Population (ZIP)
- 4,300
Population outlook (Des Moines County) Hauer SSP2
- Today (2025)
- 39,735 people
- By 2030
- 39,257 · -1.2%
- By 2040
- 38,090 · -4.1%
- By 2050
- 37,156 · -6.5%
- By 2075
- 36,905 · -7.1%
- By 2100
- 37,222 · -6.3%
Race, ethnicity, and origin ACS 2023
- Neighborhood character
- Predominantly White (86%)
- Race & ethnicity
- White 86% Two or more races 6% Black 5% Hispanic / Latino 3%
- Common ancestry
- Portuguese 4% Italian 2% Iranian 2%
- Foreign-born
- 2% · Canada
- Languages at home
- 98% English-only · Spanish 1%
Political lean MEDSL · Des Moines
- 2024 margin
- R (+15.1) · D 41.8% · R 56.8% · Other 1.4%
- 2008→2024 swing
- -38.1pp toward R · 2008: 23.0pp · 2024: -15.1pp
- All cycles
- 2024: R+15.1 2020: R+8.5 2016: R+7.0 2012: D+18.5 2008: D+23.0
Not yet ingested
- Civics
- —
Market trends
- HPI YoY
- ▼ -12.25%
- Current HPI
- 201.4077
- Rent YoY
- —
- Metro
- —
- State GDP YoY
- ▲ 2.48%
- F500 in state
- 4
Industry mix (Fortune 500 HQ in IA)
| Industry | F500 HQs | Revenue |
|---|---|---|
| Financial Services | 1 | $16B |
|
||
| Retail / Convenience | 1 | $15B |
|
||
Price history
1 event — show timeline
- 2026-05-07 Listed $14,000 IAR
Cash-flow waterfall
monthlySold comps — $/sqft
last 12 mo · ≤1 miLoading sold comps…