8940 Colonnades Ct E #731 · Bonita Springs, FL
Flood risk 6/10 · Moderate
- FEMA flood zone
- X (shaded)
- Chance of flooding over 30 yrs
- 0.54%
- Est. flood insurance / yr
- $507 – $1,088
Fire risk 1/10 · Minimal
- Est. fire insurance / yr
- $947 – $1,759
Heat risk 10/10 · Severe
- Hot days now (above 107°F)
- 7 days/yr
- Hot days in 30 yrs
- 31 days/yr
Wind risk 10/10 · Severe
- Chance of severe wind over 30 yrs
- 99.0%
Air-quality risk 3/10 · Minor
- Unhealthy air days now
- 2 days/yr
- Unhealthy air days in 30 yrs
- 2 days/yr
Risk factors via First Street. Map © Google.
Why this score? — see what drove the D- grade
The composite is a weighted blend of 9 inputs, each scored 0–100. Each bar is that input's sub-score; the figure is the points it added to the 100-point composite (weight × sub-score).
- Cash flow +8.4/30.0
- ARV discount +7.5/15.0
- 1% rule +4.7/10.0
- Schools +4.1/10.0
- Livability +3.5/5.0
- Condition / age +2.5/5.0
- DSCR +2.3/10.0
- Rent growth +2.3/5.0
- Appreciation +0.0/10.0
$268,000
🖨 Deal sheet (PDF) 📄 Offer letter ✓ Due diligence
Listing remarks MLS
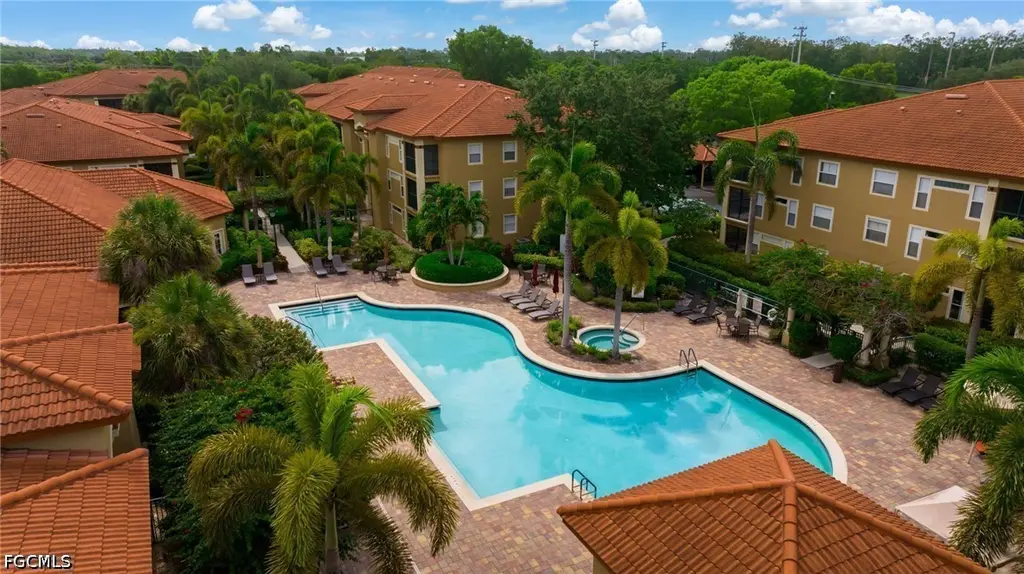
IMMACULATE, beautifully upgraded 3rd-floor CORNER unit w/ screened balcony & lots of natural light in the lovely gated, pet-friendly, people-friendly community of San Mirage at Bonita Springs! CARPORT INCLUDED! This meticulously maintained, freshly painted Trieste model features 2 spacious Bedrooms--each with its own full Bath & walk-in closet. Exquisitely remodeled w/ NEW cabinets, lighting, fans, faucets & hardware. Upgrades include wainscoting & large neutral tile on diagonal. New A/C; New stainless steel appliances 2018. Newer water heater. Full-sized Washer & Dryer conveniently located off the Kitchen. San Mirage offers a GORGEOUS heated, saltwater pool, spa, cabanas, bar area w/ wifi, fitness room, clubhouse & tennis courts for your enjoyment. Quarterly HOA fee of $1016 includes cable & water. All this IDEALLY LOCATED minutes from world-class shopping at Coconut Point & Miromar Outlets, healthcare, dining & entertainment. Short trip to Southwest Florida internat'l Airport & 6 sugar-sand beaches! This is the ONLY unit for sale in San Mirage that offers a carport (#102)+your assigned space right in front of the condo. Similar units rent for $1300/mo annually; $2600/mo seasonally.
Key facts
- Gated community
- Open floor plan
- Reserved carport
Tags
Property features AI
Finance
- Other: Community of 10 units
- Financial info: Pets allowed: case-by-case/conditional
- HOA & community: Homeowners association with quarterly fee; Association fee covers management, cable TV, insurance, irrigation water, grounds maintenance, pest control, recreation facilities, road maintenance and street lights; Community amenities include bike storage, cabana, fitness center, pool, spa/hot tub, vehicle wash area and management
Exterior
- Parking: Detached carport; 1 covered space / 1-car carport
- Security: Gated community
- Utilities: Public water; Public sewer; Cable available; High speed internet available
- Home design: 3 stories; Entry level: 3; Resale property; Faces north
- Construction: Built with block, concrete and stucco; Tile roof
- Exterior features: Balcony; Screened porch; South exposure; Private road frontage
Interior
- Kitchen: Dishwasher; Electric cooktop; Range; Microwave; Disposal; Refrigerator; Pantry; Breakfast bar
- Bedrooms: Multiple primary suites
- Flooring: Carpet; Tile
- Bathrooms: 2 full bathrooms
- Heating & cooling: Central heating (electric); Central air conditioning (electric)
- Interior features: Furnished; Breakfast bar; Entrance foyer; Living/dining room; Multiple primary suites; Pantry; Tub/shower; Cable TV; Walk-in closet(s); Window treatments; Split bedrooms; Single hung, sliding and transom windows
- Laundry & utility: Washer and dryer included; Inside laundry
Neighborhood map
What this means for you Summary
Snapshot
- This is a 2-bed/2.0-bath condo listed at $268k.
Deal economics
- At list price, monthly cash flow is $-240 ($-3k/yr) — negative.
- To cash-flow at today's rent, offer at most $226k (15.8% below list).
- To meet the 1% rule (rent ≥ 1% of price), the offer needs to be $259k (3.2% below list).
- Recommended offer: $226k (15.8% below list) — sets the bar for cash-flow.
- Cap rate 5.2% vs local median 1.7% in Bonita Springs — top-decile yield for the area; either an underpriced asset or a hidden risk that comps aren't pricing in. Stress-test before assuming the spread holds.
Location & tenants
- Location reads 70/100 on livability (#428 in FL) — a middle-class / working-renter tenant base. Strengths: crime A+, housing A+, employment A; Watch: cost of living C-, health & safety D, amenities F.
- Lee (suburban): math 47% / reading 50% proficiency, ranked #42 of 73 in FL (top 58%) — families likely to look elsewhere, expect single-tenant / working-renter base with shorter leases.
- Zoned schools: Pinewoods Elementary School (math 81% / reading 74%, grade A, #163 of 2,144 statewide, top 8%, 1,089 students, 25% FRL); Lexington Middle School (math 55% / reading 54%, grade B-, #183 of 571 statewide, top 34%, 1,138 students, 44% FRL); South Fort Myers High School (math 23% / reading 30%, grade F, #489 of 667 statewide, top 74%, 1,917 students, 50% FRL) — zoned schools average 39% FRL vs 57% district-wide (18 pts lower); this property's tenant base skews higher-income than the district average.
- Market conditions: Rents soft (-0.6%/yr); 843 active listings in the ZIP; 15 comparable units currently listed for rent nearby; rentals at typical pace (median 18d on market — plan ~3-4 weeks tenant-placement turnaround); solid renter incomes; 15,411 units permitted in Lee County in 2024 (4,686 in 5+ unit buildings).
- This rent runs 34% of the median local income ($91k/yr) — at the standard rent-burdened threshold; future hikes will face affordability resistance.
Forward outlook
- Local home prices are declining (-3.0%/yr); year-one equity from $2k of loan paydown is wiped out by about $8k of value loss. Plan a longer hold.
- Lee County population projected at +44% by 2050 — long-run rental-demand tailwind backs the buy-and-hold thesis.
Negotiation context
- Only 9 days on market — expect competitive offers; lowballing is unlikely to land.
- 4 sale attempts since 17y ago with the ask held roughly flat each time — persistent listings suggest the price (not the market) is what's stuck; bring a comps-based counter.
- Current owner paid $182k; 47% above their basis — modest negotiation headroom, anchor on the comps not their cost.
Risks & watch-outs
- Watch-outs: HOA is 21% of rent.
- Climate carrying-cost: major flood risk; severe wind risk, 99% chance of damaging wind over 30y; extreme-heat days projected 7→31/yr by 2055 (HVAC capex compounding) — expect insurance premiums to compound above CPI over the hold.
Questions for the listing agent
- What do current leases actually rent for vs. the listed asking? Can we see a recent rent roll and the last 12 months of T-12 income?
- What does the HOA fee cover, when was the last increase, and are there any pending special assessments or reserve-fund shortfalls?
- Any open or pending special assessments — roof, HVAC, plumbing, elevator, façade? What's the per-unit balance and payoff schedule, and is the seller paying it off at close or rolling it to the buyer?
- Is there a deadline driving the sale (1031 exchange, divorce, estate, relocation)? That informs how much negotiation room exists.
- The area grade is low — what's the realistic commute time and amenity access for the typical tenant pool here? Any planned neighborhood developments (good or bad) we should know about?
- What's the average days-on-market for RENTAL listings here right now (not sales)? A rising rental-DOM trend means longer vacancies and softer asking-rent achievability than the comps imply.
- What's the recent tenant-quality profile in this submarket — average credit score on applications, eviction rate, late-payment / NSF rate, and stable-employment percentage? A property-management company in the area should have these aggregated.
- How much new apartment / multifamily construction is in the pipeline within 1–3 miles? Heavy new supply (>2% of stock underway) typically softens rents 12–24 months out; light construction supports rent growth.
Investment metrics
- 1% rule
- 0.97% ✗
- Cap rate
- 5.22%
- Cash-on-cash
- -3.84%
- DSCR
- 0.83
- GRM
- 8.6
CMA / ARV
No comps found within radius.
Projected returns pro-forma
-3.0% appreciation · 0.0% rent growth · sell at horizon
- IRR
- -27.0%
- Equity multiple
- 0.12×
- Total profit
- $-66,024
- Equity at exit
- $39,960
- IRR
- -46.2%
- Equity multiple
- -0.40×
- Total profit
- $-105,321
- Equity at exit
- $23,172
Cash invested: $75,040 (down + closing). Projections, not guarantees.
Landlord ↔ Tenant lean methodology
- Overall (STATE)
- 87 Strongly Landlord-Friendly
- State Florida
- 87 Strongly Landlord-Friendly · R+3
- County
- — inherits STATE
- City
- — inherits STATE
ZIP-level market 34135
- Rents YoY
- -0.6%
- Active inventory
- 843
- Price-to-rent
- 8.6×
Monthly cashflow live
- Estimated rent
- $2,593 high interval (Pro) →
- Mortgage (P&I)
- −$1,405
- Tax from tax record
- −$239 /mo · $2,868/yr
- Insurance
- −$112
- HOA
- −$533
- Vacancy / Maint / Mgmt
- −$545
- Net cashflow
- $-240
Break-even live
Sensitivity live
| Price | -10% $-89 | -5% $-164 | +0% $-240 | +5% $-316 | +10% $-392 |
|---|---|---|---|---|---|
| Rent | -10% $-445 | -5% $-343 | +0% $-240 | +5% $-138 | +10% $-35 |
| Rate | -1.0pp $-105 | -0.5pp $-172 | base $-240 | +0.5pp $-310 | +1.0pp $-380 |
UW: 25.0% down · 7.5% · 30yr · 1.5% tax · 5.0% vac · 8.0% maint · 8.0% mgmt
Financing live
Cash to close
- Down payment
- $67,000
- Closing costs
- $8,040
- Reserves months
- —
- Total cash needed
- —
Loan-product check · same deal, 3 products live
Conventional
25% down · 7.5% · 30yr
- Down + closing
- —
- Monthly P&I
- —
- Monthly cashflow
- —
- DSCR
- —
- Eligible?
- —
Personal DTI + credit; lowest rate.
DSCR
20% down · 8.5% · 30yr
- Down + closing
- —
- Monthly P&I
- —
- Monthly cashflow
- —
- DSCR
- —
- Eligible?
- —
No personal income docs; deal must DSCR.
Hard money
10% down · 12.0% · 12mo
- Down + closing
- —
- Monthly P&I
- —
- Monthly cashflow
- —
- DSCR
- —
- Eligible?
- —
Short-term bridge; refi at stabilization.
Rent comps 15 comps
| Address | Beds | Baths | Sqft | Rent | $/sqft | DOM | Units | Dist |
|---|---|---|---|---|---|---|---|---|
| 8930 Colonnades Ct E #625 Bonita Springs, FL | 2.0 | 2.0 | 1013 | $3,000 | $2.96 | 12d | 1 | 0.03mi |
| 8940 Colonnades Ct E Bonita Springs, FL | 2.0 | 2.0 | 1013 | $2,675 | $2.64 | 25d | 2 | 0.03mi |
| 8940 Colonnades Ct E Bonita Springs, FL | 2.0 | 2.0 | 1013 | $2,575 | $2.54 | 12d | 3 | 0.03mi |
| 8930 Colonnades Ct E Bonita Springs, FL | 2.0 | 2.0 | 1013 | $2,325 | $2.30 | 17d | 2 | 0.04mi |
| 8920 Colonnades Ct E #514 Bonita Springs, FL | 1.0 | 1.0 | 713 | $1,500 | $2.10 | 25d | 1 | 0.06mi |
| 8870 Colonnades Ct W #337 Bonita Springs, FL | 2.0 | 2.0 | 997 | $3,100 | $3.11 | 5d | 1 | 0.12mi |
| 25480 Cockleshell Dr #1005 Bonita Springs, FL | 2.0 | 2.5 | 1119 | $4,600 | $4.11 | 25d | 1 | 1.03mi |
| 10041 Maddox Ln #203 Bonita Springs, FL | 3.0 | 2.0 | 1083 | $5,000 | $4.62 | 25d | 1 | 1.04mi |
| 25806 Cockleshell Dr #314 Bonita Springs, FL | 2.0 | 2.0 | 975 | $1,800 | $1.85 | 25d | 1 | 1.19mi |
| 9200 Highland Woods Blvd Bonita Springs, FL | 2.0 | 2.0 | 1083 | $4,050 | $3.74 | 17d | 3 | 1.24mi |
| 9250 Highland Woods Blvd #2308 Bonita Springs, FL | 2.0 | 2.0 | 1100 | $1,995 | $1.81 | 5d | 1 | 1.25mi |
| 9250 Highland Woods Blvd #2308 Bonita Springs, FL | 2.0 | 2.0 | 1100 | $1,995 | $1.81 | 25d | 1 | 1.25mi |
| 10325 Tarrah Ln Unit 1073517P Bonita Springs, FL | 2.0 | 1.0 | 818 | $4,608 | $5.63 | 4d | 1 | 1.36mi |
| 10101 Sandy Hollow Ln #102 Bonita Springs, FL | 2.0 | 2.5 | 808 | $1,645 | $2.04 | 25d | 1 | 1.41mi |
| 9450 Highland Woods Blvd #6203 Bonita Springs, FL | 2.0 | 2.0 | 1100 | $6,000 | $5.45 | 16d | 1 | 1.49mi |
HOA detail condo
- Monthly dues
- $533 · $6,396/yr
- Likely covers
- waterinternetcablepoolsecurity
- Assessments
- None detected in remarks — confirm with the listing agent.
Listing history 7 events
-
2026-06-22days on market $268,000 Active 9 DOM
-
2026-06-18days on market $268,000 Active 6 DOM
-
2026-06-17days on market $268,000 Active 5 DOM
-
2026-06-16days on market $268,000 Active 4 DOM
-
2026-06-15days on market $268,000 Active 3 DOM
-
2026-06-13remarks 699-char remark
-
2026-06-13$268,000 Active 1 DOM
ⓘ Source: listings_history table (triggers on properties + properties_extension) + one-shot
backfill from property_details.listing_events for pre-trigger history.
Tax reassessment forecast FL · Resets to sale price
- Current annual tax
- $2,868 · $239/mo
- Projected year-2 tax
- $2,868 · $239/mo
- Expected delta
- $0/yr ($0/mo · 0.0%)
ⓘ Screening estimate from a state-policy table — verify with the county assessor before closing.
Climate risk First Street
- Flood 6/10 Major FEMA zone X (shaded) · 54% chance over 30 yrs
- Wildfire 1/10 Low
- Heat 10/10 Extreme 7 d/yr ≥107°F today · 31 d/yr by 30 yrs out
- Wind 10/10 Extreme 99% chance of damaging wind over 30 yrs
- Air quality 3/10 Moderate 2 unhealthy d/yr today · 2 by 30 yrs out
Nearby sold comps map
Loading sold comps map…
Walkable amenities ~0.75 mi
Loading nearby amenities…
Taxation est. · year 1
- Rental income
- $31,121
- − Mortgage interest
- −$15,012
- − Property taxes
- −$2,868
- − Insurance
- −$1,340
- − Repairs & maintenance
- −$2,490
- − Management
- −$2,490
- − HOA
- −$6,396
- − Depreciation
- −$7,796
- Taxable loss
- −$7,271
- Est. tax savings @ 24.0%
- +$1,745
- After-tax cash flow
- $-1,138/yr
For passive investors: Depreciation is non-cash, so a rental often shows a tax loss while cash-flowing — sheltering income. Rental losses are passive: they offset passive income freely, and up to $25,000/yr can offset ordinary (W-2) income if you actively participate and your MAGI is under $100k (phasing out to $0 by $150k); unused losses carry forward. On sale, claimed depreciation is recaptured at up to 25%, and gains may owe capital-gains tax (a 1031 exchange can defer both). Figures are a year-1 estimate at your 24.0% rate — not tax advice; consult a CPA.
Schools (NCES district)
- District
- Lee
- NCES district ID
- 1201080
- Math proficiency
- 47% ▼ -11.00%
- Reading proficiency
- 50% ▼ -4.00%
- Median HH income
- $49,518
- Composite
- 41.49/100
- National rank
- #3458
- State rank
- #42 of 73 in FL
Livability — Bonita Springs
- Score
- 70/100
- State rank
- #428
- US rank
- #7576
Category grades
Schools grade is shown separately in the Schools card above.
Census & demographics
- Census place
- Bonita Springs, FL
- County
- Lee County · 788,662 people
- City population
- 64,727
- Metro
- Cape Coral-Fort Myers, FL
- Population (ZIP)
- 48,252
- Household income
- $91,380
- Rent vs Own
- Severe rent burden
- 976.0
Population outlook (Lee County) Hauer SSP2
- Today (2025)
- 871,946 people
- By 2030
- 955,468 · +9.6%
- By 2040
- 1,113,587 · +27.7%
- By 2050
- 1,256,891 · +44.1%
- By 2075
- 1,560,270 · +78.9%
- By 2100
- 1,726,848 · +98.0%
Race, ethnicity, and origin ACS 2023
- Neighborhood character
- Predominantly White (69%)
- Race & ethnicity
- White 69% Hispanic / Latino 26% Two or more races 13% Native American 3% Black 2%
- Hispanic origin (detail)
- Mexican 8% Puerto Rican 4% Cuban 3%
- Common ancestry
- Romanian 5% Lithuanian 2% Slovak 2%
- Foreign-born
- 22% · Canada, Jamaica
- Languages at home
- 74% English-only · Spanish 21% French/Haitian/Cajun 1% Russian/Polish/Slavic 1%
Political lean MEDSL · Lee
- 2024 margin
- Strong R (+28.4) · D 35.5% · R 63.9%
- 2008→2024 swing
- -18.0pp toward R · 2008: -10.4pp · 2024: -28.4pp
- All cycles
- 2024: R+28.4 2020: R+19.2 2016: R+20.4 2012: R+16.6 2008: R+10.4
Not yet ingested
- Civics
- —
Market trends
- HPI YoY
- ▼ -188.86%
- Current HPI
- 243.4153
- Rent YoY
- ▼ -0.61%
- Metro
- Cape Coral-Fort Myers, FL
- State GDP YoY
- ▲ 3.28%
- F500 in state
- 36
Industry mix (Fortune 500 HQ in FL)
| Industry | F500 HQs | Revenue |
|---|---|---|
| Industrial Technology | 2 | $29B |
|
||
| Insurance | 2 | $17B |
|
||
| Retail | 1 | $60B |
|
||
| Technology Distribution | 1 | $58B |
|
||
| Homebuilding | 1 | $35B |
|
||
| Technology Manufacturing | 1 | $35B |
|
||
Price history
-98.7% since first listed13 events — show timeline
- 2026-06-11 Listed $268,000 FORTMLS
- 2023-05-25 Listing Removed — NAPLESMLS
- 2023-05-02 Listed $349,000 NAPLESMLS
- 2021-02-11 Sold (Public Records) $181,800 Public Records
- 2021-02-09 Sold (MLS) $181,775 FORTMLS
- 2021-01-07 Pending — FORTMLS
- 2020-12-09 Price Changed $189,750 FORTMLS
- 2020-11-10 Listed $194,500 FORTMLS
- 2010-04-02 Sold (MLS) $68,000 FORTMLS
- 2010-02-10 Price Changed $69,900 FORTMLS
- 2009-10-29 Listing Removed — NAPLESMLS
- 2009-06-19 Listed $80,000 NAPLESMLS
- 2004-06-14 Sold (Public Records) $20,121,900 Public Records
Property tax history
+16.8%/yrLatest (2025): $2,868 · -12.0% YoY. Source: county tax records.
Cash-flow waterfall
monthlySold comps — $/sqft
last 12 mo · ≤1 miLoading sold comps…