 Multi-family
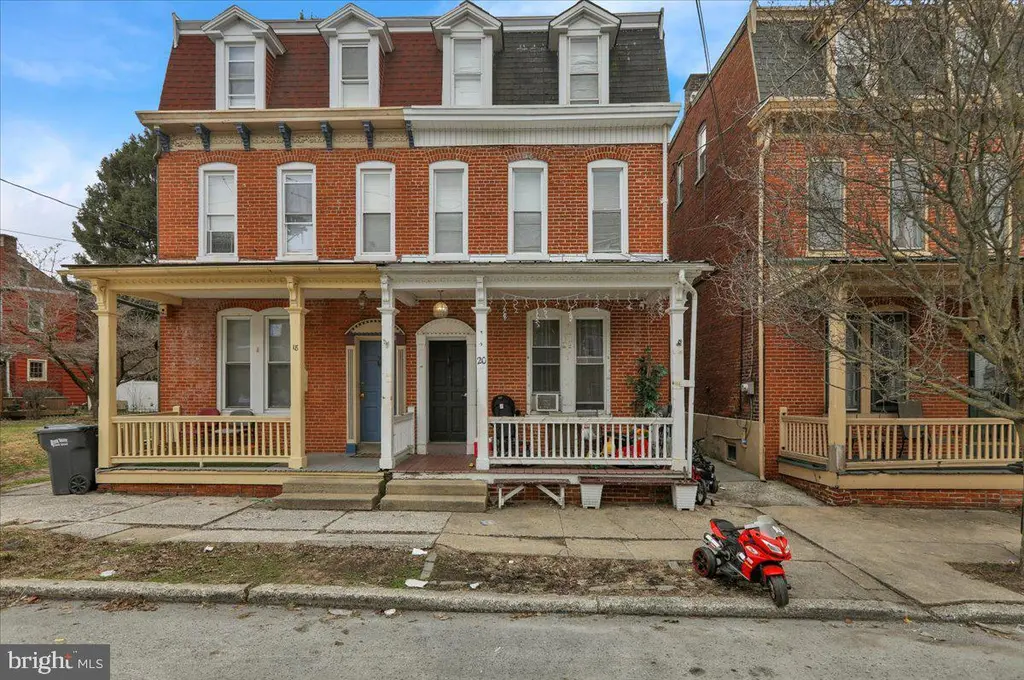
18 N 7th St · Columbia, PA
Flood risk 4/10 · Minor
- FEMA flood zone
- X (unshaded)
- Chance of flooding over 30 yrs
- 0.22%
- Est. flood insurance / yr
- $473 – $860
Fire risk 1/10 · Minimal
- Est. fire insurance / yr
- $511 – $949
Heat risk 6/10 · Moderate
- Hot days now (above 102°F)
- 7 days/yr
- Hot days in 30 yrs
- 16 days/yr
Wind risk 4/10 · Minor
- Chance of severe wind over 30 yrs
- 12.0%
Air-quality risk 3/10 · Minor
- Unhealthy air days now
- 2 days/yr
- Unhealthy air days in 30 yrs
- 5 days/yr
Risk factors via First Street. Map © Google.
Why this score? — see what drove the B+ grade
The composite is a weighted blend of 9 inputs, each scored 0–100. Each bar is that input's sub-score; the figure is the points it added to the 100-point composite (weight × sub-score).
- Cash flow +30.0/30.0
- ARV discount +15.0/15.0
- 1% rule +10.0/10.0
- DSCR +10.0/10.0
- Rent growth +4.2/5.0
- Livability +3.7/5.0
- Condition / age +2.5/5.0
- Schools +1.9/10.0
- Appreciation +0.0/10.0
$225,000
🖨 Deal sheet (PDF) 📄 Offer letter ✓ Due diligence
Multi-family units
County records classify this as Multi-Family (2-4 Unit). Listing-text estimate: 1 unit. estimate disagrees with records
Key facts
- Built 1900
- Listed 56 days
Neighborhood map
What this means for you Summary
Snapshot
- This is a 4-bed/1.5-bath multifamily listed at $225k.
Deal economics
- At list price, monthly cash flow is $1k ($16k/yr) — positive.
- The deal already cash-flows at list — no discount required.
- Meets the 1% rule at list price ($4k rent vs $225k).
- Recommended offer: $218k (3.0% below list) — sets the bar for market timing.
- Cap rate 13.2% vs local median 3.3% in Columbia — top-decile yield for the area; either an underpriced asset or a hidden risk that comps aren't pricing in. Stress-test before assuming the spread holds.
Location & tenants
- Location reads 73/100 on livability (#538 in PA) — a middle-class / working-renter tenant base. Strengths: cost of living A+, housing A+, health & safety A+; Watch: employment D+, amenities D, commute F.
- Columbia Borough SD (suburban): math 14% / reading 32% proficiency, ranked #482 of 539 in PA (top 89%) — low school quality limits family demand, transient renter base, plan for 1-2y turnover; 60% free/reduced lunch — lower-income household profile, screen leases tightly.
- Zoned schools: Park El Sch (math 17% / reading 37%, grade F, #1,154 of 1,518 statewide, top 77%, 478 students, 71% FRL); Columbia Ms (math 6% / reading 31%); Columbia Hs (math 42% / reading 10%, grade F, #372 of 437 statewide, top 86%, 376 students, 86% FRL) — zoned schools average 78% FRL vs 60% district-wide (18 pts higher); higher-poverty schools than district average — tighter screening recommended.
- Market conditions: Rents rising fast (+7.0%/yr); 131 active listings in the ZIP; 2 comparable units currently listed for rent nearby; 1,093 units permitted in Lancaster County in 2024 (201 in 5+ unit buildings).
Forward outlook
- Local home prices are declining (-3.0%/yr); year-one equity from $2k of loan paydown is wiped out by about $7k of value loss. Plan a longer hold.
- Lancaster County population projected at +5% by 2050 — modest demand growth; plan on rents tracking national, not racing it.
- At projected returns (-3.0% appreciation + 7.0% rent growth), your $63k cash investment doubles in ~5 years — after that, you're playing with house money.
Negotiation context
- It's been on market 56 days — a 3% lower offer ($218k) is reasonable based on typical stale-listing flexibility.
- 2 sale attempts since 3y ago with the ask held roughly flat each time — persistent listings suggest the price (not the market) is what's stuck; bring a comps-based counter.
- Current owner paid $85k; list at $225k implies a 165% gain — meaningful room to come down on a strong offer.
Risks & watch-outs
- Watch-outs: built in 1900 — expect roof / HVAC / electrical / plumbing capex.
- Climate carrying-cost: extreme-heat days projected 7→16/yr by 2055 (HVAC capex compounding) — expect insurance premiums to compound above CPI over the hold.
Questions for the listing agent
- It's been on market 56 days. Have you received any prior offers? Is the seller open to a 3% concession, seller financing, or rate buy-down credit?
- Built in 1900 — when were the roof, HVAC, electrical panel, plumbing, and water heater last replaced?
- Is there a deadline driving the sale (1031 exchange, divorce, estate, relocation)? That informs how much negotiation room exists.
- Schools are D-rated, which usually means shorter tenancies and higher turnover. Who's the typical renter profile here, and what's been the actual vacancy rate?
- What's the average days-on-market for RENTAL listings here right now (not sales)? A rising rental-DOM trend means longer vacancies and softer asking-rent achievability than the comps imply.
- What's the recent tenant-quality profile in this submarket — average credit score on applications, eviction rate, late-payment / NSF rate, and stable-employment percentage? A property-management company in the area should have these aggregated.
- How much new apartment / multifamily construction is in the pipeline within 1–3 miles? Heavy new supply (>2% of stock underway) typically softens rents 12–24 months out; light construction supports rent growth.
Investment metrics
- 1% rule
- 1.64% ✓
- Cap rate
- 13.24%
- Cash-on-cash
- 24.81%
- DSCR
- 2.10
- GRM
- 5.1
CMA / ARV
- ARV (median comp)
- $285,953
- List price
- $225,000
- Delta
- -21.32%
- Verdict
- UNDERPRICED
- Comps
- 20 within 1.0 mi
Show comp detail 7 sales within ~0.75 mi
| Address | Dist | Beds/Ba | Sqft | Sold | Price | $/sf | Match |
|---|---|---|---|---|---|---|---|
| 20 N 5th St | 0.22mi | 4/2.0 | 1,961 (+0%) | 8mo | $320,000 | $163 | 81 |
| 20 N 7th St | 0.00mi | 3/— (-1) | 2,108 (+8%) | 2mo | $230,000 | $109 | 80 |
| 16 N 5th St | 0.22mi | 4/— | 1,935 (-1%) | 17mo | $314,900 | $163 | 74 |
| 333 Cherry St | 0.37mi | 4/— | 2,052 (+5%) | 12mo | $200,001 | $97 | 64 |
| 336 Cherry St | 0.37mi | 4/— | 2,118 (+8%) | 7mo | $230,000 | $109 | 63 |
| 134 S 4th St | 0.37mi | 4/— | 1,680 (-14%) | 7mo | $230,000 | $137 | 54 |
| 18 N 5th St | 0.22mi | 4/3.0 | 2,212 (+13%) | 11mo | $325,000 | $147 | 53 |
Match score weights: distance 35% · size 25% · config 20% · recency 20%. Top-matched comps best support the ARV.
Projected returns pro-forma
-3.0% appreciation · 7.0% rent growth · sell at horizon
- IRR
- 22.8%
- Equity multiple
- 1.99×
- Total profit
- $62,075
- Equity at exit
- $33,548
- IRR
- 33.3%
- Equity multiple
- 4.65×
- Total profit
- $230,212
- Equity at exit
- $19,454
Cash invested: $63,000 (down + closing). Projections, not guarantees.
Landlord ↔ Tenant lean methodology
- Overall (STATE)
- 62 Landlord-Friendly
- State Pennsylvania
- 62 Landlord-Friendly · EVEN
- County
- — inherits STATE
- City
- — inherits STATE
ZIP-level market 17512
- Home prices YoY
- -23.7%
- Rents YoY
- 7.0%
- Active inventory
- 131
- Price-to-rent
- 15.2×
Monthly cashflow live
- Estimated rent
- $3,695 medium interval (Pro) →
- Mortgage (P&I)
- −$1,180
- Tax from tax record
- −$343 /mo · $4,112/yr
- Insurance
- −$94
- HOA
- −$0
- Vacancy / Maint / Mgmt
- −$776
- Net cashflow
- $1,303
Break-even live
Sensitivity live
| Price | -10% $1,430 | -5% $1,366 | +0% $1,303 | +5% $1,239 | +10% $1,175 |
|---|---|---|---|---|---|
| Rent | -10% $1,011 | -5% $1,157 | +0% $1,303 | +5% $1,449 | +10% $1,595 |
| Rate | -1.0pp $1,416 | -0.5pp $1,360 | base $1,303 | +0.5pp $1,244 | +1.0pp $1,185 |
3-unit breakdown (identical units grouped — click to expand)
| Units | Beds | Baths | Est. rent |
|---|---|---|---|
| 3× units | 2 | 1 | $3,696 |
| #1 | 2 | 1 | $1,232 |
| #2 | 2 | 1 | $1,232 |
| #3 | 2 | 1 | $1,232 |
| Total (3 units) | $3,695 | ||
UW: 25.0% down · 7.5% · 30yr · 1.5% tax · 5.0% vac · 8.0% maint · 8.0% mgmt
Financing live
Cash to close
- Down payment
- $56,250
- Closing costs
- $6,750
- Reserves months
- —
- Total cash needed
- —
Loan-product check · same deal, 3 products live
Conventional
25% down · 7.5% · 30yr
- Down + closing
- —
- Monthly P&I
- —
- Monthly cashflow
- —
- DSCR
- —
- Eligible?
- —
Personal DTI + credit; lowest rate.
DSCR
20% down · 8.5% · 30yr
- Down + closing
- —
- Monthly P&I
- —
- Monthly cashflow
- —
- DSCR
- —
- Eligible?
- —
No personal income docs; deal must DSCR.
Hard money
10% down · 12.0% · 12mo
- Down + closing
- —
- Monthly P&I
- —
- Monthly cashflow
- —
- DSCR
- —
- Eligible?
- —
Short-term bridge; refi at stabilization.
Rent comps 2 comps
| Address | Beds | Baths | Sqft | Rent | $/sqft | DOM | Units | Dist |
|---|---|---|---|---|---|---|---|---|
| 521 Locust St Columbia, PA | 3.0 | 1.5 | 1768 | $2,550 | $1.44 | 25d | 1 | 0.17mi |
| 362 S 3rd St Columbia, PA | 3.0 | 1.0 | 1266 | $1,350 | $1.07 | 45d | 1 | 0.54mi |
Listing history 11 events
-
2026-05-07status Pending
-
2026-03-12$225,000 Active
-
2024-03-14historical $1,650
-
2024-01-26price $1,590
-
2024-01-12price $1,650
-
2023-12-06price $1,695
-
2023-09-28price $1,750
-
2023-09-07price $1,795
-
2023-09-02$1,895
-
2019-12-18soldstatus $85,000
-
1991-07-09soldstatus $74,900
ⓘ Source: listings_history table (triggers on properties + properties_extension) + one-shot
backfill from property_details.listing_events for pre-trigger history.
Tax reassessment forecast PA · Partial reset (capped growth)
- Current annual tax
- $4,112 · $343/mo
- Projected year-2 tax
- $4,112 · $343/mo
- Expected delta
- $0/yr ($0/mo · 0.0%)
ⓘ Screening estimate from a state-policy table — verify with the county assessor before closing.
Climate risk First Street
- Flood 4/10 Moderate FEMA zone X (unshaded) · 22% chance over 30 yrs
- Wildfire 1/10 Low
- Heat 6/10 Major 7 d/yr ≥102°F today · 16 d/yr by 30 yrs out
- Wind 4/10 Moderate 12% chance of damaging wind over 30 yrs
- Air quality 3/10 Moderate 2 unhealthy d/yr today · 5 by 30 yrs out
Nearby sold comps map
Loading sold comps map…
Walkable amenities ~0.75 mi
Loading nearby amenities…
Taxation est. · year 1
- Rental income
- $44,340
- − Mortgage interest
- −$12,603
- − Property taxes
- −$4,112
- − Insurance
- −$1,125
- − Repairs & maintenance
- −$3,547
- − Management
- −$3,547
- − Depreciation
- −$6,545
- Taxable income
- $12,860
- Est. tax owed @ 24.0%
- −$3,086
- After-tax cash flow
- $12,547/yr
For passive investors: Depreciation is non-cash, so a rental often shows a tax loss while cash-flowing — sheltering income. Rental losses are passive: they offset passive income freely, and up to $25,000/yr can offset ordinary (W-2) income if you actively participate and your MAGI is under $100k (phasing out to $0 by $150k); unused losses carry forward. On sale, claimed depreciation is recaptured at up to 25%, and gains may owe capital-gains tax (a 1031 exchange can defer both). Figures are a year-1 estimate at your 24.0% rate — not tax advice; consult a CPA.
Schools (NCES district)
- District
- Columbia Borough SD
- NCES district ID
- 4206360
- Math proficiency
- 14% ▼ -11.00%
- Reading proficiency
- 32% ▼ -12.00%
- Median HH income
- $39,162
- Composite
- 19.3/100
- National rank
- #8799
- State rank
- #482 of 539 in PA
Livability — Columbia
- Score
- 73/100
- State rank
- #538
- US rank
- #5040
Category grades
Schools grade is shown separately in the Schools card above.
Census & demographics
- Census place
- Columbia, PA
- County
- Lancaster County · 390,309 people
- City population
- 18,148
- Metro
- Lancaster, PA
- Population (ZIP)
- 18,148
- Household income
- $66,684
- Rent vs Own
- Severe rent burden
- 647.0
Population outlook (Lancaster County) Hauer SSP2
- Today (2025)
- 561,011 people
- By 2030
- 570,969 · +1.8%
- By 2040
- 585,929 · +4.4%
- By 2050
- 591,056 · +5.4%
- By 2075
- 594,747 · +6.0%
- By 2100
- 558,850 · -0.4%
Race, ethnicity, and origin ACS 2023
- Neighborhood character
- Predominantly White (77%)
- Race & ethnicity
- White 77% Hispanic / Latino 15% Two or more races 7% Black 5%
- Hispanic origin (detail)
- Mexican 1% Puerto Rican 10% Dominican 2%
- Common ancestry
- Romanian 2% Lithuanian 2% Polish 1%
- Foreign-born
- 4% · Canada
- Languages at home
- 89% English-only · Spanish 9% German/W. Germanic 1% Arabic 1%
Political lean MEDSL · Lancaster
- 2024 margin
- R (+15.9) · D 41.5% · R 57.5%
- 2008→2024 swing
- -4.1pp toward R · 2008: -11.8pp · 2024: -15.9pp
- All cycles
- 2024: R+15.9 2020: R+15.8 2016: R+19.7 2012: R+19.2 2008: R+11.8
Not yet ingested
- Civics
- —
Market trends
- HPI YoY
- ▼ -86.48%
- Current HPI
- 278.1465
- Rent YoY
- ▲ 7.00%
- Metro
- Lancaster, PA
- State GDP YoY
- ▲ 1.68%
- F500 in state
- 34
Industry mix (Fortune 500 HQ in PA)
| Industry | F500 HQs | Revenue |
|---|---|---|
| Healthcare | 2 | $309B |
|
||
| Insurance | 2 | $27B |
|
||
| Telecommunications / Media | 1 | $124B |
|
||
| Industrial Distribution | 1 | $22B |
|
||
| Financial Services | 1 | $20B |
|
||
| Chemicals / Materials | 1 | $18B |
|
||
Price history
+200.4% since first listed11 events — show timeline
- 2026-05-07 Pending — BRIGHT MLS
- 2026-03-12 Listed $225,000 BRIGHT MLS
- 2024-03-14 Rental Removed $1,650 APPFOLIO
- 2024-01-26 Price Changed $1,590 APPFOLIO
- 2024-01-12 Price Changed $1,650 APPFOLIO
- 2023-12-06 Price Changed $1,695 APPFOLIO
- 2023-09-28 Price Changed $1,750 APPFOLIO
- 2023-09-07 Price Changed $1,795 APPFOLIO
- 2023-09-02 Listed for Rent $1,895 APPFOLIO
- 2019-12-18 Sold (Public Records) $85,000 Public Records
- 1991-07-09 Sold (Public Records) $74,900 Public Records
Property tax history
+1.5%/yrLatest (2026): $4,112 · -1.3% YoY. Source: county tax records.
Cash-flow waterfall
monthlySold comps — $/sqft
last 12 mo · ≤1 miLoading sold comps…