 9-Plex
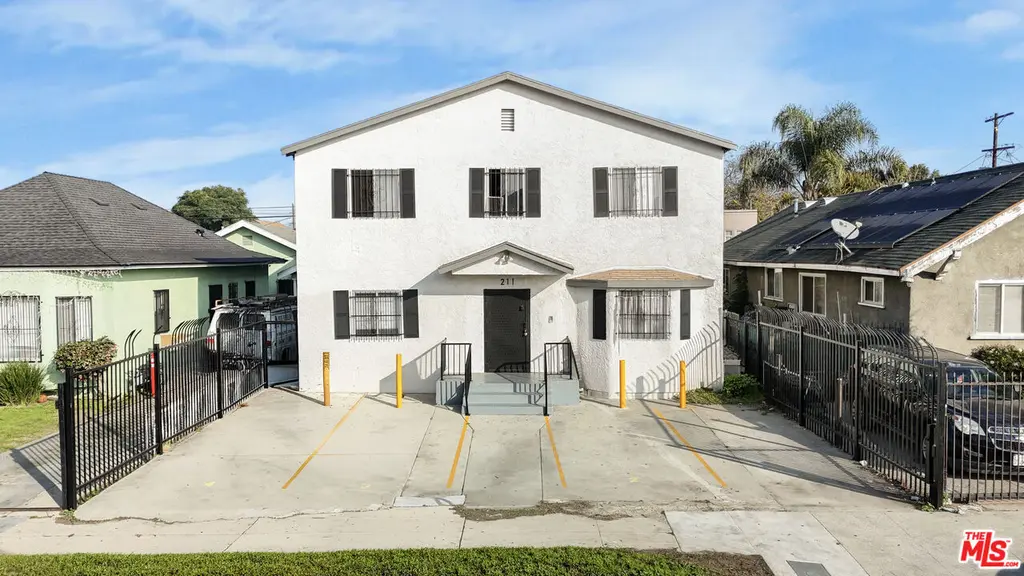
211 E 55th St · Los Angeles, CA
Flood risk 1/10 · Minimal
- FEMA flood zone
- X (unshaded)
- Chance of flooding over 30 yrs
- 0.0%
- Est. flood insurance / yr
- $507 – $1,088
Fire risk 1/10 · Minimal
- Est. fire insurance / yr
- $659 – $1,223
Heat risk 6/10 · Moderate
- Hot days now (above 88°F)
- 7 days/yr
- Hot days in 30 yrs
- 22 days/yr
Wind risk 1/10 · Minimal
- Chance of severe wind over 30 yrs
- —
Air-quality risk 5/10 · Moderate
- Unhealthy air days now
- 7 days/yr
- Unhealthy air days in 30 yrs
- 7 days/yr
Risk factors via First Street. Map © Google.
Why this score? — see what drove the C+ grade
The composite is a weighted blend of 9 inputs, each scored 0–100. Each bar is that input's sub-score; the figure is the points it added to the 100-point composite (weight × sub-score).
- Cash flow +30.0/30.0
- DSCR +10.0/10.0
- 1% rule +9.9/10.0
- Schools +3.6/10.0
- Livability +3.4/5.0
- Condition / age +2.5/5.0
- ARV discount +2.3/15.0
- Rent growth +0.5/5.0
- Appreciation +0.0/10.0
$1,295,000
🖨 Deal sheet 📄 Offer letter ✓ Due diligence
Multi-family units
County records classify this as Multi-Family (5+ Unit). Listing-text estimate: 9 units. confirmed
5+ unit building — per-unit beds/baths from public records are typically unavailable; the breakdown below (if shown) is an estimate from the listing text.
Listing remarks MLS
Large price improvement! Bring ALL offers on this well-kept and recently remodeled 9-unit apartment building located in the rapidly improving South Los Angeles pocket. The property is being offered at a lucrative $143k Price Per Unit with a desirable and balanced unit mix of (3) 2 Bed/1 Bath, (4) 1 Bed/1 Bath & (2) Large Studio Units, with on-site parking for 4 units. 6 of 9 units were recently remodeled, with 5 of 6 of those units getting in-place market rents. (1) recently renovated 1 Bed/1 Bath unit is vacant and move-in-ready for market rent, and another (1) 1 Bed/1 Bath unit is vacant and remodel ready for market rent. 8,06% current cap rate and 7.52x current GRM once the two vacant units are leased. 2 units are below market and offer approximately 140% future rental upside. All units are separately metered for gas & electricity. In addition to renovated units, the common area hallways have been renovated, the exterior has been repainted with new trim, electrical repairs, 9A work completed, and more. 211 E 55th St offers a central urban setting just minutes south of Downtown Los Angeles. The surrounding area features a mix of residential streets, local markets and neighborhood restaurants. South Los Angeles benefits from its strategic location with easy access to major freeways such as the I-10, I-110, and I-405, providing seamless connectivity to Downtown, employment hubs, and the greater Los Angeles area. The property is less than 2 miles from Exposition Park, the Natural History Museum, and the upcoming $1B Lucas Museum of Narrative Art (opening September 2026), 2.25 miles from USC, and just over 3 miles from Crypto.com Arena and the LA Convention Center, placing tenants close to some of Los Angeles' most iconic cultural and entertainment destinations.
Key facts
- Renovated units
- Recently remodeled
- On-site parking
Tags
Neighborhood map
What this means for you Summary
Snapshot
- This is a 3×2bd/1ba + 6×1bd/1ba units multifamily listed at $1.29M.
Deal economics
- At list price, monthly cash flow is $7k ($81k/yr) — positive. Per door: $750/mo.
- The deal already cash-flows at list — no discount required.
- Meets the 1% rule at list price ($19k rent vs $1.29M).
- Recommended offer: $1.18M (9.0% below list) — sets the bar for market timing.
- Cap rate 12.6% vs local median 2.1% in Los Angeles — top-decile yield for the area; either an underpriced asset or a hidden risk that comps aren't pricing in. Stress-test before assuming the spread holds.
Location & tenants
- Location reads 68/100 on livability (#273 in CA) — a middle-class / working-renter tenant base. Strengths: amenities A+, commute A+, employment B; Watch: health & safety C-, schools D+, crime F.
- Los Angeles Unified (urban): math 29% / reading 54% proficiency, ranked #223 of 517 in CA (top 43%) — families likely to look elsewhere, expect single-tenant / working-renter base with shorter leases; 67% free/reduced lunch — lower-income household profile, screen leases tightly.
- Market conditions: Rents falling (-8.2%/yr); 126 active listings in the ZIP; 19,697 units permitted in Los Angeles County in 2024 (9,426 in 5+ unit buildings).
- At $19,260/mo this rent would consume 392% of the median local household income ($59k/yr) (locally 5930% of renters already pay >50% of income on rent) — very limited rent-growth headroom before tenants either downsize or default.
Forward outlook
- Local home prices are declining (-3.0%/yr); year-one equity from $9k of loan paydown is wiped out by about $39k of value loss. Plan a longer hold.
- Los Angeles County population projected at +9% by 2050 — modest demand growth; plan on rents tracking national, not racing it.
- At projected returns (-3.0% appreciation + 0.0% rent growth), your $363k cash investment doubles in ~7 years — after that, you're playing with house money.
Negotiation context
- It's been on market 104 days — a 9% lower offer ($1.18M) is reasonable based on typical stale-listing flexibility.
- 13 sale attempts since 25y ago; this cycle's ask has dropped $200k (13%) from the opening price — seller is motivated, your offer sets the floor, not the list.
- Current owner paid $950k; 36% above their basis — modest negotiation headroom, anchor on the comps not their cost.
Risks & watch-outs
- Watch-outs: built in 1912 — expect roof / HVAC / electrical / plumbing capex.
- Climate carrying-cost: extreme-heat days projected 7→22/yr by 2055 (HVAC capex compounding) — expect insurance premiums to compound above CPI over the hold.
Questions for the listing agent
- It's been on market 104 days. Have you received any prior offers? Is the seller open to a 9% concession, seller financing, or rate buy-down credit?
- Can we see the unit-by-unit rent roll, current vacancy, and any below-market leases? What's the average tenancy length?
- What capital expenditures (roof, boiler, parking lot, exteriors) have been made in the last 5 years, and what's planned in the next 2?
- Built in 1912 — when were the roof, HVAC, electrical panel, plumbing, and water heater last replaced?
- Why hasn't it sold? Are there any deal-killer items the seller is aware of (foundation, flood, title, zoning, code violations)?
- Is there a deadline driving the sale (1031 exchange, divorce, estate, relocation)? That informs how much negotiation room exists.
- Schools are D-rated, which usually means shorter tenancies and higher turnover. Who's the typical renter profile here, and what's been the actual vacancy rate?
- Crime grade is F in this area — have there been break-ins, vandalism, or insurance claims at this property in the last 3 years? What carrier currently insures it and at what premium?
- What's the average days-on-market for RENTAL listings here right now (not sales)? A rising rental-DOM trend means longer vacancies and softer asking-rent achievability than the comps imply.
- What's the recent tenant-quality profile in this submarket — average credit score on applications, eviction rate, late-payment / NSF rate, and stable-employment percentage? A property-management company in the area should have these aggregated.
- How much new apartment / multifamily construction is in the pipeline within 1–3 miles? Heavy new supply (>2% of stock underway) typically softens rents 12–24 months out; light construction supports rent growth.
Investment metrics
- 1% rule
- 1.49% ✓
- Cap rate
- 12.55%
- Cash-on-cash
- 22.35%
- DSCR
- 1.99
- GRM
- 5.6
CMA / ARV
- ARV (median comp)
- $1,160,081
- List price
- $1,295,000
- Delta
- 11.63%
- Verdict
- OVERPRICED
- Comps
- 20 within 1.0 mi
Show comp detail 2 sales within ~0.75 mi
| Address | Dist | Beds/Ba | Sqft | Sold | Price | $/sf | Match |
|---|---|---|---|---|---|---|---|
| 300 E 55th St | 0.08mi | 8/7.0 (-1) | 4,222 (-9%) | 3mo | $1,160,000 | $275 | 65 |
| 128 E 54th St | 0.09mi | 8/4.0 (-1) | 4,186 (-10%) | 23mo | $610,000 | $146 | 40 |
Match score weights: distance 35% · size 25% · config 20% · recency 20%. Top-matched comps best support the ARV.
Projected returns pro-forma
-3.0% appreciation · 0.0% rent growth · sell at horizon
- IRR
- 11.8%
- Equity multiple
- 1.45×
- Total profit
- $163,889
- Equity at exit
- $193,089
- IRR
- 18.3%
- Equity multiple
- 2.32×
- Total profit
- $478,476
- Equity at exit
- $111,968
Cash invested: $362,600 (down + closing). Projections, not guarantees.
Landlord ↔ Tenant lean methodology
- Overall (CITY)
- 0 Strongly Tenant-Friendly
- State California
- 18 Strongly Tenant-Friendly · D+13
- County
- — inherits STATE
- City Los Angeles
- 0 Strongly Tenant-Friendly · D+22
ZIP-level market 90011
- Rents YoY
- -8.2%
- Active inventory
- 126
- Price-to-rent
- 48.7×
Monthly cashflow live
- Estimated rent
- $19,260 high interval (Pro) →
- Mortgage (P&I)
- −$6,791
- Tax from tax record
- −$1,130 /mo · $13,564/yr
- Insurance
- −$540
- HOA
- −$0
- Vacancy / Maint / Mgmt
- −$4,045
- Net cashflow
- $6,754
Break-even live
9-unit breakdown (identical units grouped — click to expand)
| Units | Beds | Baths | Est. rent |
|---|---|---|---|
| 3× units | 2 | 1 | $6,645 |
| #1 | 2 | 1 | $2,215 |
| #2 | 2 | 1 | $2,215 |
| #3 | 2 | 1 | $2,215 |
| 6× units | 1 | 1 | $12,618 |
| #4 | 1 | 1 | $2,103 |
| #5 | 1 | 1 | $2,103 |
| #6 | 1 | 1 | $2,103 |
| #7 | 1 | 1 | $2,103 |
| #8 | 1 | 1 | $2,103 |
| #9 | 1 | 1 | $2,103 |
| Total (9 units) | $19,260 | ||
UW: 25.0% down · 7.5% · 30yr · 1.5% tax · 5.0% vac · 8.0% maint · 8.0% mgmt
Financing live
Cash to close
- Down payment
- $323,750
- Closing costs
- $38,850
- Reserves months
- —
- Total cash needed
- —
Loan-product check · same deal, 3 products live
Conventional
25% down · 7.5% · 30yr
- Down + closing
- —
- Monthly P&I
- —
- Monthly cashflow
- —
- DSCR
- —
- Eligible?
- —
Personal DTI + credit; lowest rate.
DSCR
20% down · 8.5% · 30yr
- Down + closing
- —
- Monthly P&I
- —
- Monthly cashflow
- —
- DSCR
- —
- Eligible?
- —
No personal income docs; deal must DSCR.
Hard money
10% down · 12.0% · 12mo
- Down + closing
- —
- Monthly P&I
- —
- Monthly cashflow
- —
- DSCR
- —
- Eligible?
- —
Short-term bridge; refi at stabilization.
Listing history 36 events
-
2026-05-31days on market $1,295,000 Active 104 DOM
-
2026-04-17price $1,295,000 1802-char remark
Show marketing remark (1802 chars)
Large price improvement! Bring ALL offers on this well-kept and recently remodeled 9-unit apartment building located in the rapidly improving South Los Angeles pocket. The property is being offered at a lucrative $143k Price Per Unit with a desirable and balanced unit mix of (3) 2 Bed/1 Bath, (4) 1 Bed/1 Bath & (2) Large Studio Units, with on-site parking for 4 units. 6 of 9 units were recently remodeled, with 5 of 6 of those units getting in-place market rents. (1) recently renovated 1 Bed/1 Bath unit is vacant and move-in-ready for market rent, and another (1) 1 Bed/1 Bath unit is vacant and remodel ready for market rent. 8,06% current cap rate and 7.52x current GRM once the two vacant units are leased. 2 units are below market and offer approximately 140% future rental upside. All units are separately metered for gas & electricity. In addition to renovated units, the common area hallways have been renovated, the exterior has been repainted with new trim, electrical repairs, 9A work completed, and more. 211 E 55th St offers a central urban setting just minutes south of Downtown Los Angeles. The surrounding area features a mix of residential streets, local markets and neighborhood restaurants. South Los Angeles benefits from its strategic location with easy access to major freeways such as the I-10, I-110, and I-405, providing seamless connectivity to Downtown, employment hubs, and the greater Los Angeles area. The property is less than 2 miles from Exposition Park, the Natural History Museum, and the upcoming $1B Lucas Museum of Narrative Art (opening September 2026), 2.25 miles from USC, and just over 3 miles from Crypto.com Arena and the LA Convention Center, placing tenants close to some of Los Angeles' most iconic cultural and entertainment destinations.
-
2026-03-13price $1,425,000 1802-char remark
Show marketing remark (1802 chars)
Large price improvement! Bring ALL offers on this well-kept and recently remodeled 9-unit apartment building located in the rapidly improving South Los Angeles pocket. The property is being offered at a lucrative $143k Price Per Unit with a desirable and balanced unit mix of (3) 2 Bed/1 Bath, (4) 1 Bed/1 Bath & (2) Large Studio Units, with on-site parking for 4 units. 6 of 9 units were recently remodeled, with 5 of 6 of those units getting in-place market rents. (1) recently renovated 1 Bed/1 Bath unit is vacant and move-in-ready for market rent, and another (1) 1 Bed/1 Bath unit is vacant and remodel ready for market rent. 8,06% current cap rate and 7.52x current GRM once the two vacant units are leased. 2 units are below market and offer approximately 140% future rental upside. All units are separately metered for gas & electricity. In addition to renovated units, the common area hallways have been renovated, the exterior has been repainted with new trim, electrical repairs, 9A work completed, and more. 211 E 55th St offers a central urban setting just minutes south of Downtown Los Angeles. The surrounding area features a mix of residential streets, local markets and neighborhood restaurants. South Los Angeles benefits from its strategic location with easy access to major freeways such as the I-10, I-110, and I-405, providing seamless connectivity to Downtown, employment hubs, and the greater Los Angeles area. The property is less than 2 miles from Exposition Park, the Natural History Museum, and the upcoming $1B Lucas Museum of Narrative Art (opening September 2026), 2.25 miles from USC, and just over 3 miles from Crypto.com Arena and the LA Convention Center, placing tenants close to some of Los Angeles' most iconic cultural and entertainment destinations.
-
2026-02-16$1,495,000 Active 1802-char remark
Show marketing remark (1802 chars)
Large price improvement! Bring ALL offers on this well-kept and recently remodeled 9-unit apartment building located in the rapidly improving South Los Angeles pocket. The property is being offered at a lucrative $143k Price Per Unit with a desirable and balanced unit mix of (3) 2 Bed/1 Bath, (4) 1 Bed/1 Bath & (2) Large Studio Units, with on-site parking for 4 units. 6 of 9 units were recently remodeled, with 5 of 6 of those units getting in-place market rents. (1) recently renovated 1 Bed/1 Bath unit is vacant and move-in-ready for market rent, and another (1) 1 Bed/1 Bath unit is vacant and remodel ready for market rent. 8,06% current cap rate and 7.52x current GRM once the two vacant units are leased. 2 units are below market and offer approximately 140% future rental upside. All units are separately metered for gas & electricity. In addition to renovated units, the common area hallways have been renovated, the exterior has been repainted with new trim, electrical repairs, 9A work completed, and more. 211 E 55th St offers a central urban setting just minutes south of Downtown Los Angeles. The surrounding area features a mix of residential streets, local markets and neighborhood restaurants. South Los Angeles benefits from its strategic location with easy access to major freeways such as the I-10, I-110, and I-405, providing seamless connectivity to Downtown, employment hubs, and the greater Los Angeles area. The property is less than 2 miles from Exposition Park, the Natural History Museum, and the upcoming $1B Lucas Museum of Narrative Art (opening September 2026), 2.25 miles from USC, and just over 3 miles from Crypto.com Arena and the LA Convention Center, placing tenants close to some of Los Angeles' most iconic cultural and entertainment destinations.
-
2025-06-11price
-
2025-05-05price
-
2025-04-21status Active
-
2025-01-21Active
-
2024-03-29soldstatus $950,000 Sold
-
2024-03-29soldstatus $479,500
-
2023-10-15status Pending
-
2023-09-21historical Backup Offers Accepted
-
2023-08-29$1,195,000 Active
-
2012-08-05soldstatus $576,000 Closed
-
2012-07-26soldstatus $576,000
-
2012-07-02status Pending
-
2012-06-20$588,000 Active
-
2011-10-03historical Cancelled
-
2011-09-08Active
-
2008-09-11historical
-
2008-06-10
-
2004-11-01historical
-
2004-02-03
-
2003-03-23historical
-
2003-03-23historical
-
2002-09-23
-
2002-09-23$675,000
-
2002-09-21historical
-
2002-09-21historical
-
2002-03-21
-
2002-03-21$449,000
-
2001-12-24historical
-
2001-06-25
-
1998-03-27soldstatus $180,000
-
1995-01-30soldstatus $185,000
-
1984-10-23soldstatus $115,000
ⓘ Source: listings_history table (triggers on properties + properties_extension) + one-shot
backfill from property_details.listing_events for pre-trigger history.
Tax reassessment forecast CA · Resets to sale price
- Current annual tax
- $13,564 · $1,130/mo
- Projected year-2 tax
- $13,564 · $1,130/mo
- Expected delta
- $0/yr ($0/mo · 0.0%)
ⓘ Screening estimate from a state-policy table — verify with the county assessor before closing.
Climate risk First Street
- Flood 1/10 Low FEMA zone X (unshaded) · 0% chance over 30 yrs
- Wildfire 1/10 Low
- Heat 6/10 Major 7 d/yr ≥88°F today · 22 d/yr by 30 yrs out
- Wind 1/10 Low
- Air quality 5/10 Major 7 unhealthy d/yr today · 7 by 30 yrs out
Nearby sold comps map
Loading sold comps map…
Walkable amenities ~0.75 mi
Loading nearby amenities…
Taxation est. · year 1
- Rental income
- $231,120
- − Mortgage interest
- −$72,540
- − Property taxes
- −$13,564
- − Insurance
- −$6,475
- − Repairs & maintenance
- −$18,490
- − Management
- −$18,490
- − Depreciation
- −$37,673
- Taxable income
- $63,889
- Est. tax owed @ 24.0%
- −$15,333
- After-tax cash flow
- $65,719/yr
For passive investors: Depreciation is non-cash, so a rental often shows a tax loss while cash-flowing — sheltering income. Rental losses are passive: they offset passive income freely, and up to $25,000/yr can offset ordinary (W-2) income if you actively participate and your MAGI is under $100k (phasing out to $0 by $150k); unused losses carry forward. On sale, claimed depreciation is recaptured at up to 25%, and gains may owe capital-gains tax (a 1031 exchange can defer both). Figures are a year-1 estimate at your 24.0% rate — not tax advice; consult a CPA.
Schools (NCES district)
- District
- Los Angeles Unified
- NCES district ID
- 0622710
- Math proficiency
- 29% ▼ -4.00%
- Reading proficiency
- 54% ▲ 10.00%
- Median HH income
- $50,403
- Composite
- 35.67/100
- National rank
- #4875
- State rank
- #223 of 517 in CA
Livability — Los Angeles
- Score
- 68/100
- State rank
- #273
- US rank
- #9237
Category grades
Schools grade is shown separately in the Schools card above.
Census & demographics
- Census place
- Los Angeles, CA
- County
- Los Angeles County · 9,444,647 people
- City population
- 3,838,149
- Metro
- Los Angeles-Long Beach-Anaheim, CA
- Population (ZIP)
- 100,113
- Household income
- $59,017
- Rent vs Own
- Severe rent burden
- 5930.0
Population outlook (Los Angeles County) Hauer SSP2
- Today (2025)
- 10,940,515 people
- By 2030
- 11,256,481 · +2.9%
- By 2040
- 11,729,929 · +7.2%
- By 2050
- 11,948,407 · +9.2%
- By 2075
- 11,818,114 · +8.0%
- By 2100
- 10,842,928 · -0.9%
Race, ethnicity, and origin ACS 2023
- Neighborhood character
- Predominantly Hispanic (92%)
- Race & ethnicity
- Hispanic / Latino 92% Two or more races 26% Black 6% Native American 2%
- Hispanic origin (detail)
- Mexican 67%
- Foreign-born
- 45% · Canada, South Korea
- Languages at home
- 13% English-only · Spanish 86%
Political lean MEDSL · Los Angeles
- 2024 margin
- Solid D (+32.9) · D 64.8% · R 31.9% · Other 3.3%
- 2008→2024 swing
- -7.4pp toward R · 2008: 40.4pp · 2024: 32.9pp
- All cycles
- 2024: D+32.9 2020: D+44.2 2016: D+48.0 2012: D+40.0 2008: D+40.4
Not yet ingested
- Civics
- —
Market trends
- HPI YoY
- ▼ -636.62%
- Current HPI
- 477.6496
- Rent YoY
- ▼ -8.20%
- Metro
- Los Angeles-Long Beach-Anaheim, CA
- State GDP YoY
- ▲ 3.21%
- F500 in state
- 116
Industry mix (Fortune 500 HQ in CA)
| Industry | F500 HQs | Revenue |
|---|---|---|
| Technology | 27 | $1,492B |
|
||
| Financial Services | 3 | $174B |
|
||
| Retail | 3 | $44B |
|
||
| Insurance | 3 | $26B |
|
||
| Media / Entertainment | 2 | $115B |
|
||
| Pharmaceuticals / Biotech | 2 | $62B |
|
||
Price history
+1026.1% since first listed35 events — show timeline
- 2026-04-17 Price Changed $1,295,000 TheMLS
- 2026-03-13 Price Changed $1,425,000 TheMLS
- 2026-02-16 Listed $1,495,000 TheMLS
- 2025-06-11 Price Changed — TheMLS
- 2025-05-05 Price Changed — TheMLS
- 2025-04-21 Relisted — TheMLS
- 2025-01-21 Listed — TheMLS
- 2024-03-29 Sold (Public Records) $479,500 Public Records
- 2024-03-29 Sold (MLS) $950,000 TheMLS
- 2023-10-15 Pending — TheMLS
- 2023-09-21 Contingent — TheMLS
- 2023-08-29 Listed $1,195,000 TheMLS
- 2012-08-05 Sold (MLS) $576,000 CRMLS
- 2012-07-26 Sold (Public Records) $576,000 Public Records
- 2012-07-02 Pending — CRMLS
- 2012-06-20 Listed $588,000 CRMLS
- 2011-10-03 Delisted — TheMLS
- 2011-09-08 Listed — TheMLS
- 2008-09-11 Delisted — TheMLS
- 2008-06-10 Listed — TheMLS
- 2004-11-01 Delisted — TheMLS
- 2004-02-03 Listed — TheMLS
- 2003-03-23 Listing Removed — SDMLS
- 2003-03-23 Delisted — TheMLS
- 2002-09-23 Listed $675,000 SDMLS
- 2002-09-23 Listed — TheMLS
- 2002-09-21 Listing Removed — SDMLS
- 2002-09-21 Delisted — TheMLS
- 2002-03-21 Listed $449,000 SDMLS
- 2002-03-21 Listed — TheMLS
- 2001-12-24 Delisted — TheMLS
- 2001-06-25 Listed — TheMLS
- 1998-03-27 Sold (Public Records) $180,000 Public Records
- 1995-01-30 Sold (Public Records) $185,000 Public Records
- 1984-10-23 Sold (Public Records) $115,000 Public Records
Property tax history
+6.4%/yrLatest (2025): $13,564 · +45.1% YoY. Source: county tax records.
Cash-flow waterfall
monthlySold comps — $/sqft
last 12 mo · ≤1 miLoading sold comps…