 10-Plex
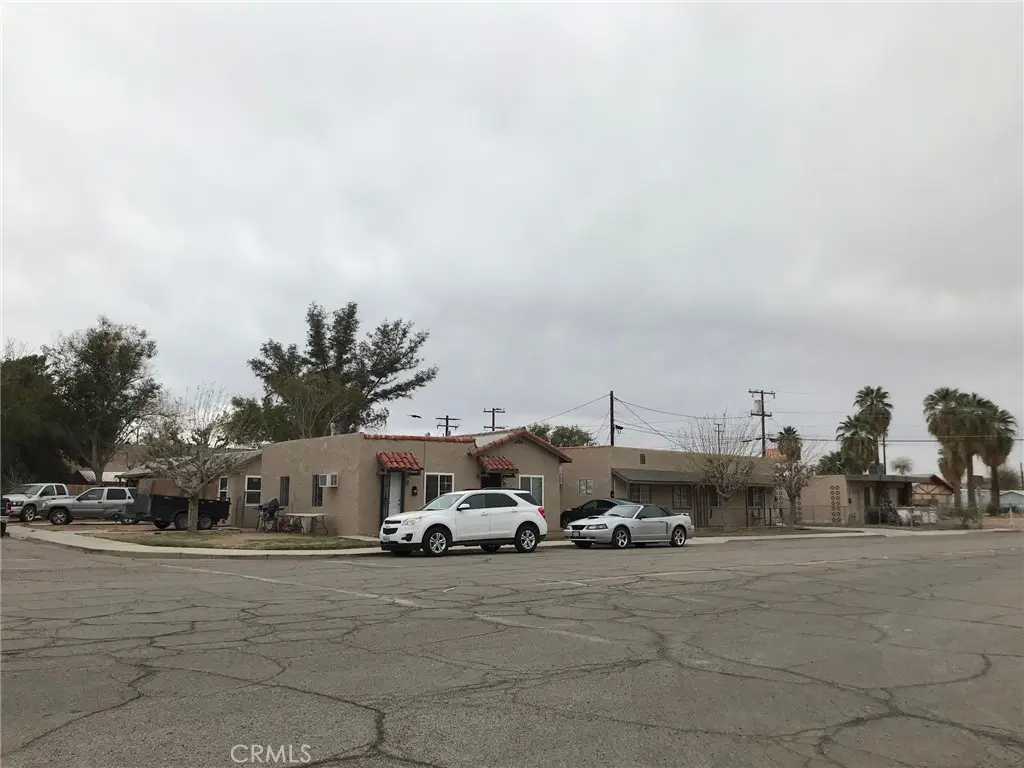
222 W Rice St · Blythe, CA
Flood risk 1/10 · Minimal
- FEMA flood zone
- D
- Chance of flooding over 30 yrs
- 0.0%
- Est. flood insurance / yr
- $544 – $1,084
Fire risk 1/10 · Minimal
- Est. fire insurance / yr
- $659 – $1,223
Heat risk 10/10 · Severe
- Hot days now (above 116°F)
- 7 days/yr
- Hot days in 30 yrs
- 19 days/yr
Wind risk 1/10 · Minimal
- Chance of severe wind over 30 yrs
- —
Air-quality risk 2/10 · Minimal
- Unhealthy air days now
- 1 days/yr
- Unhealthy air days in 30 yrs
- 1 days/yr
Risk factors via First Street. Map © Google.
Why this score? — see what drove the D grade
The composite is a weighted blend of 9 inputs, each scored 0–100. Each bar is that input's sub-score; the figure is the points it added to the 100-point composite (weight × sub-score).
- Cash flow +15.1/30.0
- ARV discount +7.5/15.0
- DSCR +4.6/10.0
- 1% rule +4.2/10.0
- Livability +3.7/5.0
- Schools +2.6/10.0
- Rent growth +2.5/5.0
- Condition / age +2.2/5.0
- Appreciation +0.0/10.0
$1,250,000
🖨 Deal sheet (PDF) 📄 Offer letter ✓ Due diligence
Multi-family units
County records classify this as Multi-Family (5+ Unit). Listing-text estimate: 10 units. confirmed
5+ unit building — per-unit beds/baths from public records are typically unavailable; the breakdown below (if shown) is an estimate from the listing text.
Listing remarks MLS
10-Unit Apartment Complex - 222 W Rice St Perfect opportunity to purchase a cash flowing asset in the heart of Blythe. Unit Mix: 1 Studio Apartment - Fully remodeled including plumbing, electrical and mini split AC. 6 One-Bedroom/One-Bath Units - 4 units completely remodeled with new plumbing, electrical, and Mini split units. 3 Two-Bedroom/One-Bath Units - 1 Fully remodeled with new plumbing electrical and plumbing and mini splits. 1 remodeled by previous owner 5 years ago. Rental Status: A mix of 5 furnished and 5 unfurnished units, with some leased through Airbnb and others directly to tenants, providing flexible income streams.
Key facts
- Mini split ac
- Unfurnished units
- Fully remodeled
Tags
Neighborhood map
What this means for you Summary
Snapshot
- This is a 7×1bd/1ba + 3×2bd/1ba units multifamily listed at $1.25M. Condition is rated fair.
Deal economics
- At list price, monthly cash flow is $410 ($5k/yr) — positive. Per door: $41/mo.
- The deal already cash-flows at list — no discount required.
- To meet the 1% rule (rent ≥ 1% of price), the offer needs to be $1.15M (8.4% below list).
- Recommended offer: $1.10M (12.0% below list) — sets the bar for market timing.
- Cap rate 6.7% vs local median 4.6% in Blythe — top-decile yield for the area; either an underpriced asset or a hidden risk that comps aren't pricing in. Stress-test before assuming the spread holds.
Location & tenants
- Location reads 74/100 on livability (#143 in CA, #4,910 nationally) — a middle-class / working-renter tenant base. Strengths: commute A+, housing A+, health & safety A+; Watch: employment D, amenities F.
- Palo Verde Unified (town): math 20% / reading 34% proficiency, ranked #1,133 of 1,400 in CA (top 81%) — low school quality limits family demand, transient renter base, plan for 1-2y turnover; 64% free/reduced lunch — lower-income household profile, screen leases tightly.
- Zoned schools: Felix J. Appleby Elementary (632 students, 84% FRL); Palo Verde High (820 students, 76% FRL) — zoned schools average 80% FRL vs 64% district-wide (16 pts higher); higher-poverty schools than district average — tighter screening recommended.
- Market conditions: 192 active listings in the ZIP; 9,195 units permitted in Riverside County in 2024 (1,512 in 5+ unit buildings).
Forward outlook
- Local home prices are declining (-3.0%/yr); year-one equity from $9k of loan paydown is wiped out by about $38k of value loss. Plan a longer hold.
- Riverside County population projected at +22% by 2050 — long-run rental-demand tailwind backs the buy-and-hold thesis.
Negotiation context
- It's been on market 158 days — a 12% lower offer ($1.10M) is reasonable based on typical stale-listing flexibility.
- 2 sale attempts with the ask held roughly flat each time — persistent listings suggest the price (not the market) is what's stuck; bring a comps-based counter.
Risks & watch-outs
- Watch-outs: built in 1930 — expect roof / HVAC / electrical / plumbing capex.
- Climate carrying-cost: extreme-heat days projected 7→19/yr by 2055 (HVAC capex compounding) — expect insurance premiums to compound above CPI over the hold.
Questions for the listing agent
- It's been on market 158 days. Have you received any prior offers? Is the seller open to a 12% concession, seller financing, or rate buy-down credit?
- Can we see the unit-by-unit rent roll, current vacancy, and any below-market leases? What's the average tenancy length?
- What capital expenditures (roof, boiler, parking lot, exteriors) have been made in the last 5 years, and what's planned in the next 2?
- Have any recent inspections been done? Can we get a copy of the seller's disclosures and any deferred-maintenance estimates?
- Built in 1930 — when were the roof, HVAC, electrical panel, plumbing, and water heater last replaced?
- Why hasn't it sold? Are there any deal-killer items the seller is aware of (foundation, flood, title, zoning, code violations)?
- Is there a deadline driving the sale (1031 exchange, divorce, estate, relocation)? That informs how much negotiation room exists.
- Schools are F-rated, which usually means shorter tenancies and higher turnover. Who's the typical renter profile here, and what's been the actual vacancy rate?
- The area grade is low — what's the realistic commute time and amenity access for the typical tenant pool here? Any planned neighborhood developments (good or bad) we should know about?
- What's the average days-on-market for RENTAL listings here right now (not sales)? A rising rental-DOM trend means longer vacancies and softer asking-rent achievability than the comps imply.
- What's the recent tenant-quality profile in this submarket — average credit score on applications, eviction rate, late-payment / NSF rate, and stable-employment percentage? A property-management company in the area should have these aggregated.
- How much new apartment / multifamily construction is in the pipeline within 1–3 miles? Heavy new supply (>2% of stock underway) typically softens rents 12–24 months out; light construction supports rent growth.
Investment metrics
- 1% rule
- 0.92% ✗
- Cap rate
- 6.69%
- Cash-on-cash
- 1.41%
- DSCR
- 1.06
- GRM
- 9.1
CMA / ARV
No comps found within radius.
Projected returns pro-forma
-3.0% appreciation · 3.0% rent growth · sell at horizon
- IRR
- -14.0%
- Equity multiple
- 0.50×
- Total profit
- $-176,256
- Equity at exit
- $186,379
- IRR
- -5.2%
- Equity multiple
- 0.66×
- Total profit
- $-119,138
- Equity at exit
- $108,077
Cash invested: $350,000 (down + closing). Projections, not guarantees.
Landlord ↔ Tenant lean methodology
- Overall (STATE)
- 18 Strongly Tenant-Friendly
- State California
- 18 Strongly Tenant-Friendly · D+13
- County
- — inherits STATE
- City
- — inherits STATE
ZIP-level market 92225
- Home prices YoY
- -15.8%
- Active inventory
- 192
- Price-to-rent
- 93.0×
Monthly cashflow live
- Estimated rent
- $11,454 medium interval (Pro) →
- Mortgage (P&I)
- −$6,555
- Tax est. 1.5%
- −$1,562 /mo · $18,750/yr
- Insurance
- −$521
- HOA
- −$0
- Vacancy / Maint / Mgmt
- −$2,405
- Net cashflow
- $410
Break-even live
Sensitivity live
| Price | -10% $1,274 | -5% $842 | +0% $410 | +5% $-22 | +10% $-454 |
|---|---|---|---|---|---|
| Rent | -10% $-495 | -5% $-42 | +0% $410 | +5% $863 | +10% $1,315 |
| Rate | -1.0pp $1,040 | -0.5pp $728 | base $410 | +0.5pp $86 | +1.0pp $-243 |
10-unit breakdown (identical units grouped — click to expand)
| Units | Beds | Baths | Est. rent |
|---|---|---|---|
| 7× units | 1 | 1 | $7,840 |
| #1 | 1 | 1 | $1,120 |
| #2 | 1 | 1 | $1,120 |
| #3 | 1 | 1 | $1,120 |
| #4 | 1 | 1 | $1,120 |
| #5 | 1 | 1 | $1,120 |
| #6 | 1 | 1 | $1,120 |
| #7 | 1 | 1 | $1,120 |
| 3× units | 2 | 1 | $3,612 |
| #8 | 2 | 1 | $1,204 |
| #9 | 2 | 1 | $1,204 |
| #10 | 2 | 1 | $1,204 |
| Total (10 units) | $11,454 | ||
UW: 25.0% down · 7.5% · 30yr · 1.5% tax · 5.0% vac · 8.0% maint · 8.0% mgmt
Financing live
Cash to close
- Down payment
- $312,500
- Closing costs
- $37,500
- Reserves months
- —
- Total cash needed
- —
Loan-product check · same deal, 3 products live
Conventional
25% down · 7.5% · 30yr
- Down + closing
- —
- Monthly P&I
- —
- Monthly cashflow
- —
- DSCR
- —
- Eligible?
- —
Personal DTI + credit; lowest rate.
DSCR
20% down · 8.5% · 30yr
- Down + closing
- —
- Monthly P&I
- —
- Monthly cashflow
- —
- DSCR
- —
- Eligible?
- —
No personal income docs; deal must DSCR.
Hard money
10% down · 12.0% · 12mo
- Down + closing
- —
- Monthly P&I
- —
- Monthly cashflow
- —
- DSCR
- —
- Eligible?
- —
Short-term bridge; refi at stabilization.
Listing history 20 events
-
2026-06-21days on market $1,250,000 Active 158 DOM
-
2026-06-19days on market $1,250,000 Active 156 DOM
-
2026-06-18days on market $1,250,000 Active 155 DOM
-
2026-06-17days on market $1,250,000 Active 154 DOM
-
2026-06-16days on market $1,250,000 Active 153 DOM
-
2026-06-15days on market $1,250,000 Active 152 DOM
-
2026-06-14days on market $1,250,000 Active 150 DOM
-
2026-06-12days on market $1,250,000 Active 149 DOM
-
2026-06-09days on market $1,250,000 Active 146 DOM
-
2026-06-08days on market $1,250,000 Active 145 DOM
-
2026-06-07days on market $1,250,000 Active 144 DOM
-
2026-06-07days on market $1,250,000 Active 143 DOM
-
2026-06-04days on market $1,250,000 Active 140 DOM
-
2026-06-02days on market $1,250,000 Active 139 DOM
-
2026-06-01days on market $1,250,000 Active 138 DOM
-
2026-05-31days on market $1,250,000 Active 137 DOM
-
2026-05-31days on market $1,250,000 Active 136 DOM
-
2026-01-14$1,250,000 Active 641-char remark
Show marketing remark (641 chars)
10-Unit Apartment Complex - 222 W Rice St Perfect opportunity to purchase a cash flowing asset in the heart of Blythe. Unit Mix: 1 Studio Apartment - Fully remodeled including plumbing, electrical and mini split AC. 6 One-Bedroom/One-Bath Units - 4 units completely remodeled with new plumbing, electrical, and Mini split units. 3 Two-Bedroom/One-Bath Units - 1 Fully remodeled with new plumbing electrical and plumbing and mini splits. 1 remodeled by previous owner 5 years ago. Rental Status: A mix of 5 furnished and 5 unfurnished units, with some leased through Airbnb and others directly to tenants, providing flexible income streams.
-
2025-10-22historical
-
2025-08-05$1,350,000 Active
ⓘ Source: listings_history table (triggers on properties + properties_extension) + one-shot
backfill from property_details.listing_events for pre-trigger history.
Climate risk First Street
- Flood 1/10 Low FEMA zone D · 0% chance over 30 yrs
- Wildfire 1/10 Low
- Heat 10/10 Extreme 7 d/yr ≥116°F today · 19 d/yr by 30 yrs out
- Wind 1/10 Low
- Air quality 2/10 Low 1 unhealthy d/yr today · 1 by 30 yrs out
Nearby sold comps map
Loading sold comps map…
Walkable amenities ~0.75 mi
Loading nearby amenities…
Taxation est. · year 1
- Rental income
- $137,448
- − Mortgage interest
- −$70,019
- − Property taxes
- −$18,750
- − Insurance
- −$6,250
- − Repairs & maintenance
- −$10,996
- − Management
- −$10,996
- − Depreciation
- −$36,364
- Taxable loss
- −$15,927
- Est. tax savings @ 24.0%
- +$3,822
- After-tax cash flow
- $8,745/yr
For passive investors: Depreciation is non-cash, so a rental often shows a tax loss while cash-flowing — sheltering income. Rental losses are passive: they offset passive income freely, and up to $25,000/yr can offset ordinary (W-2) income if you actively participate and your MAGI is under $100k (phasing out to $0 by $150k); unused losses carry forward. On sale, claimed depreciation is recaptured at up to 25%, and gains may owe capital-gains tax (a 1031 exchange can defer both). Figures are a year-1 estimate at your 24.0% rate — not tax advice; consult a CPA.
Condition & rehab AI · 2 photos
This 10-unit apartment complex requires moderate rehabilitation to improve its condition and increase its resale and rental value.
Repairs flagged
- Major exterior siding — Significant wear and tear
- Major roof — No visible damage, but age is implied
- Major landscaping — Sparse vegetation, unkempt appearance
Value-add opportunities
- Both exterior painting — Enhances curb appeal and value
- Both roof repair — Improves structural integrity and value
- Both landscaping — Enhances curb appeal and value
Renovation cost estimate screening
| Repair item | Severity | Est. cost |
|---|---|---|
| exterior siding · Significant wear and tear | Major | $15,000–50,000 |
| roof · No visible damage, but age is implied | Major | $15,000–50,000 |
| landscaping · Sparse vegetation, unkempt appearance | Major | $15,000–50,000 |
| Total estimated repair cost · 3 items | $45,000–150,000 |
Value-add ROI direction
- Both exterior painting — Enhances curb appeal and value ↑
- Both roof repair — Improves structural integrity and value ↑
- Both landscaping — Enhances curb appeal and value ↑
ⓘ Cost ranges are severity-bucket heuristics (US national rule-of-thumb). Get contractor quotes + a written scope before underwriting a rehab budget.
Schools (NCES district)
- District
- Palo Verde Unified
- NCES district ID
- 0629640
- Math proficiency
- 20% ▲ 3.00%
- Reading proficiency
- 34% ▲ 5.00%
- Median HH income
- $40,808
- Composite
- 25.77/100
- National rank
- #12796
- State rank
- #1133 of 1400 in CA
Livability — Blythe
- Score
- 74/100
- State rank
- #143
- US rank
- #4910
Category grades
Schools grade is shown separately in the Schools card above.
Census & demographics
- Census place
- Blythe, CA
- Population (ZIP)
- 21,101
Population outlook (Riverside County) Hauer SSP2
- Today (2025)
- 2,664,475 people
- By 2030
- 2,802,692 · +5.2%
- By 2040
- 3,050,904 · +14.5%
- By 2050
- 3,256,783 · +22.2%
- By 2075
- 3,655,058 · +37.2%
- By 2100
- 3,766,594 · +41.4%
Race, ethnicity, and origin ACS 2023
- Neighborhood character
- Diverse neighborhood (Simpson 0.58)
- Race & ethnicity
- Hispanic / Latino 59% White 26% Two or more races 13% Black 10% Asian 2% Native American 2%
- Hispanic origin (detail)
- Mexican 54%
- Common ancestry
- Lithuanian 1% Romanian 1% Iranian 1%
- Foreign-born
- 18% · Canada
- Languages at home
- 55% English-only · Spanish 42% Other Indo-European 1% Tagalog/Filipino 0%
Political lean MEDSL · Riverside
- 2024 margin
- Toss-up / Even · D 48.0% · R 49.3% · Other 2.6%
- 2008→2024 swing
- -3.6pp toward R · 2008: 2.3pp · 2024: -1.3pp
- All cycles
- 2024: R+1.3 2020: D+8.0 2016: D+4.3 2012: R+0.4 2008: D+2.3
Not yet ingested
- Civics
- —
Market trends
- HPI YoY
- ▼ -40.53%
- Current HPI
- 215.4794
- Rent YoY
- —
- Metro
- —
- State GDP YoY
- ▲ 3.21%
- F500 in state
- 116
Industry mix (Fortune 500 HQ in CA)
| Industry | F500 HQs | Revenue |
|---|---|---|
| Technology | 27 | $1,492B |
|
||
| Financial Services | 3 | $174B |
|
||
| Retail | 3 | $44B |
|
||
| Insurance | 3 | $26B |
|
||
| Media / Entertainment | 2 | $115B |
|
||
| Pharmaceuticals / Biotech | 2 | $62B |
|
||
Price history
-7.4% since first listed3 events — show timeline
- 2026-01-14 Listed $1,250,000 CRMLS
- 2025-10-22 Listing Removed — CRMLS
- 2025-08-05 Listed $1,350,000 CRMLS
Cash-flow waterfall
monthlySold comps — $/sqft
last 12 mo · ≤1 miLoading sold comps…