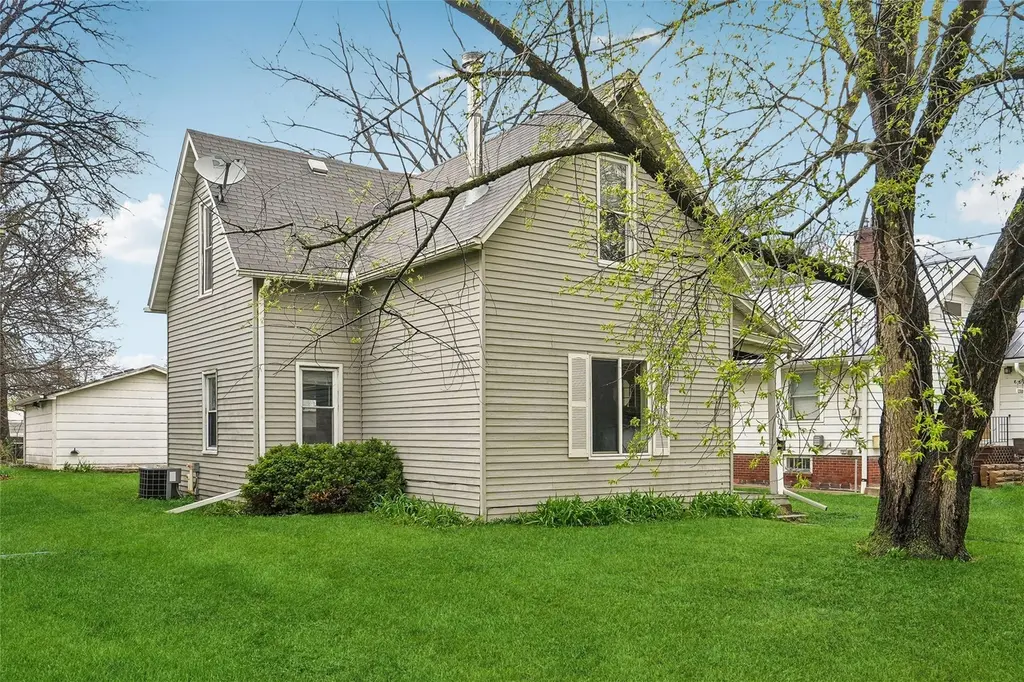
1304 Hull Ave · Des Moines, IA
Flood risk 1/10 · Minimal
- FEMA flood zone
- X (unshaded)
- Chance of flooding over 30 yrs
- 0.0%
- Est. flood insurance / yr
- $473 – $860
Fire risk 1/10 · Minimal
- Est. fire insurance / yr
- $902 – $1,676
Heat risk 3/10 · Minor
- Hot days now (above 103°F)
- 7 days/yr
- Hot days in 30 yrs
- 15 days/yr
Wind risk 2/10 · Minimal
- Chance of severe wind over 30 yrs
- —
Air-quality risk 2/10 · Minimal
- Unhealthy air days now
- 1 days/yr
- Unhealthy air days in 30 yrs
- 2 days/yr
Risk factors via First Street. Map © Google.
Why this score? — see what drove the D+ grade
The composite is a weighted blend of 9 inputs, each scored 0–100. Each bar is that input's sub-score; the figure is the points it added to the 100-point composite (weight × sub-score).
- Cash flow +15.3/30.0
- ARV discount +10.2/15.0
- 1% rule +4.7/10.0
- DSCR +4.7/10.0
- Livability +4.0/5.0
- Schools +3.8/10.0
- Rent growth +2.5/5.0
- Condition / age +2.5/5.0
- Appreciation +0.0/10.0
$174,900
🖨 Deal sheet (PDF) 📄 Offer letter ✓ Due diligence
Listing remarks MLS
Spacious 4 bedroom home. Main floor laundry with half bath. 2 car detached garage. Contract terms.
Key facts
- Formal dining room
- Washer dryer hookups
- 2 car garage
Tags
Property features AI
Finance
- HOA & community: Sidewalks in the community
Exterior
- Parking: Detached two-car garage
- Utilities: Public water; Public sewer
- Home design: Zoned R1-60
- Construction: Metal siding; Block and brick/mortar foundation; Asphalt shingle roof
- Exterior features: Deck; Rectangular lot; Asphalt road access
Interior
- Kitchen: Dishwasher; Refrigerator; Stove
- Bathrooms: 1 full bathroom; 1 half bathroom
- Heating & cooling: Forced air heating (natural gas); Central air conditioning
- Interior features: Separate/formal dining room; Eat-in kitchen
- Laundry & utility: Laundry on main level
Neighborhood map
What this means for you Summary
Snapshot
- This is a 4-bed/1.5-bath single-family listed at $175k.
Deal economics
- At list price, monthly cash flow is $63 ($761/yr) — positive.
- The deal already cash-flows at list — no discount required.
- To meet the 1% rule (rent ≥ 1% of price), the offer needs to be $169k (3.3% below list).
- Recommended offer: $169k (3.3% below list) — sets the bar for 1% rule.
- Cap rate 6.7% vs local median 3.1% in Des Moines — top-decile yield for the area; either an underpriced asset or a hidden risk that comps aren't pricing in. Stress-test before assuming the spread holds.
Location & tenants
- Location reads 81/100 on livability (#63 in IA, #1,432 nationally) — a professional / high-income tenant draw. Strengths: commute A+, cost of living A+, housing A+; Watch: employment C-, crime F.
- Des Moines Independent Community School District (urban): math 43% / reading 46% proficiency, ranked #289 of 289 in IA (top 100%) — families likely to look elsewhere, expect single-tenant / working-renter base with shorter leases; 63% free/reduced lunch — lower-income household profile, screen leases tightly.
- Zoned schools: Cattell Elementary School (math 42% / reading 42%, grade F, #563 of 616 statewide, top 93%, 322 students, 85% FRL); Harding Middle School (math 31% / reading 30%, grade F, #245 of 246 statewide, top 100%, 655 students, 90% FRL); North High School (math 33% / reading 45%, grade F, #326 of 336 statewide, top 97%, 1,458 students, 87% FRL) — zoned schools average 87% FRL vs 63% district-wide (24 pts higher); higher-poverty schools than district average — tighter screening recommended.
- Market conditions: 106 active listings in the ZIP; 4 comparable units currently listed for rent nearby; rentals at typical pace (median 26d on market — plan ~3-4 weeks tenant-placement turnaround); 2,953 units permitted in Polk County in 2024 (540 in 5+ unit buildings).
Forward outlook
- Local home prices are declining (-3.0%/yr); year-one equity from $1k of loan paydown is wiped out by about $5k of value loss. Plan a longer hold.
- Polk County population projected at +37% by 2050 — long-run rental-demand tailwind backs the buy-and-hold thesis.
Negotiation context
- Only 14 days on market — expect competitive offers; lowballing is unlikely to land.
- 3 sale attempts since 13y ago with the ask held roughly flat each time — persistent listings suggest the price (not the market) is what's stuck; bring a comps-based counter.
- Current owner paid $125k; 40% above their basis — modest negotiation headroom, anchor on the comps not their cost.
Risks & watch-outs
- Watch-outs: built in 1900 — expect roof / HVAC / electrical / plumbing capex.
Questions for the listing agent
- Built in 1900 — when were the roof, HVAC, electrical panel, plumbing, and water heater last replaced?
- Is there a deadline driving the sale (1031 exchange, divorce, estate, relocation)? That informs how much negotiation room exists.
- Schools are D-rated, which usually means shorter tenancies and higher turnover. Who's the typical renter profile here, and what's been the actual vacancy rate?
- Crime grade is F in this area — have there been break-ins, vandalism, or insurance claims at this property in the last 3 years? What carrier currently insures it and at what premium?
- The area grade is low — what's the realistic commute time and amenity access for the typical tenant pool here? Any planned neighborhood developments (good or bad) we should know about?
- What's the average days-on-market for RENTAL listings here right now (not sales)? A rising rental-DOM trend means longer vacancies and softer asking-rent achievability than the comps imply.
- What's the recent tenant-quality profile in this submarket — average credit score on applications, eviction rate, late-payment / NSF rate, and stable-employment percentage? A property-management company in the area should have these aggregated.
- How much new for-sale + rental construction is in the pipeline within 1–3 miles? Heavy new supply typically softens prices + rents 12–24 months out; constrained supply supports both.
Investment metrics
- 1% rule
- 0.97% ✗
- Cap rate
- 6.73%
- Cash-on-cash
- 1.55%
- DSCR
- 1.07
- GRM
- 8.6
CMA / ARV
- ARV (on-the-fly)
- $185,856
- Comps found
- 12
Show comp detail 12 sales within ~0.75 mi
| Address | Dist | Beds/Ba | Sqft | Sold | Price | $/sf | Match |
|---|---|---|---|---|---|---|---|
| 1304 Hull Ave | 0.00mi | 4/1.5 | 1,536 (0%) | 0mo | $167,000 | $109 | 100 |
| 2416 York St | 0.35mi | 4/2.0 | 1,496 (-3%) | 3mo | $176,021 | $118 | 75 |
| 800 E Sheridan Ave | 0.37mi | 4/1.0 | 1,461 (-5%) | 3mo | $177,500 | $121 | 70 |
| 2318 E 11th St | 0.49mi | 4/1.0 | 1,456 (-5%) | 1mo | $204,400 | $140 | 66 |
| 2220 E 13th St | 0.53mi | 3/2.5 (-1) | 1,558 (+1%) | 3mo | $320,000 | $205 | 62 |
| 1106 Arthur Ave | 0.32mi | 3/1.0 (-1) | 1,414 (-8%) | 5mo | $153,000 | $108 | 61 |
| 618 Arthur Ave | 0.49mi | 4/3.0 | 1,599 (+4%) | 7mo | $265,000 | $166 | 58 |
| 2015 York St | 0.67mi | 3/1.0 (-1) | 1,492 (-3%) | 2mo | $130,000 | $87 | 56 |
| 414 E Sheridan Ave | 0.57mi | 3/1.5 (-1) | 1,456 (-5%) | 5mo | $95,000 | $65 | 55 |
| 3215 E 8th St | 0.30mi | 3/1.0 (-1) | 1,368 (-11%) | 7mo | $189,000 | $138 | 55 |
| 2315 E 13th St | 0.48mi | 3/2.0 (-1) | 1,346 (-12%) | 1mo | $183,500 | $136 | 49 |
| 1514 Guthrie Ave | 0.58mi | 3/1.0 (-1) | 1,344 (-12%) | 2mo | $162,000 | $121 | 44 |
Match score weights: distance 35% · size 25% · config 20% · recency 20%. Top-matched comps best support the ARV.
Projected returns pro-forma
-3.0% appreciation · 3.0% rent growth · sell at horizon
- IRR
- -13.8%
- Equity multiple
- 0.51×
- Total profit
- $-24,238
- Equity at exit
- $26,078
- IRR
- -4.9%
- Equity multiple
- 0.68×
- Total profit
- $-15,642
- Equity at exit
- $15,122
Cash invested: $48,972 (down + closing). Projections, not guarantees.
Landlord ↔ Tenant lean methodology
- Overall (STATE)
- 83 Strongly Landlord-Friendly
- State Iowa
- 83 Strongly Landlord-Friendly · R+6
- County
- — inherits STATE
- City
- — inherits STATE
ZIP-level market 50316
- Home prices YoY
- -29.5%
- Active inventory
- 106
- Price-to-rent
- 8.6×
Monthly cashflow live
- Estimated rent
- $1,691 medium interval (Pro) →
- Mortgage (P&I)
- −$917
- Tax from tax record
- −$283 /mo · $3,392/yr
- Insurance
- −$73
- HOA
- −$0
- Vacancy / Maint / Mgmt
- −$355
- Net cashflow
- $63
Break-even live
Sensitivity live
| Price | -10% $162 | -5% $113 | +0% $63 | +5% $14 | +10% $-36 |
|---|---|---|---|---|---|
| Rent | -10% $-70 | -5% $-3 | +0% $63 | +5% $130 | +10% $197 |
| Rate | -1.0pp $151 | -0.5pp $108 | base $63 | +0.5pp $18 | +1.0pp $-28 |
UW: 25.0% down · 7.5% · 30yr · 1.5% tax · 5.0% vac · 8.0% maint · 8.0% mgmt
Financing live
Cash to close
- Down payment
- $43,725
- Closing costs
- $5,247
- Reserves months
- —
- Total cash needed
- —
Loan-product check · same deal, 3 products live
Conventional
25% down · 7.5% · 30yr
- Down + closing
- —
- Monthly P&I
- —
- Monthly cashflow
- —
- DSCR
- —
- Eligible?
- —
Personal DTI + credit; lowest rate.
DSCR
20% down · 8.5% · 30yr
- Down + closing
- —
- Monthly P&I
- —
- Monthly cashflow
- —
- DSCR
- —
- Eligible?
- —
No personal income docs; deal must DSCR.
Hard money
10% down · 12.0% · 12mo
- Down + closing
- —
- Monthly P&I
- —
- Monthly cashflow
- —
- DSCR
- —
- Eligible?
- —
Short-term bridge; refi at stabilization.
Rent comps 4 comps
| Address | Beds | Baths | Sqft | Rent | $/sqft | DOM | Units | Dist |
|---|---|---|---|---|---|---|---|---|
| 2901 2nd Ave Des Moines, IA | 5.0 | 2.0 | 1308 | $1,850 | $1.41 | 16d | 1 | 0.86mi |
| 915 E Washington Ave Des Moines, IA | 3.0 | 1.0 | 1457 | $1,450 | $1.00 | 25d | 1 | 1.01mi |
| 1530 E 14th St Des Moines, IA | 3.0 | 2.0 | 1428 | $1,900 | $1.33 | 16d | 1 | 1.01mi |
| 3410 5th Ave Des Moines, IA | 4.0 | 2.0 | 1474 | $1,550 | $1.05 | 45d | 1 | 1.12mi |
Listing history 7 events
-
2026-04-30status Pending
-
2026-04-14$174,900 Active
-
2016-06-07soldstatus $125,000
-
2016-05-31soldstatus $125,000 98-char remark
Show marketing remark (98 chars)
Spacious 4 bedroom home. Main floor laundry with half bath. 2 car detached garage. Contract terms.
-
2016-05-07$125,000 98-char remark
Show marketing remark (98 chars)
Spacious 4 bedroom home. Main floor laundry with half bath. 2 car detached garage. Contract terms.
-
2014-01-30soldstatus $50,000 251-char remark
Show marketing remark (251 chars)
Lots of square footage here. Come see what this home has to offer-- first floor laundry with half bathroom with Full Bathroom upstairs with 4 bedrooms and a 2 car detached garage. Needs some updates but priced to sell so why not build your own equity.
-
2013-11-12$54,900 251-char remark
Show marketing remark (251 chars)
Lots of square footage here. Come see what this home has to offer-- first floor laundry with half bathroom with Full Bathroom upstairs with 4 bedrooms and a 2 car detached garage. Needs some updates but priced to sell so why not build your own equity.
ⓘ Source: listings_history table (triggers on properties + properties_extension) + one-shot
backfill from property_details.listing_events for pre-trigger history.
Tax reassessment forecast IA · Partial reset (capped growth)
- Current annual tax
- $3,392 · $283/mo
- Projected year-2 tax
- $3,392 · $283/mo
- Expected delta
- $0/yr ($0/mo · 0.0%)
ⓘ Screening estimate from a state-policy table — verify with the county assessor before closing.
Climate risk First Street
- Flood 1/10 Low FEMA zone X (unshaded) · 0% chance over 30 yrs
- Wildfire 1/10 Low
- Heat 3/10 Moderate 7 d/yr ≥103°F today · 15 d/yr by 30 yrs out
- Wind 2/10 Low
- Air quality 2/10 Low 1 unhealthy d/yr today · 2 by 30 yrs out
Nearby sold comps map
Loading sold comps map…
Walkable amenities ~0.75 mi
Loading nearby amenities…
Taxation est. · year 1
- Rental income
- $20,296
- − Mortgage interest
- −$9,797
- − Property taxes
- −$3,392
- − Insurance
- −$874
- − Repairs & maintenance
- −$1,624
- − Management
- −$1,624
- − Depreciation
- −$5,088
- Taxable loss
- −$2,103
- Est. tax savings @ 24.0%
- +$505
- After-tax cash flow
- $1,266/yr
For passive investors: Depreciation is non-cash, so a rental often shows a tax loss while cash-flowing — sheltering income. Rental losses are passive: they offset passive income freely, and up to $25,000/yr can offset ordinary (W-2) income if you actively participate and your MAGI is under $100k (phasing out to $0 by $150k); unused losses carry forward. On sale, claimed depreciation is recaptured at up to 25%, and gains may owe capital-gains tax (a 1031 exchange can defer both). Figures are a year-1 estimate at your 24.0% rate — not tax advice; consult a CPA.
Schools (NCES district)
- District
- Des Moines Independent Community School District
- NCES district ID
- 1908970
- Math proficiency
- 43% ▼ -6.00%
- Reading proficiency
- 46% ▼ -1.00%
- Median HH income
- $45,905
- Composite
- 37.83/100
- National rank
- #4331
- State rank
- #289 of 289 in IA
Livability — Des Moines
- Score
- 81/100
- State rank
- #63
- US rank
- #1432
Category grades
Schools grade is shown separately in the Schools card above.
Census & demographics
- Census place
- Des Moines, IA
- City population
- 203,612
- Population (ZIP)
- 16,188
Population outlook (Polk County) Hauer SSP2
- Today (2025)
- 548,042 people
- By 2030
- 588,557 · +7.4%
- By 2040
- 670,629 · +22.4%
- By 2050
- 752,830 · +37.4%
- By 2075
- 955,069 · +74.3%
- By 2100
- 1,115,436 · +103.5%
Race, ethnicity, and origin ACS 2023
- Neighborhood character
- Diverse neighborhood (Simpson 0.68)
- Race & ethnicity
- White 48% Hispanic / Latino 27% Black 12% Two or more races 12% Asian 7% Native American 1%
- Hispanic origin (detail)
- Mexican 21% Puerto Rican 1%
- Common ancestry
- Portuguese 2% Slovak 1% Iranian 1%
- Foreign-born
- 16% · Canada, Vietnam, Philippines
- Languages at home
- 69% English-only · Spanish 20% Other Asian/Pacific 3% Vietnamese 2%
Political lean MEDSL · Polk
- 2024 margin
- D (+10.9) · D 54.8% · R 43.9% · Other 1.3%
- 2008→2024 swing
- -3.7pp toward R · 2008: 14.6pp · 2024: 10.9pp
- All cycles
- 2024: D+10.9 2020: D+15.2 2016: D+11.5 2012: D+14.2 2008: D+14.6
Not yet ingested
- Civics
- —
Market trends
- HPI YoY
- ▼ -121.34%
- Current HPI
- 290.3838
- Rent YoY
- —
- Metro
- —
- State GDP YoY
- ▲ 2.48%
- F500 in state
- 4
Industry mix (Fortune 500 HQ in IA)
| Industry | F500 HQs | Revenue |
|---|---|---|
| Financial Services | 1 | $16B |
|
||
| Retail / Convenience | 1 | $15B |
|
||
Price history
+218.6% since first listed7 events — show timeline
- 2026-04-30 Pending — DMMLS
- 2026-04-14 Listed $174,900 DMMLS
- 2016-06-07 Sold (Public Records) $125,000 Public Records
- 2016-05-31 Sold (MLS) $125,000 DMMLS
- 2016-05-07 Listed $125,000 DMMLS
- 2014-01-30 Sold (MLS) $50,000 DMMLS
- 2013-11-12 Listed $54,900 DMMLS
Property tax history
+3.7%/yrLatest (2025): $3,392 · +2.0% YoY. Source: county tax records.
Cash-flow waterfall
monthlySold comps — $/sqft
last 12 mo · ≤1 miLoading sold comps…