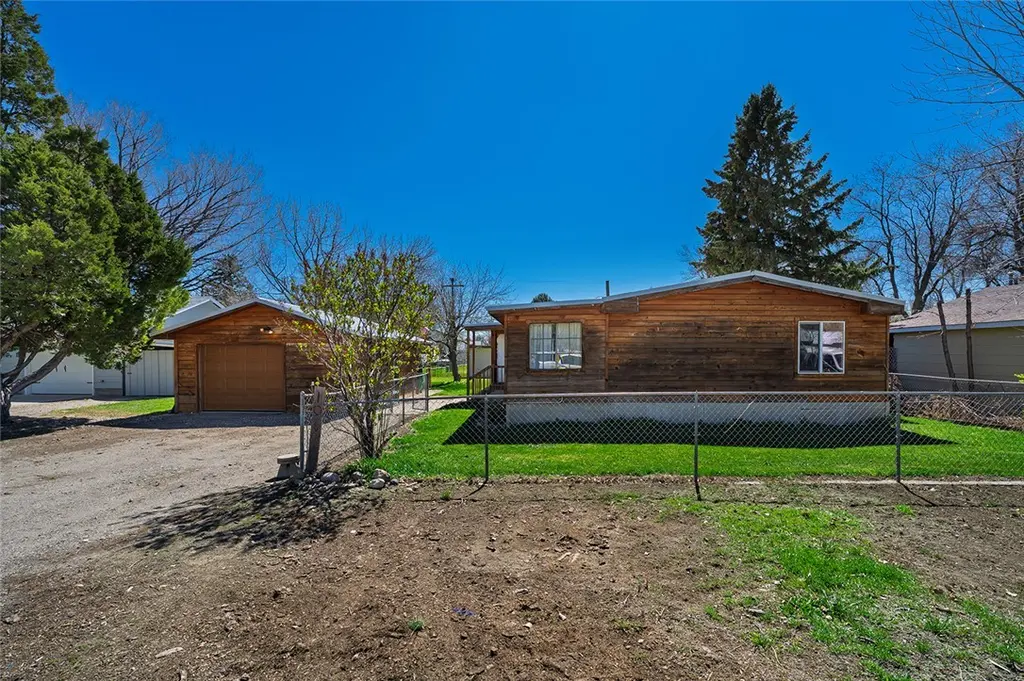
106 1st Ave Ave SE · Park City, MT
Flood risk 1/10 · Minimal
- FEMA flood zone
- X (unshaded)
- Chance of flooding over 30 yrs
- 0.0%
- Est. flood insurance / yr
- $507 – $1,088
Fire risk 3/10 · Minor
- Est. fire insurance / yr
- $918 – $1,706
Heat risk 3/10 · Minor
- Hot days now (above 94°F)
- 7 days/yr
- Hot days in 30 yrs
- 15 days/yr
Wind risk 1/10 · Minimal
- Chance of severe wind over 30 yrs
- —
Air-quality risk 4/10 · Minor
- Unhealthy air days now
- 3 days/yr
- Unhealthy air days in 30 yrs
- 5 days/yr
Risk factors via First Street. Map © Google.
Why this score? — see what drove the C grade
The composite is a weighted blend of 9 inputs, each scored 0–100. Each bar is that input's sub-score; the figure is the points it added to the 100-point composite (weight × sub-score).
- Cash flow +20.5/30.0
- ARV discount +15.0/15.0
- DSCR +6.5/10.0
- 1% rule +5.4/10.0
- Livability +3.5/5.0
- Schools +2.9/10.0
- Condition / age +2.8/5.0
- Rent growth +2.5/5.0
- Appreciation +0.0/10.0
$199,900
🖨 Deal sheet 📄 Offer letter ✓ Due diligence
Key facts
- Built-in cabinetry
- Private bath
- Bay window
Tags
Property features AI
Exterior
- Parking: Detached garage with one covered garage space (1-car)
- Utilities: Well water; Public sewer
- Home design: Manufactured single-family home; One story
- Construction: Wood siding; Metal roof
- Exterior features: Covered patio; Fenced yard; Shed(s)
Interior
- Kitchen: Electric range, oven, cooktop, refrigerator
- Bedrooms: Three main-level bedrooms
- Bathrooms: Two full bathrooms (both on the main level)
- Heating & cooling: Central air conditioning; Natural gas forced-air heating
- Interior features: Electric range, oven, cooktop, refrigerator; Eight total rooms; No basement
Neighborhood map
What this means for you Summary
Snapshot
- This is a 3-bed/2.0-bath manufactured listed at $200k. Condition is rated average.
Deal economics
- At list price, monthly cash flow is $263 ($3k/yr) — positive.
- The deal already cash-flows at list — no discount required.
- Meets the 1% rule at list price ($2k rent vs $200k).
- Recommended offer: $188k (6.0% below list) — sets the bar for market timing.
Location & tenants
- Location reads 69/100 on livability (#86 in MT) — a middle-class / working-renter tenant base. Strengths: crime A+, cost of living A+, housing A+; Watch: health & safety C-, amenities F, commute F.
- Park City Elementary (rural): math 25% / reading 30% proficiency, ranked #216 of 339 in MT (top 64%) — low school quality limits family demand, transient renter base, plan for 1-2y turnover; only 19% free/reduced lunch — higher-income household profile.
- Zoned schools: Park City School (math 27% / reading 42%, grade F, #197 of 293 statewide, top 71%, 174 students, 0% FRL); Park City 7-8 (math 24% / reading 34%, grade F, #106 of 146 statewide, top 77%, 50 students, 0% FRL) — zoned schools average 0% FRL vs 19% district-wide (19 pts lower); this property's tenant base skews higher-income than the district average.
- Market conditions: 18 active listings in the ZIP; 3 units permitted in Stillwater County in 2024 (0 in 5+ unit buildings).
Forward outlook
- Local home prices are declining (-3.0%/yr); year-one equity from $1k of loan paydown is wiped out by about $6k of value loss. Plan a longer hold.
- Stillwater County population projected at +14% by 2050 — modest demand growth; plan on rents tracking national, not racing it.
Negotiation context
- It's been on market 70 days — a 6% lower offer ($188k) is reasonable based on typical stale-listing flexibility.
- 2 sale attempts with the ask held roughly flat each time — persistent listings suggest the price (not the market) is what's stuck; bring a comps-based counter.
Questions for the listing agent
- It's been on market 70 days. Have you received any prior offers? Is the seller open to a 6% concession, seller financing, or rate buy-down credit?
- Built in 1977 — when were the roof, HVAC, electrical panel, plumbing, and water heater last replaced?
- Why hasn't it sold? Are there any deal-killer items the seller is aware of (foundation, flood, title, zoning, code violations)?
- Is there a deadline driving the sale (1031 exchange, divorce, estate, relocation)? That informs how much negotiation room exists.
- What's the average days-on-market for RENTAL listings here right now (not sales)? A rising rental-DOM trend means longer vacancies and softer asking-rent achievability than the comps imply.
- What's the recent tenant-quality profile in this submarket — average credit score on applications, eviction rate, late-payment / NSF rate, and stable-employment percentage? A property-management company in the area should have these aggregated.
- How much new for-sale + rental construction is in the pipeline within 1–3 miles? Heavy new supply typically softens prices + rents 12–24 months out; constrained supply supports both.
Investment metrics
- 1% rule
- 1.04% ✓
- Cap rate
- 7.87%
- Cash-on-cash
- 5.63%
- DSCR
- 1.25
- GRM
- 8.0
CMA / ARV
- ARV (on-the-fly)
- $390,240
- Comps found
- 1
Show comp detail 1 sale within ~0.75 mi
| Address | Dist | Beds/Ba | Sqft | Sold | Price | $/sf | Match |
|---|---|---|---|---|---|---|---|
| 502 7th ST St SW | 0.64mi | 3/2.0 | 1,400 (-3%) | 10mo | $379,000 | $271 | 57 |
Match score weights: distance 35% · size 25% · config 20% · recency 20%. Top-matched comps best support the ARV.
Projected returns pro-forma
-3.0% appreciation · 3.0% rent growth · sell at horizon
- IRR
- -7.6%
- Equity multiple
- 0.72×
- Total profit
- $-15,630
- Equity at exit
- $29,806
- IRR
- 2.0%
- Equity multiple
- 1.14×
- Total profit
- $8,060
- Equity at exit
- $17,284
Cash invested: $55,972 (down + closing). Projections, not guarantees.
Landlord ↔ Tenant lean methodology
- Overall (STATE)
- 82 Strongly Landlord-Friendly
- State Montana
- 82 Strongly Landlord-Friendly · R+11
- County
- — inherits STATE
- City
- — inherits STATE
ZIP-level market 59063
- Home prices YoY
- -13.5%
- Active inventory
- 18
- Price-to-rent
- 8.0×
Monthly cashflow live
- Estimated rent
- $2,081 medium interval (Pro) →
- Mortgage (P&I)
- −$1,048
- Tax est. 1.5%
- −$250 /mo · $2,998/yr
- Insurance
- −$83
- HOA
- −$0
- Vacancy / Maint / Mgmt
- −$437
- Net cashflow
- $263
Break-even live
UW: 25.0% down · 7.5% · 30yr · 1.5% tax · 5.0% vac · 8.0% maint · 8.0% mgmt
Financing live
Cash to close
- Down payment
- $49,975
- Closing costs
- $5,997
- Reserves months
- —
- Total cash needed
- —
Loan-product check · same deal, 3 products live
Conventional
25% down · 7.5% · 30yr
- Down + closing
- —
- Monthly P&I
- —
- Monthly cashflow
- —
- DSCR
- —
- Eligible?
- —
Personal DTI + credit; lowest rate.
DSCR
20% down · 8.5% · 30yr
- Down + closing
- —
- Monthly P&I
- —
- Monthly cashflow
- —
- DSCR
- —
- Eligible?
- —
No personal income docs; deal must DSCR.
Hard money
10% down · 12.0% · 12mo
- Down + closing
- —
- Monthly P&I
- —
- Monthly cashflow
- —
- DSCR
- —
- Eligible?
- —
Short-term bridge; refi at stabilization.
Listing history 20 events
-
2026-06-19days on market $199,900 Active 70 DOM
-
2026-06-18days on market $199,900 Active 69 DOM
-
2026-06-17days on market $199,900 Active 68 DOM
-
2026-06-16days on market $199,900 Active 67 DOM
-
2026-06-15days on market $199,900 Active 66 DOM
-
2026-06-14days on market $199,900 Active 64 DOM
-
2026-06-13days on market $199,900 Active 63 DOM
-
2026-06-10days on market $199,900 Active 61 DOM
-
2026-06-09days on market $199,900 Active 60 DOM
-
2026-06-08days on market $199,900 Active 59 DOM
-
2026-06-07days on market $199,900 Active 58 DOM
-
2026-06-05days on market $199,900 Active 55 DOM
-
2026-06-03days on market $199,900 Active 54 DOM
-
2026-06-02days on market $199,900 Active 53 DOM
-
2026-06-01days on market $199,900 Active 52 DOM
-
2026-05-31days on market $199,900 Active 51 DOM
-
2026-05-30days on market $199,900 Active 50 DOM
-
2026-05-12status Active
-
2026-04-27historical Active Under Contract
-
2026-04-10$199,900 Active
ⓘ Source: listings_history table (triggers on properties + properties_extension) + one-shot
backfill from property_details.listing_events for pre-trigger history.
Climate risk First Street
- Flood 1/10 Low FEMA zone X (unshaded) · 0% chance over 30 yrs
- Wildfire 3/10 Moderate
- Heat 3/10 Moderate 7 d/yr ≥94°F today · 15 d/yr by 30 yrs out
- Wind 1/10 Low
- Air quality 4/10 Moderate 3 unhealthy d/yr today · 5 by 30 yrs out
Nearby sold comps map
Loading sold comps map…
Walkable amenities ~0.75 mi
Loading nearby amenities…
Taxation est. · year 1
- Rental income
- $24,974
- − Mortgage interest
- −$11,198
- − Property taxes
- −$2,998
- − Insurance
- −$1,000
- − Repairs & maintenance
- −$1,998
- − Management
- −$1,998
- − Depreciation
- −$5,815
- Taxable loss
- −$32
- Est. tax savings @ 24.0%
- +$8
- After-tax cash flow
- $3,160/yr
For passive investors: Depreciation is non-cash, so a rental often shows a tax loss while cash-flowing — sheltering income. Rental losses are passive: they offset passive income freely, and up to $25,000/yr can offset ordinary (W-2) income if you actively participate and your MAGI is under $100k (phasing out to $0 by $150k); unused losses carry forward. On sale, claimed depreciation is recaptured at up to 25%, and gains may owe capital-gains tax (a 1031 exchange can defer both). Figures are a year-1 estimate at your 24.0% rate — not tax advice; consult a CPA.
Condition & rehab AI · 13 photos
This manufactured home has average condition with minor repairs needed. Painting and updating the exterior and interior can significantly enhance its value.
Repairs flagged
- Minor Wood siding — Weathered and discolored
- Minor Roof — Aged appearance
Value-add opportunities
- Both Paint interior walls — Fresh paint enhances curb appeal and interior aesthetics
- Both Replace worn flooring — New flooring improves comfort and value
- Both Paint exterior siding — Fresh paint improves curb appeal and value
- Both Replace worn roof — A new roof enhances structural integrity and value
Renovation cost estimate screening
| Repair item | Severity | Est. cost |
|---|---|---|
| Wood siding · Weathered and discolored | Minor | $500–3,000 |
| Roof · Aged appearance | Minor | $500–3,000 |
| Total estimated repair cost · 2 items | $1,000–6,000 |
Value-add ROI direction
- Both Paint interior walls — Fresh paint enhances curb appeal and interior aesthetics ↑
- Both Replace worn flooring — New flooring improves comfort and value ↑
- Both Paint exterior siding — Fresh paint improves curb appeal and value ↑
- Both Replace worn roof — A new roof enhances structural integrity and value ↑
ⓘ Cost ranges are severity-bucket heuristics (US national rule-of-thumb). Get contractor quotes + a written scope before underwriting a rehab budget.
Schools (NCES district)
- District
- Park City Elementary
- NCES district ID
- 3020040
- Math proficiency
- 25% ▲ 5.00%
- Reading proficiency
- 30% ▲ 5.00%
- Median HH income
- $65,311
- Composite
- 28.52/100
- National rank
- #12082
- State rank
- #216 of 339 in MT
Livability — Park City
- Score
- 69/100
- State rank
- #86
- US rank
- #8517
Category grades
Schools grade is shown separately in the Schools card above.
Census & demographics
- Census place
- Park City, MT
- Population (ZIP)
- 2,055
Population outlook (Stillwater County) Hauer SSP2
- Today (2025)
- 10,308 people
- By 2030
- 10,674 · +3.6%
- By 2040
- 11,239 · +9.0%
- By 2050
- 11,768 · +14.2%
- By 2075
- 13,680 · +32.7%
- By 2100
- 15,218 · +47.6%
Race, ethnicity, and origin ACS 2023
- Neighborhood character
- Predominantly White (93%)
- Race & ethnicity
- White 93% Two or more races 4% Hispanic / Latino 4%
- Common ancestry
- Portuguese 6% Iranian 3% Lithuanian 2%
- Languages at home
- 98% English-only · French/Haitian/Cajun 1%
Political lean MEDSL · Stillwater
- 2024 margin
- Solid R (+61.7) · D 17.9% · R 79.6% · Other 2.6%
- 2008→2024 swing
- -30.0pp toward R · 2008: -31.7pp · 2024: -61.7pp
- All cycles
- 2024: R+61.7 2020: R+57.6 2016: R+56.6 2012: R+44.5 2008: R+31.7
Not yet ingested
- Civics
- —
Market trends
- HPI YoY
- ▼ -42.37%
- Current HPI
- 271.631
- Rent YoY
- —
- Metro
- —
- State GDP YoY
- ▲ 3.41%
- F500 in state
- 2
Industry mix (Fortune 500 HQ in MT)
| Industry | F500 HQs | Revenue |
|---|---|---|
| Technology / Analytics | 1 | $2B |
|
||
Price history
3 events — show timeline
- 2026-05-12 Relisted — BMTMLS
- 2026-04-27 Contingent — BMTMLS
- 2026-04-10 Listed $199,900 BMTMLS
Cash-flow waterfall
monthlySold comps — $/sqft
last 12 mo · ≤1 miLoading sold comps…