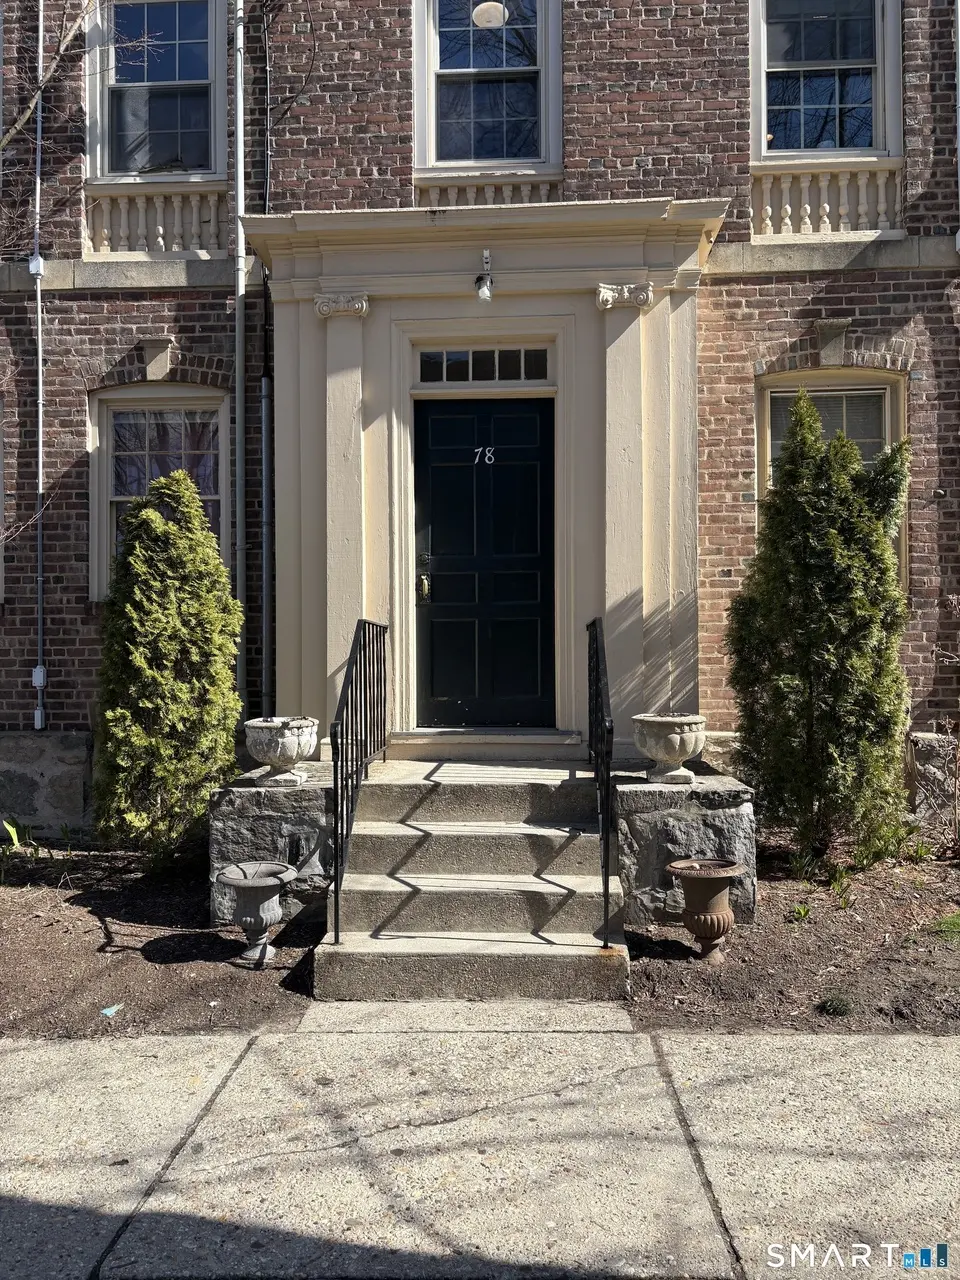
78 Haddon St #1 · Bridgeport, CT
Flood risk 1/10 · Minimal
- FEMA flood zone
- X (unshaded)
- Chance of flooding over 30 yrs
- 0.0%
- Est. flood insurance / yr
- $507 – $1,088
Fire risk 1/10 · Minimal
- Est. fire insurance / yr
- $829 – $1,539
Heat risk 6/10 · Moderate
- Hot days now (above 97°F)
- 7 days/yr
- Hot days in 30 yrs
- 15 days/yr
Wind risk 6/10 · Moderate
- Chance of severe wind over 30 yrs
- 65.0%
Air-quality risk 4/10 · Minor
- Unhealthy air days now
- 5 days/yr
- Unhealthy air days in 30 yrs
- 7 days/yr
Risk factors via First Street. Map © Google.
Why this score? — see what drove the C- grade
The composite is a weighted blend of 9 inputs, each scored 0–100. Each bar is that input's sub-score; the figure is the points it added to the 100-point composite (weight × sub-score).
- Cash flow +19.2/30.0
- 1% rule +10.0/10.0
- ARV discount +7.5/15.0
- DSCR +6.1/10.0
- Livability +4.0/5.0
- Rent growth +3.0/5.0
- Condition / age +2.8/5.0
- Schools +1.2/10.0
- Appreciation +0.0/10.0
$142,900
🖨 Deal sheet (PDF) 📄 Offer letter ✓ Due diligence
Listing remarks
Vibrant Black Rock community convenient to all. Unusually large square footage. Convenient 1st floor end unit. In need of updates but generally in good condition. Great opportunity to refresh to your taste.
Key facts
- $598 HOA
- Built 1918
- Listed 44 days
Property features AI
Finance
- Other: 216 total units in the complex; Nearby amenities include library, medical facilities, park, public transportation, shopping/mall and walk to bus lines
- HOA & community: Monthly association fee; Association includes grounds maintenance, trash pickup, heat, hot water, water, property management, insurance and taxes; Community gardening area; Professional off-site property management; Pets allowed with restrictions (per board)
Exterior
- Utilities: Public water connected; Public sewer connected; Natural gas
- Home design: Co-op unit (Condo/Co-Op for sale); Located in Black Rock Gardens Cooperative; End unit
- Construction: Brick construction
- Exterior features: Brick siding; Sidewalk; Porch; Level lot; Walk to water, beach rights and water community access
Interior
- Kitchen: Gas range; Refrigerator; Dishwasher
- Bedrooms: 2 bedrooms
- Bathrooms: 1 full bathroom
- Heating & cooling: Radiator heat (natural gas)
- Interior features: Full, unfinished basement with storage; 1 level unit; 5 total rooms
- Laundry & utility: Washer; Dryer; Natural gas domestic hot water
Neighborhood map
What this means for you Summary
Snapshot
- This is a 2-bed/1.0-bath condo listed at $143k. Condition is rated average.
Deal economics
- At list price, monthly cash flow is $156 ($2k/yr) — positive.
- The deal already cash-flows at list — no discount required.
- Meets the 1% rule at list price ($2k rent vs $143k).
- Recommended offer: $139k (3.0% below list) — sets the bar for market timing.
- Cap rate 7.6% vs local median 4.6% in Bridgeport — top-decile yield for the area; either an underpriced asset or a hidden risk that comps aren't pricing in. Stress-test before assuming the spread holds.
Location & tenants
- Location reads 81/100 on livability (#15 in CT, #1,374 nationally) — a professional / high-income tenant draw. Strengths: amenities A+, commute A+, health & safety A+; Watch: crime C-, employment D+, schools D-.
- Bridgeport School District (urban): math 9% / reading 19% proficiency, ranked #151 of 153 in CT (top 99%) — low school quality limits family demand, transient renter base, plan for 1-2y turnover; 97% free/reduced lunch — lower-income household profile, screen leases tightly.
- Market conditions: Rents rising (+1.8%/yr); 47 active listings in the ZIP; 40 comparable units currently listed for rent nearby; rentals at typical pace (median 25d on market — plan ~3-4 weeks tenant-placement turnaround); 42% of comp listings sitting > 30 days — soft ceiling on asking rent; 852 units permitted in Greater Bridgeport Planning Region in 2024 (698 in 5+ unit buildings).
- At $2,204/mo this rent would consume 47% of the median local household income ($56k/yr) (locally 2367% of renters already pay >50% of income on rent) — very limited rent-growth headroom before tenants either downsize or default.
Forward outlook
- Local home prices are declining (-3.0%/yr); year-one equity from $988 of loan paydown is wiped out by about $4k of value loss. Plan a longer hold.
Negotiation context
- It's been on market 44 days — a 3% lower offer ($139k) is reasonable based on typical stale-listing flexibility.
Risks & watch-outs
- Watch-outs: HOA is 27% of rent; built in 1918 — expect roof / HVAC / electrical / plumbing capex.
- Climate carrying-cost: major wind risk, 65% chance of damaging wind over 30y; extreme-heat days projected 7→15/yr by 2055 (HVAC capex compounding) — expect insurance premiums to compound above CPI over the hold.
Questions for the listing agent
- It's been on market 44 days. Have you received any prior offers? Is the seller open to a 3% concession, seller financing, or rate buy-down credit?
- Built in 1918 — when were the roof, HVAC, electrical panel, plumbing, and water heater last replaced?
- What does the HOA fee cover, when was the last increase, and are there any pending special assessments or reserve-fund shortfalls?
- Any open or pending special assessments — roof, HVAC, plumbing, elevator, façade? What's the per-unit balance and payoff schedule, and is the seller paying it off at close or rolling it to the buyer?
- Is there a deadline driving the sale (1031 exchange, divorce, estate, relocation)? That informs how much negotiation room exists.
- Schools are D-rated, which usually means shorter tenancies and higher turnover. Who's the typical renter profile here, and what's been the actual vacancy rate?
- What's the average days-on-market for RENTAL listings here right now (not sales)? A rising rental-DOM trend means longer vacancies and softer asking-rent achievability than the comps imply.
- What's the recent tenant-quality profile in this submarket — average credit score on applications, eviction rate, late-payment / NSF rate, and stable-employment percentage? A property-management company in the area should have these aggregated.
- How much new apartment / multifamily construction is in the pipeline within 1–3 miles? Heavy new supply (>2% of stock underway) typically softens rents 12–24 months out; light construction supports rent growth.
Investment metrics
- 1% rule
- 1.54% ✓
- Cap rate
- 7.60%
- Cash-on-cash
- 4.67%
- DSCR
- 1.21
- GRM
- 5.4
CMA / ARV
No comps found within radius.
Projected returns pro-forma
-3.0% appreciation · 1.81% rent growth · sell at horizon
- IRR
- -10.8%
- Equity multiple
- 0.61×
- Total profit
- $-15,453
- Equity at exit
- $21,307
- IRR
- -3.9%
- Equity multiple
- 0.76×
- Total profit
- $-9,516
- Equity at exit
- $12,355
Cash invested: $40,012 (down + closing). Projections, not guarantees.
Landlord ↔ Tenant lean methodology
- Overall (STATE)
- 27 Tenant-Leaning
- State Connecticut
- 27 Tenant-Leaning · D+7
- County
- — inherits STATE
- City
- — inherits STATE
ZIP-level market 06605
- Home prices YoY
- -14.5%
- Rents YoY
- 1.8%
- Active inventory
- 47
- Price-to-rent
- 5.4×
Monthly cashflow live
- Estimated rent
- $2,204 high interval (Pro) →
- Mortgage (P&I)
- −$749
- Tax est. 1.5%
- −$179 /mo · $2,144/yr
- Insurance
- −$60
- HOA
- −$598
- Vacancy / Maint / Mgmt
- −$463
- Net cashflow
- $156
Break-even live
Sensitivity live
| Price | -10% $254 | -5% $205 | +0% $156 | +5% $106 | +10% $57 |
|---|---|---|---|---|---|
| Rent | -10% $-19 | -5% $69 | +0% $156 | +5% $243 | +10% $330 |
| Rate | -1.0pp $228 | -0.5pp $192 | base $156 | +0.5pp $119 | +1.0pp $81 |
UW: 25.0% down · 7.5% · 30yr · 1.5% tax · 5.0% vac · 8.0% maint · 8.0% mgmt
Financing live
Cash to close
- Down payment
- $35,725
- Closing costs
- $4,287
- Reserves months
- —
- Total cash needed
- —
Loan-product check · same deal, 3 products live
Conventional
25% down · 7.5% · 30yr
- Down + closing
- —
- Monthly P&I
- —
- Monthly cashflow
- —
- DSCR
- —
- Eligible?
- —
Personal DTI + credit; lowest rate.
DSCR
20% down · 8.5% · 30yr
- Down + closing
- —
- Monthly P&I
- —
- Monthly cashflow
- —
- DSCR
- —
- Eligible?
- —
No personal income docs; deal must DSCR.
Hard money
10% down · 12.0% · 12mo
- Down + closing
- —
- Monthly P&I
- —
- Monthly cashflow
- —
- DSCR
- —
- Eligible?
- —
Short-term bridge; refi at stabilization.
Rent comps 40 comps
| Address | Beds | Baths | Sqft | Rent | $/sqft | DOM | Units | Dist |
|---|---|---|---|---|---|---|---|---|
| 2806 Fairfield Ave Unit 301 Bridgeport, CT | 1.0 | 1.0 | 750 | $1,995 | $2.66 | 45d | 1 | 0.02mi |
| 2806 Fairfield Ave Unit 103 Bridgeport, CT | 1.0 | 1.0 | 600 | $1,895 | $3.16 | 45d | 1 | 0.02mi |
| 41 Alfred St Unit 3rd Floor Bridgeport, CT | 2.0 | 1.0 | 1000 | $1,800 | $1.80 | 25d | 1 | 0.05mi |
| 168 Alfred St Unit 1 Bridgeport, CT | 2.0 | 1.0 | 882 | $2,200 | $2.49 | 25d | 1 | 0.16mi |
| 305 Ellsworth St Unit 21-F Bridgeport, CT | 1.0 | 1.0 | 750 | $2,015 | $2.69 | 25d | 1 | 0.18mi |
| 59 Hanford Ave Unit 1 Bridgeport, CT | 1.0 | 1.0 | 648 | $2,000 | $3.09 | 16d | 1 | 0.23mi |
| 77-79 Hanford Ave Bridgeport, CT | 2.0 | 1.0 | 760 | $2,150 | $2.83 | 25d | 1 | 0.24mi |
| 306 Canfield Ave Bridgeport, CT | 2.0 | 1.0–2.0 | 853 | $3,428 | $4.02 | 0d | 18 | 0.25mi |
| 220 King St Bridgeport, CT | 2.0 | 1.0 | 750 | $2,300 | $3.07 | 5d | 1 | 0.26mi |
| 518 Midland St Bridgeport, CT | 2.0 | 1.0 | 778 | $2,050 | $2.63 | 13d | 1 | 0.26mi |
| 158 Scofield Ave Unit 3rd floor Bridgeport, CT | 1.0 | 1.0 | 835 | $1,600 | $1.92 | 16d | 1 | 0.28mi |
| 575 Ellsworth St Bridgeport, CT | 1.0 | 1.0 | 580 | $1,975 | $3.40 | 45d | 5 | 0.28mi |
| 585 Ellsworth St Bridgeport, CT | 1.0 | 1.0 | 650 | $1,995 | $3.07 | 45d | 2 | 0.29mi |
| 124 Harborview Ave Bridgeport, CT | 2.0 | 1.0 | 1040 | $2,300 | $2.21 | 45d | 1 | 0.30mi |
| 77 Crowther Ave Bridgeport, CT | 1.0 | 1.0 | 650 | $1,900 | $2.92 | 45d | 1 | 0.32mi |
| 206 Scofield Ave Bridgeport, CT | 2.0 | 1.0 | 1100 | $2,200 | $2.00 | 45d | 1 | 0.32mi |
| 764 Ellsworth St Unit 3 Bridgeport, CT | 2.0 | 1.0 | 1060 | $1,700 | $1.60 | 45d | 1 | 0.46mi |
| 1401 Kings Hwy Fairfield, CT | 2.0 | 1.0–2.0 | 779 | $3,172 | $4.07 | 4d | 23 | 0.54mi |
| 202 Pearsall Pl Unit NA Bridgeport, CT | 2.0 | 1.5 | 1000 | $3,500 | $3.50 | 5d | 1 | 0.60mi |
| 528 Black Rock Tpke Unit 108 Fairfield, CT | 2.0 | 1.0 | 1000 | $2,700 | $2.70 | 45d | 1 | 0.78mi |
| 84 Sunnyridge Ave Fairfield, CT | 2.0 | 1.5 | 1032 | $3,395 | $3.29 | 23d | 1 | 0.79mi |
| 45 Biro St Unit 1 Fairfield, CT | 1.0 | 1.0 | 660 | $1,950 | $2.95 | 45d | 1 | 0.81mi |
| 123 Longview Ave Fairfield, CT | 3.0 | 1.5 | 1107 | $3,500 | $3.16 | 45d | 1 | 0.85mi |
| 63 Churchill St Fairfield, CT | 1.0 | 1.0 | 700 | $1,975 | $2.82 | 45d | 1 | 0.85mi |
| 105 Churchill St Fl (107) Fairfield, CT | 2.0 | 1.0 | 711 | $2,800 | $3.94 | 25d | 1 | 0.87mi |
| 105 Churchill St Fl (105) Fairfield, CT | 2.0 | 1.0 | 688 | $3,000 | $4.36 | 25d | 1 | 0.87mi |
| 105 Churchill St Fl (103) Fairfield, CT | 2.0 | 1.0 | 759 | $3,200 | $4.22 | 25d | 1 | 0.87mi |
| 109 Churchill St Unit 3rd Fl Fairfield, CT | 2.0 | 1.0 | 773 | $2,800 | $3.62 | 4d | 1 | 0.87mi |
| 708 Black Rock Tpke Fairfield, CT | 2.0 | 1.0 | 1000 | $2,625 | $2.62 | 16d | 1 | 0.88mi |
| 166 Dewey St Unit 1 Bridgeport, CT | 3.0 | 1.0 | 1100 | $2,100 | $1.91 | 5d | 1 | 0.90mi |
| 38 Poe Ct Fairfield, CT | 2.0 | 1.0 | 800 | $3,100 | $3.88 | 4d | 1 | 0.95mi |
| 245 Sunnyridge Ave #6 Fairfield, CT | 2.0 | 1.0 | 900 | $2,700 | $3.00 | 12d | 1 | 0.96mi |
| 258 Jennings Rd Fairfield, CT | 2.0 | 1.0 | 789 | $2,400 | $3.04 | 45d | 1 | 1.01mi |
| 77 Crestwood Rd Fairfield, CT | 2.0 | 1.0 | 572 | $2,400 | $4.20 | 45d | 1 | 1.04mi |
| 898 Hancock Ave Unit 3 Bridgeport, CT | 3.0 | 1.0 | 1068 | $2,500 | $2.34 | 45d | 1 | 1.17mi |
| 1004 Hancock Ave #3 Bridgeport, CT | 2.0 | 1.0 | 800 | $1,700 | $2.12 | 13d | 1 | 1.19mi |
| 226 Kings Hwy E Fairfield, CT | 1.0 | 1.0 | 600 | $1,650 | $2.75 | 25d | 1 | 1.19mi |
| 1000 Knapps Hwy #23 Fairfield, CT | 2.0 | 1.0 | 790 | $2,650 | $3.35 | 45d | 1 | 1.23mi |
| 50 Craig Pl Fairfield, CT | 3.0 | 2.0 | 1004 | $8,500 | $8.47 | 45d | 1 | 1.28mi |
| 272 Hunyadi Ave Fairfield, CT | 2.0 | 1.0 | 1100 | $2,550 | $2.32 | 16d | 1 | 1.29mi |
HOA detail condo
- Monthly dues
- $598 · $7,176/yr
- Assessments
- None detected in remarks — confirm with the listing agent.
Listing history 8 events
-
2026-06-22days on market $142,900 Active 44 DOM
-
2026-06-18days on market $142,900 Active 41 DOM
-
2026-06-17days on market $142,900 Active 40 DOM
-
2026-06-16days on market $142,900 Active 39 DOM
-
2026-06-15status $142,900 Active 38 DOM
-
2026-05-01status Under Contract
-
2026-04-08price $142,900
-
2026-03-24$154,900 Active
ⓘ Source: listings_history table (triggers on properties + properties_extension) + one-shot
backfill from property_details.listing_events for pre-trigger history.
Climate risk First Street
- Flood 1/10 Low FEMA zone X (unshaded) · 0% chance over 30 yrs
- Wildfire 1/10 Low
- Heat 6/10 Major 7 d/yr ≥97°F today · 15 d/yr by 30 yrs out
- Wind 6/10 Major 65% chance of damaging wind over 30 yrs
- Air quality 4/10 Moderate 5 unhealthy d/yr today · 7 by 30 yrs out
Nearby sold comps map
Loading sold comps map…
Walkable amenities ~0.75 mi
Loading nearby amenities…
Taxation est. · year 1
- Rental income
- $26,448
- − Mortgage interest
- −$8,005
- − Property taxes
- −$2,144
- − Insurance
- −$714
- − Repairs & maintenance
- −$2,116
- − Management
- −$2,116
- − HOA
- −$7,176
- − Depreciation
- −$4,157
- Taxable income
- $21
- Est. tax owed @ 24.0%
- −$5
- After-tax cash flow
- $1,862/yr
For passive investors: Depreciation is non-cash, so a rental often shows a tax loss while cash-flowing — sheltering income. Rental losses are passive: they offset passive income freely, and up to $25,000/yr can offset ordinary (W-2) income if you actively participate and your MAGI is under $100k (phasing out to $0 by $150k); unused losses carry forward. On sale, claimed depreciation is recaptured at up to 25%, and gains may owe capital-gains tax (a 1031 exchange can defer both). Figures are a year-1 estimate at your 24.0% rate — not tax advice; consult a CPA.
Condition & rehab AI · 14 photos
This townhouse is in average condition with moderate updates needed. It has a good roof and foundation, but the kitchen and bathroom need significant upgrades. A fresh paint job and new appliances would significantly enhance its resale value.
Repairs flagged
- Major Kitchen appliances — Outdated and need replacement for a better look and functionality.
- Major Bathroom fixtures — Dated and need replacement for a better look and functionality.
- Minor Paint — Some areas show signs of wear, but can be touched up.
Value-add opportunities
- Resale New kitchen appliances — Modern appliances will attract more buyers and increase the home's appeal.
- Resale New bathroom fixtures — Up-to-date fixtures will make the bathroom more attractive and functional.
- Both Paint refresh — Refreshing the paint will improve the home's curb appeal and interior aesthetics.
Renovation cost estimate screening
| Repair item | Severity | Est. cost |
|---|---|---|
| Kitchen appliances · Outdated and need replacement for a better look and functionality. | Major | $15,000–50,000 |
| Bathroom fixtures · Dated and need replacement for a better look and functionality. | Major | $15,000–50,000 |
| Paint · Some areas show signs of wear, but can be touched up. | Minor | $500–3,000 |
| Total estimated repair cost · 3 items | $30,500–103,000 |
Value-add ROI direction
- Resale New kitchen appliances — Modern appliances will attract more buyers and increase the home's appeal. ↑
- Resale New bathroom fixtures — Up-to-date fixtures will make the bathroom more attractive and functional. ↑
- Both Paint refresh — Refreshing the paint will improve the home's curb appeal and interior aesthetics. ↑
ⓘ Cost ranges are severity-bucket heuristics (US national rule-of-thumb). Get contractor quotes + a written scope before underwriting a rehab budget.
Schools (NCES district)
- District
- Bridgeport School District
- NCES district ID
- 0900450
- Math proficiency
- 9% ▼ -7.00%
- Reading proficiency
- 19% ▼ -10.00%
- Median HH income
- $41,507
- Composite
- 12.09/100
- National rank
- #9656
- State rank
- #151 of 153 in CT
Livability — Bridgeport
- Score
- 81/100
- State rank
- #15
- US rank
- #1374
Category grades
Schools grade is shown separately in the Schools card above.
Census & demographics
- Census place
- Bridgeport, CT
- County
- Fairfield County · 765,532 people
- City population
- 149,153
- Metro
- Bridgeport-Stamford-Norwalk, CT
- Population (ZIP)
- 25,929
- Household income
- $56,179
- Rent vs Own
- Severe rent burden
- 2367.0
Population outlook (Greater Bridgeport County) Hauer SSP2
- By 2040
- 365,581
Race, ethnicity, and origin ACS 2023
- Neighborhood character
- Diverse neighborhood (Simpson 0.70)
- Race & ethnicity
- Hispanic / Latino 39% White 33% Black 19% Two or more races 12% Asian 5% Native American 1%
- Hispanic origin (detail)
- Mexican 6% Puerto Rican 17% Cuban 3% Dominican 3%
- Common ancestry
- Romanian 4% Hispanic 3% Scotch-Irish 2%
- Foreign-born
- 25% · Canada, Guatemala, China
- Languages at home
- 54% English-only · Spanish 32% Other Indo-European 4% French/Haitian/Cajun 3%
Political lean MEDSL · Greater Bridgeport
- 2024 margin
- Strong D (+23.3) · D 60.9% · R 37.6% · Other 1.5%
- All cycles
- 2024: D+23.3
Not yet ingested
- Civics
- —
Market trends
- HPI YoY
- ▼ -40.42%
- Current HPI
- 238.1786
- Rent YoY
- ▲ 1.81%
- Metro
- Bridgeport-Stamford-Norwalk, CT
- State GDP YoY
- ▲ 1.06%
- F500 in state
- 38
Industry mix (Fortune 500 HQ in CT)
| Industry | F500 HQs | Revenue |
|---|---|---|
| Industrial Machinery | 4 | $38B |
|
||
| Insurance | 3 | $71B |
|
||
| Financial Services | 2 | $25B |
|
||
| Transportation / Logistics | 2 | $18B |
|
||
| Healthcare | 1 | $247B |
|
||
| Telecommunications | 1 | $55B |
|
||
Price history
-7.7% since first listed3 events — show timeline
- 2026-05-01 Pending — Smart MLS
- 2026-04-08 Price Changed $142,900 Smart MLS
- 2026-03-24 Listed $154,900 Smart MLS
Cash-flow waterfall
monthlySold comps — $/sqft
last 12 mo · ≤1 miLoading sold comps…