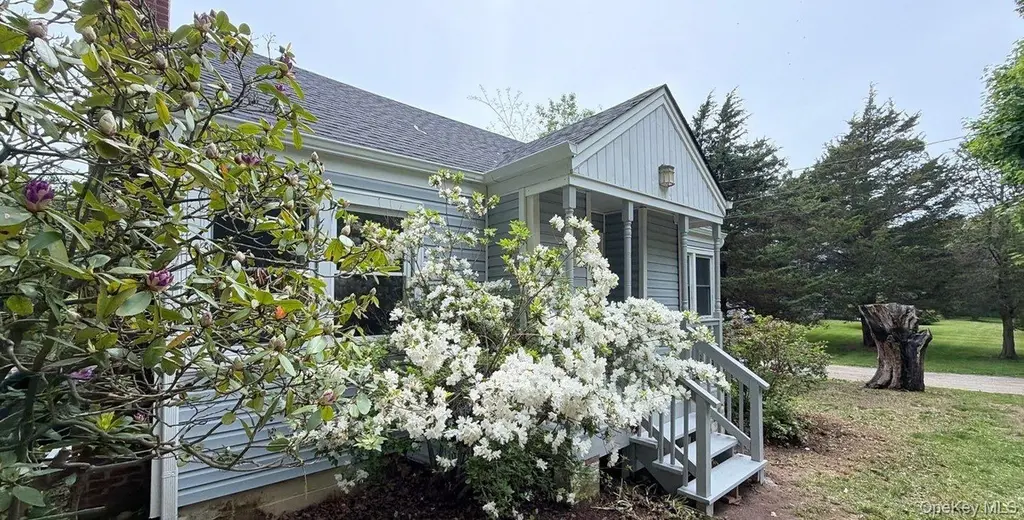
6900 Main Bayview Rd · Southold, NY
Flood risk 8/10 · Major
- FEMA flood zone
- X (shaded)
- Chance of flooding over 30 yrs
- 0.99%
- Est. flood insurance / yr
- $473 – $860
Fire risk 1/10 · Minimal
- Est. fire insurance / yr
- $691 – $1,283
Heat risk 5/10 · Moderate
- Hot days now (above 90°F)
- 7 days/yr
- Hot days in 30 yrs
- 19 days/yr
Wind risk 8/10 · Major
- Chance of severe wind over 30 yrs
- 80.0%
Air-quality risk 3/10 · Minor
- Unhealthy air days now
- 2 days/yr
- Unhealthy air days in 30 yrs
- 3 days/yr
Risk factors via First Street. Map © Google.
Why this score? — see what drove the B+ grade
The composite is a weighted blend of 9 inputs, each scored 0–100. Each bar is that input's sub-score; the figure is the points it added to the 100-point composite (weight × sub-score).
- Cash flow +30.0/30.0
- ARV discount +15.0/15.0
- 1% rule +10.0/10.0
- DSCR +10.0/10.0
- Schools +4.8/10.0
- Condition / age +3.8/5.0
- Livability +3.4/5.0
- Rent growth +2.5/5.0
- Appreciation +0.0/10.0
$600,000
🖨 Deal sheet 📄 Offer letter ✓ Due diligence
Listing remarks
Ranch Style Home. This Home Features 2 Bedrooms, Full Bath, Dining Area, Eat In Kitchen & 2 Car Garage. Centrally Located To All. Don't Miss This Opportunity!
Key facts
- Eat in kitchen
- Centrally located
- Dining area
Tags
Property features AI
Exterior
- Parking: Detached parking; Driveway; 2-car garage
- Utilities: Sewer: Other; Utilities: See remarks
- Home design: Single family residence; One story
- Construction: Frame construction
- Exterior features: Back yard; Front yard; Not waterfront
Interior
- Kitchen: Eat-in kitchen
- Bedrooms: Includes a first-floor bedroom
- Flooring: Tile flooring
- Bathrooms: One full bathroom
- Heating & cooling: Hot water heating; Oil heating; No central air
- Interior features: First-floor bedroom; First-floor full bath; Eat-in kitchen; Soaking tub; Deck; Full basement; Scuttle attic; One level (single-story)
- Laundry & utility: No appliances listed
Neighborhood map
What this means for you Summary
Snapshot
- This is a 2-bed/1.0-bath single-family listed at $600k. Condition is rated good.
Deal economics
- At list price, monthly cash flow is $13k ($157k/yr) — positive.
- The deal already cash-flows at list — no discount required.
- Meets the 1% rule at list price ($22k rent vs $600k).
- Cap rate 32.6% vs local median 6.9% in Southold — top-decile yield for the area; either an underpriced asset or a hidden risk that comps aren't pricing in. Stress-test before assuming the spread holds.
Location & tenants
- Location reads 67/100 on livability (#583 in NY) — a middle-class / working-renter tenant base. Strengths: crime A+, employment A+, health & safety B+; Watch: amenities F, commute F, cost of living F.
- Southold Union Free School District (town): math 46% / reading 59% proficiency, ranked #298 of 590 in NY (top 50%) — acceptable for families but not a draw, mixed tenant base, ~2y average lease; only 17% free/reduced lunch — higher-income household profile.
- Zoned schools: Southold Elementary School (math 37% / reading 62%, grade D, #1,085 of 2,108 statewide, top 56%, 317 students, 35% FRL); Southold Junior-Senior High School (math 52% / reading 52%, grade D+, #946 of 1,100 statewide, top 88%, 380 students, 40% FRL) — zoned schools average 38% FRL vs 17% district-wide (21 pts higher); higher-poverty schools than district average — tighter screening recommended.
- Market conditions: 79 active listings in the ZIP; 3 comparable units currently listed for rent nearby; rentals at typical pace (median 25d on market — plan ~3-4 weeks tenant-placement turnaround); 1,366 units permitted in Suffolk County in 2024 (216 in 5+ unit buildings).
Forward outlook
- Local home prices are declining (-3.0%/yr); year-one equity from $4k of loan paydown is wiped out by about $18k of value loss. Plan a longer hold.
- Suffolk County population projected to shrink 5% by 2050 — rents likely to lag national; underwrite the cash flow, not the appreciation.
- At projected returns (-3.0% appreciation + 3.0% rent growth), your $168k cash investment doubles in ~2 years — after that, you're playing with house money.
Negotiation context
- Only 13 days on market — expect competitive offers; lowballing is unlikely to land.
- 3 sale attempts since 2y ago with the ask held roughly flat each time — persistent listings suggest the price (not the market) is what's stuck; bring a comps-based counter.
Risks & watch-outs
- Watch-outs: flood insurance adds $56/mo; built in 1955 — expect roof / HVAC / electrical / plumbing capex.
- Climate carrying-cost: severe flood risk; severe wind risk, 80% chance of damaging wind over 30y; extreme-heat days projected 7→19/yr by 2055 (HVAC capex compounding) — expect insurance premiums to compound above CPI over the hold.
Questions for the listing agent
- Built in 1955 — when were the roof, HVAC, electrical panel, plumbing, and water heater last replaced?
- What's the actual annual flood-insurance premium (NFIP or private), and is the property in a SFHA with mandatory coverage?
- Is there a deadline driving the sale (1031 exchange, divorce, estate, relocation)? That informs how much negotiation room exists.
- Schools are A-rated — typically a magnet for longer-tenancy family renters. What's the average tenant stay here, and is there a school-zone premium baked into asking?
- What's the average days-on-market for RENTAL listings here right now (not sales)? A rising rental-DOM trend means longer vacancies and softer asking-rent achievability than the comps imply.
- What's the recent tenant-quality profile in this submarket — average credit score on applications, eviction rate, late-payment / NSF rate, and stable-employment percentage? A property-management company in the area should have these aggregated.
- How much new for-sale + rental construction is in the pipeline within 1–3 miles? Heavy new supply typically softens prices + rents 12–24 months out; constrained supply supports both.
Investment metrics
- 1% rule
- 3.59% ✓
- Cap rate
- 32.59%
- Cash-on-cash
- 93.90%
- DSCR
- 5.18
- GRM
- 2.3
CMA / ARV
- ARV (on-the-fly)
- $807,600
- Comps found
- 4
Show comp detail 4 sales within ~0.75 mi
| Address | Dist | Beds/Ba | Sqft | Sold | Price | $/sf | Match |
|---|---|---|---|---|---|---|---|
| 3700 Minnehaha Blvd | 0.34mi | 3/1.5 (+1) | 1,144 (-5%) | 4mo | $1,025,000 | $896 | 66 |
| 900 Cedar Dr | 0.22mi | 3/1.0 (+1) | 1,100 (-8%) | 7mo | $650,000 | $591 | 65 |
| 1000 Gin Ln | 0.70mi | 2/1.0 | 1,189 (-1%) | 2mo | $718,000 | $604 | 64 |
| 1040 Nakomis Rd | 0.64mi | 3/1.0 (+1) | 1,100 (-8%) | 8mo | $740,000 | $673 | 45 |
Match score weights: distance 35% · size 25% · config 20% · recency 20%. Top-matched comps best support the ARV.
Projected returns pro-forma
-3.0% appreciation · 3.0% rent growth · sell at horizon
- IRR
- 94.3%
- Equity multiple
- 5.39×
- Total profit
- $736,720
- Equity at exit
- $89,462
- IRR
- 97.1%
- Equity multiple
- 11.21×
- Total profit
- $1,715,875
- Equity at exit
- $51,877
Cash invested: $168,000 (down + closing). Projections, not guarantees.
Landlord ↔ Tenant lean methodology
- Overall (STATE)
- 15 Strongly Tenant-Friendly
- State New York
- 15 Strongly Tenant-Friendly · D+10
- County
- — inherits STATE
- City
- — inherits STATE
ZIP-level market 11971
- Home prices YoY
- -15.8%
- Active inventory
- 79
- Price-to-rent
- 2.3×
Monthly cashflow live
- Estimated rent
- $21,532 medium interval (Pro) →
- Mortgage (P&I)
- −$3,146
- Tax from tax record
- −$467 /mo · $5,610/yr
- Insurance
- −$250
- Flood insurance flood zone
- −$56 /mo · $666/yr
- HOA
- −$0
- Vacancy / Maint / Mgmt
- −$4,522
- Net cashflow
- $13,091
Break-even live
UW: 25.0% down · 7.5% · 30yr · 1.5% tax · 5.0% vac · 8.0% maint · 8.0% mgmt
Financing live
Cash to close
- Down payment
- $150,000
- Closing costs
- $18,000
- Reserves months
- —
- Total cash needed
- —
Loan-product check · same deal, 3 products live
Conventional
25% down · 7.5% · 30yr
- Down + closing
- —
- Monthly P&I
- —
- Monthly cashflow
- —
- DSCR
- —
- Eligible?
- —
Personal DTI + credit; lowest rate.
DSCR
20% down · 8.5% · 30yr
- Down + closing
- —
- Monthly P&I
- —
- Monthly cashflow
- —
- DSCR
- —
- Eligible?
- —
No personal income docs; deal must DSCR.
Hard money
10% down · 12.0% · 12mo
- Down + closing
- —
- Monthly P&I
- —
- Monthly cashflow
- —
- DSCR
- —
- Eligible?
- —
Short-term bridge; refi at stabilization.
Rent comps 3 comps
| Address | Beds | Baths | Sqft | Rent | $/sqft | DOM | Units | Dist |
|---|---|---|---|---|---|---|---|---|
| 1355 Watersedge Way Southold, NY | 3.0 | 2.0 | 1200 | $19,500 | $16.25 | 24d | 1 | 0.76mi |
| 2662 Paradise Shores Rd Southold, NY | 3.0 | 1.5 | 1300 | $25,000 | $19.23 | 24d | 1 | 1.35mi |
| 2845 Hobart Rd Southold, NY | 3.0 | 2.0 | 1300 | $22,000 | $16.92 | 43d | 1 | 1.48mi |
Listing history 11 events
-
2026-06-18days on market $600,000 Active 13 DOM
-
2026-06-17days on market $600,000 Active 12 DOM
-
2026-06-16days on market $600,000 Active 11 DOM
-
2026-06-15days on market $600,000 Active 10 DOM
-
2026-06-13days on market $600,000 Active 8 DOM
-
2026-06-12days on market $600,000 Active 7 DOM
-
2026-06-09days on market $600,000 Active 4 DOM
-
2026-06-08days on market $600,000 Active 3 DOM
-
2026-06-07days on market $600,000 Active 2 DOM
-
2026-06-07remarks 160-char remark
-
2026-06-07$600,000 Active 1 DOM
ⓘ Source: listings_history table (triggers on properties + properties_extension) + one-shot
backfill from property_details.listing_events for pre-trigger history.
Tax reassessment forecast NY · Partial reset (capped growth)
- Current annual tax
- $5,610 · $467/mo
- Projected year-2 tax
- $7,875 · $656/mo
- Expected delta
- +$2,265/yr (+$189/mo · 40.4%)
ⓘ Screening estimate from a state-policy table — verify with the county assessor before closing.
Climate risk First Street
- Flood 8/10 Severe FEMA zone X (shaded) · 99% chance over 30 yrs
- Wildfire 1/10 Low
- Heat 5/10 Major 7 d/yr ≥90°F today · 19 d/yr by 30 yrs out
- Wind 8/10 Severe 80% chance of damaging wind over 30 yrs
- Air quality 3/10 Moderate 2 unhealthy d/yr today · 3 by 30 yrs out
Nearby sold comps map
Loading sold comps map…
Walkable amenities ~0.75 mi
Loading nearby amenities…
Taxation est. · year 1
- Rental income
- $258,384
- − Mortgage interest
- −$33,609
- − Property taxes
- −$5,610
- − Insurance
- −$3,666
- − Repairs & maintenance
- −$20,671
- − Management
- −$20,671
- − Depreciation
- −$17,455
- Taxable income
- $156,703
- Est. tax owed @ 24.0%
- −$37,609
- After-tax cash flow
- $119,481/yr
For passive investors: Depreciation is non-cash, so a rental often shows a tax loss while cash-flowing — sheltering income. Rental losses are passive: they offset passive income freely, and up to $25,000/yr can offset ordinary (W-2) income if you actively participate and your MAGI is under $100k (phasing out to $0 by $150k); unused losses carry forward. On sale, claimed depreciation is recaptured at up to 25%, and gains may owe capital-gains tax (a 1031 exchange can defer both). Figures are a year-1 estimate at your 24.0% rate — not tax advice; consult a CPA.
Condition & rehab AI · 12 photos
This ranch-style home is in good condition with cosmetic updates needed to modernize the kitchen and bathroom, significantly enhancing its resale and rental value.
Repairs flagged
- Minor Kitchen cabinets — Aesthetic update needed.
- Minor Bathtub and fixtures — Update needed for functionality and style.
Value-add opportunities
- Both Kitchen renovation — Modernizing the kitchen can significantly increase both resale and rental value.
- Both Bathtub replacement — Upgrading the bathroom can enhance both resale and rental appeal.
Renovation cost estimate screening
| Repair item | Severity | Est. cost |
|---|---|---|
| Kitchen cabinets · Aesthetic update needed. | Minor | $500–3,000 |
| Bathtub and fixtures · Update needed for functionality and style. | Minor | $500–3,000 |
| Total estimated repair cost · 2 items | $1,000–6,000 |
Value-add ROI direction
- Both Kitchen renovation — Modernizing the kitchen can significantly increase both resale and rental value. ↑
- Both Bathtub replacement — Upgrading the bathroom can enhance both resale and rental appeal. ↑
ⓘ Cost ranges are severity-bucket heuristics (US national rule-of-thumb). Get contractor quotes + a written scope before underwriting a rehab budget.
Schools (NCES district)
- District
- Southold Union Free School District
- NCES district ID
- 3627620
- Math proficiency
- 46% ▼ -10.00%
- Reading proficiency
- 59% ▲ 6.00%
- Median HH income
- $78,622
- Composite
- 47.54/100
- National rank
- #2269
- State rank
- #298 of 590 in NY
Livability — Southold
- Score
- 67/100
- State rank
- #583
- US rank
- #10545
Category grades
Schools grade is shown separately in the Schools card above.
Census & demographics
- Census place
- Southold, NY
- City population
- 6,507
- Population (ZIP)
- 6,507
Population outlook (Suffolk County) Hauer SSP2
- Today (2025)
- 1,505,262 people
- By 2030
- 1,498,318 · -0.5%
- By 2040
- 1,471,101 · -2.3%
- By 2050
- 1,424,848 · -5.3%
- By 2075
- 1,337,157 · -11.2%
- By 2100
- 1,217,720 · -19.1%
Race, ethnicity, and origin ACS 2023
- Neighborhood character
- Predominantly White (78%)
- Race & ethnicity
- White 78% Hispanic / Latino 14% Two or more races 5% Asian 4%
- Hispanic origin (detail)
- Mexican 3% Puerto Rican 1% Dominican 3%
- Common ancestry
- Romanian 6% Italian 2% Slovak 2%
- Foreign-born
- 14% · Canada, China, Dominican Republic
- Languages at home
- 83% English-only · Spanish 11% Russian/Polish/Slavic 2% Other Indo-European 2%
Political lean MEDSL · Suffolk
- 2024 margin
- Lean R (+10.0) · D 45.0% · R 55.0%
- 2008→2024 swing
- -16.0pp toward R · 2008: 6.0pp · 2024: -10.0pp
- All cycles
- 2024: R+10.0 2020: R+0.0 2016: R+8.2 2012: D+2.9 2008: D+6.0
Not yet ingested
- Civics
- —
Market trends
- HPI YoY
- ▼ -74.14%
- Current HPI
- 396.5481
- Rent YoY
- —
- Metro
- —
- State GDP YoY
- ▲ 2.60%
- F500 in state
- 92
Industry mix (Fortune 500 HQ in NY)
| Industry | F500 HQs | Revenue |
|---|---|---|
| Financial Services | 10 | $950B |
|
||
| Consumer Goods | 9 | $162B |
|
||
| Insurance | 4 | $225B |
|
||
| Telecommunications | 2 | $144B |
|
||
| Pharmaceuticals | 2 | $112B |
|
||
| Media / Entertainment | 2 | $69B |
|
||
Price history
-7.6% since first listed7 events — show timeline
- 2026-06-04 Listed $600,000 OneKey® MLS as Distributed by MLS Grid
- 2025-04-09 Pending — OneKey® MLS as Distributed by MLS Grid
- 2025-04-09 Listing Removed — OneKey® MLS as Distributed by MLS Grid
- 2025-03-11 Listed $549,000 OneKey® MLS as Distributed by MLS Grid
- 2025-01-11 Listing Removed — OneKey® MLS as Distributed by MLS Grid
- 2024-04-27 Price Changed $629,000 OneKey® MLS as Distributed by MLS Grid
- 2024-04-19 Listed $649,000 OneKey® MLS as Distributed by MLS Grid
Property tax history
+0.0%/yrLatest (2025): $5,610 · +0.0% YoY. Source: county tax records.
Cash-flow waterfall
monthlySold comps — $/sqft
last 12 mo · ≤1 miLoading sold comps…