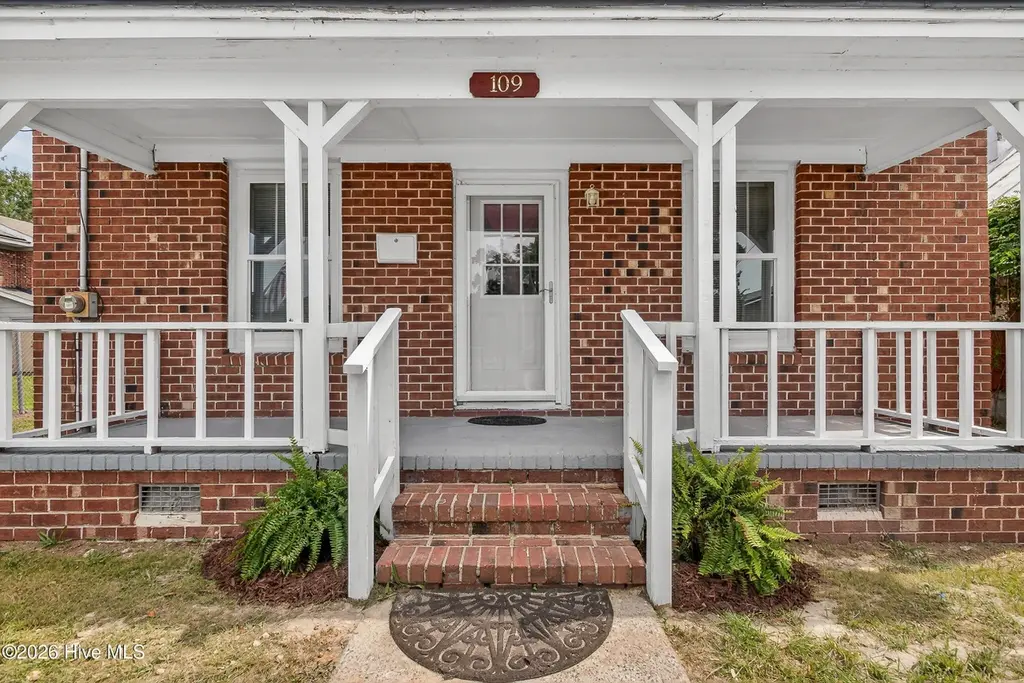
109 E South St · Kinston, NC
Flood risk 1/10 · Minimal
- FEMA flood zone
- X (shaded)
- Chance of flooding over 30 yrs
- 0.0%
- Est. flood insurance / yr
- $507 – $1,088
Fire risk 3/10 · Minor
- Est. fire insurance / yr
- $906 – $1,684
Heat risk 8/10 · Major
- Hot days now (above 105°F)
- 7 days/yr
- Hot days in 30 yrs
- 19 days/yr
Wind risk 8/10 · Major
- Chance of severe wind over 30 yrs
- 80.0%
Air-quality risk 2/10 · Minimal
- Unhealthy air days now
- 2 days/yr
- Unhealthy air days in 30 yrs
- 2 days/yr
Risk factors via First Street. Map © Google.
Why this score? — see what drove the D grade
The composite is a weighted blend of 9 inputs, each scored 0–100. Each bar is that input's sub-score; the figure is the points it added to the 100-point composite (weight × sub-score).
- Cash flow +15.2/30.0
- ARV discount +7.5/15.0
- DSCR +4.7/10.0
- 1% rule +3.5/10.0
- Livability +2.8/5.0
- Rent growth +2.5/5.0
- Schools +2.5/10.0
- Condition / age +2.5/5.0
- Appreciation +0.0/10.0
$115,000
🖨 Deal sheet 📄 Offer letter ✓ Due diligence
Listing remarks
Looking for an affordable home that's already had the hard work done? Welcome to this completely renovated 2-bedroom, 1-bath home in the heart of Kinston, one of Eastern North Carolina's hidden gems. Built with character and updated for today's buyer, this move-in ready home features fresh paint, new flooring, new carpet, newly installed baseboard heat, and window A/C units. The sellers have gone beyond cosmetic updates by reinforcing the floors in the crawl space and installing a new vapor barrier, giving buyers added peace of mind. The brick exterior and metal roof offer durability and low-maintenance living, while the spacious backyard provides plenty of room for entertaining, gardening,
Key facts
- New carpet
- New flooring
- Completely renovated
Tags
Property features AI
Finance
- Other: Zoned residential
- Financial info: No investor or income/expense details provided
- HOA & community: No association amenities
Exterior
- Parking: Unpaved parking
- Security: No security features listed
- Utilities: Public water; Public sewer; Sewer and water connected
- Home design: Single-family residence; One story; Entry on level 1
- Construction: Brick, brick veneer and frame construction; Metal roof; Built on crawl space
- Exterior features: Front porch; No additional exterior features listed; Has a view
Interior
- Kitchen: Electric oven; Refrigerator; Eat-in kitchen
- Bedrooms: Total of 5 rooms (bedroom count not separately listed)
- Flooring: Carpet; Laminate; Vinyl
- Bathrooms: 1 full bathroom
- Heating & cooling: Baseboard heating; Electric heating; Wall/window air conditioning units
- Interior features: Ceiling fans; Eat-in kitchen; Window coverings; No basement (crawl space)
- Laundry & utility: Washer (washer hookup in kitchen); Dryer
Neighborhood map
What this means for you Summary
Snapshot
- This is a 3-bed/1.0-bath single-family listed at $115k.
Deal economics
- At list price, monthly cash flow is $41 ($488/yr) — positive.
- The deal already cash-flows at list — no discount required.
- To meet the 1% rule (rent ≥ 1% of price), the offer needs to be $98k (14.6% below list).
- Recommended offer: $98k (14.6% below list) — sets the bar for 1% rule.
- Cap rate 6.7% vs local median 3.8% in Kinston — top-decile yield for the area; either an underpriced asset or a hidden risk that comps aren't pricing in. Stress-test before assuming the spread holds.
Location & tenants
- Location reads 55/100 on livability (#640 in NC) — a working-class tenant base; expect higher turnover. Strengths: cost of living A+, health & safety A+, housing B+; Watch: crime F, amenities F, commute F.
- Lenoir County Public Schools (rural): math 29% / reading 32% proficiency, ranked #147 of 178 in NC (top 83%) — families likely to look elsewhere, expect single-tenant / working-renter base with shorter leases; 65% free/reduced lunch — lower-income household profile, screen leases tightly.
- Zoned schools: Southeast Elementary (math 8% / reading 17%, grade F, #1,362 of 1,410 statewide, top 97%, 190 students, 97% FRL); Rochelle Middle (math 9% / reading 20%, grade F, #462 of 475 statewide, top 98%, 466 students, 98% FRL); Kinston High (math 22% / reading 37%, grade F, #459 of 535 statewide, top 87%, 713 students, 100% FRL) — zoned schools average 98% FRL vs 65% district-wide (34 pts higher); higher-poverty schools than district average — tighter screening recommended.
- Market conditions: 95 active listings in the ZIP; 6 comparable units currently listed for rent nearby; rentals at typical pace (median 21d on market — plan ~3-4 weeks tenant-placement turnaround); 148 units permitted in Lenoir County in 2024 (0 in 5+ unit buildings).
Forward outlook
- Local home prices are declining (-3.0%/yr); year-one equity from $795 of loan paydown is wiped out by about $3k of value loss. Plan a longer hold.
- Lenoir County population projected at -18% by 2050 — secular population decline; favor cash flow + early exit over multi-decade hold.
Negotiation context
- Only 9 days on market — expect competitive offers; lowballing is unlikely to land.
- 12 sale attempts since 3y ago with the ask held roughly flat each time — persistent listings suggest the price (not the market) is what's stuck; bring a comps-based counter.
- Current owner paid $33k; list at $115k implies a 248% gain — meaningful room to come down on a strong offer.
Risks & watch-outs
- Climate carrying-cost: severe wind risk, 80% chance of damaging wind over 30y; extreme-heat days projected 7→19/yr by 2055 (HVAC capex compounding) — expect insurance premiums to compound above CPI over the hold.
Questions for the listing agent
- Built in 1968 — when were the roof, HVAC, electrical panel, plumbing, and water heater last replaced?
- Is there a deadline driving the sale (1031 exchange, divorce, estate, relocation)? That informs how much negotiation room exists.
- Schools are F-rated, which usually means shorter tenancies and higher turnover. Who's the typical renter profile here, and what's been the actual vacancy rate?
- Crime grade is F in this area — have there been break-ins, vandalism, or insurance claims at this property in the last 3 years? What carrier currently insures it and at what premium?
- The area grade is low — what's the realistic commute time and amenity access for the typical tenant pool here? Any planned neighborhood developments (good or bad) we should know about?
- What's the average days-on-market for RENTAL listings here right now (not sales)? A rising rental-DOM trend means longer vacancies and softer asking-rent achievability than the comps imply.
- What's the recent tenant-quality profile in this submarket — average credit score on applications, eviction rate, late-payment / NSF rate, and stable-employment percentage? A property-management company in the area should have these aggregated.
- How much new for-sale + rental construction is in the pipeline within 1–3 miles? Heavy new supply typically softens prices + rents 12–24 months out; constrained supply supports both.
Investment metrics
- 1% rule
- 0.85% ✗
- Cap rate
- 6.72%
- Cash-on-cash
- 1.52%
- DSCR
- 1.07
- GRM
- 9.8
CMA / ARV
No comps found within radius.
Projected returns pro-forma
-3.0% appreciation · 3.0% rent growth · sell at horizon
- IRR
- -13.9%
- Equity multiple
- 0.50×
- Total profit
- $-16,064
- Equity at exit
- $17,147
- IRR
- -5.1%
- Equity multiple
- 0.67×
- Total profit
- $-10,738
- Equity at exit
- $9,943
Cash invested: $32,200 (down + closing). Projections, not guarantees.
Landlord ↔ Tenant lean methodology
- Overall (STATE)
- 85 Strongly Landlord-Friendly
- State North Carolina
- 85 Strongly Landlord-Friendly · R+3
- County
- — inherits STATE
- City
- — inherits STATE
ZIP-level market 28501
- Home prices YoY
- -18.9%
- Active inventory
- 95
- Price-to-rent
- 9.8×
Monthly cashflow live
- Estimated rent
- $982 high interval (Pro) →
- Mortgage (P&I)
- −$603
- Tax from tax record
- −$84 /mo · $1,011/yr
- Insurance
- −$48
- HOA
- −$0
- Vacancy / Maint / Mgmt
- −$206
- Net cashflow
- $41
Break-even live
UW: 25.0% down · 7.5% · 30yr · 1.5% tax · 5.0% vac · 8.0% maint · 8.0% mgmt
Financing live
Cash to close
- Down payment
- $28,750
- Closing costs
- $3,450
- Reserves months
- —
- Total cash needed
- —
Loan-product check · same deal, 3 products live
Conventional
25% down · 7.5% · 30yr
- Down + closing
- —
- Monthly P&I
- —
- Monthly cashflow
- —
- DSCR
- —
- Eligible?
- —
Personal DTI + credit; lowest rate.
DSCR
20% down · 8.5% · 30yr
- Down + closing
- —
- Monthly P&I
- —
- Monthly cashflow
- —
- DSCR
- —
- Eligible?
- —
No personal income docs; deal must DSCR.
Hard money
10% down · 12.0% · 12mo
- Down + closing
- —
- Monthly P&I
- —
- Monthly cashflow
- —
- DSCR
- —
- Eligible?
- —
Short-term bridge; refi at stabilization.
Rent comps 6 comps
| Address | Beds | Baths | Sqft | Rent | $/sqft | DOM | Units | Dist |
|---|---|---|---|---|---|---|---|---|
| 619 S Heritage St Kinston, NC | 1.0–2.0 | 2.0 | 1025 | $1,042 | $1.02 | 13d | 4 | 0.13mi |
| 503 N Queen St Kinston, NC | 1.0–2.0 | 2.0 | 759 | $723 | $0.95 | 13d | 8 | 0.71mi |
| 1204 Desmond St Kinston, NC | 3.0 | 1.0 | 1100 | $1,340 | $1.22 | 20d | 1 | 0.97mi |
| 705 Harvey St Kinston, NC | 2.0 | 1.0 | 896 | $700 | $0.78 | 20d | 1 | 1.03mi |
| 100 Wingate Dr Kinston, NC | 2.0–3.0 | 1.0–1.5 | 930 | $975 | $1.05 | 20d | 1 | 1.43mi |
| 1313 McAdoo St Kinston, NC | 1.0–3.0 | 1.0–2.0 | 644 | $814 | $1.26 | 13d | 6 | 1.48mi |
Listing history 8 events
-
2026-06-19days on market $115,000 Active 9 DOM
-
2026-06-18days on market $115,000 Active 8 DOM
-
2026-06-17days on market $115,000 Active 7 DOM
-
2026-06-16days on market $115,000 Active 6 DOM
-
2026-06-15days on market $115,000 Active 5 DOM
-
2026-06-14days on market $115,000 Active 3 DOM
-
2026-06-12remarks 699-char remark
-
2026-06-12$115,000 Active 2 DOM
ⓘ Source: listings_history table (triggers on properties + properties_extension) + one-shot
backfill from property_details.listing_events for pre-trigger history.
Tax reassessment forecast NC · Resets to sale price
- Current annual tax
- $1,011 · $84/mo
- Projected year-2 tax
- $1,011 · $84/mo
- Expected delta
- $0/yr ($0/mo · -0.0%)
ⓘ Screening estimate from a state-policy table — verify with the county assessor before closing.
Climate risk First Street
- Flood 1/10 Low FEMA zone X (shaded) · 0% chance over 30 yrs
- Wildfire 3/10 Moderate
- Heat 8/10 Severe 7 d/yr ≥105°F today · 19 d/yr by 30 yrs out
- Wind 8/10 Severe 80% chance of damaging wind over 30 yrs
- Air quality 2/10 Low 2 unhealthy d/yr today · 2 by 30 yrs out
Nearby sold comps map
Loading sold comps map…
Walkable amenities ~0.75 mi
Loading nearby amenities…
Taxation est. · year 1
- Rental income
- $11,786
- − Mortgage interest
- −$6,442
- − Property taxes
- −$1,011
- − Insurance
- −$575
- − Repairs & maintenance
- −$943
- − Management
- −$943
- − Depreciation
- −$3,345
- Taxable loss
- −$1,473
- Est. tax savings @ 24.0%
- +$353
- After-tax cash flow
- $842/yr
For passive investors: Depreciation is non-cash, so a rental often shows a tax loss while cash-flowing — sheltering income. Rental losses are passive: they offset passive income freely, and up to $25,000/yr can offset ordinary (W-2) income if you actively participate and your MAGI is under $100k (phasing out to $0 by $150k); unused losses carry forward. On sale, claimed depreciation is recaptured at up to 25%, and gains may owe capital-gains tax (a 1031 exchange can defer both). Figures are a year-1 estimate at your 24.0% rate — not tax advice; consult a CPA.
Schools (NCES district)
- District
- Lenoir County Public Schools
- NCES district ID
- 3702610
- Math proficiency
- 29% ▲ 1.00%
- Reading proficiency
- 32% ▼ -4.00%
- Median HH income
- $34,958
- Composite
- 25.17/100
- National rank
- #7515
- State rank
- #147 of 178 in NC
Livability — Kinston
- Score
- 55/100
- State rank
- #640
- US rank
- #23267
Category grades
Schools grade is shown separately in the Schools card above.
Census & demographics
- Census place
- Kinston, NC
- City population
- 20,407
- Population (ZIP)
- 18,112
Population outlook (Lenoir County) Hauer SSP2
- Today (2025)
- 55,002 people
- By 2030
- 53,048 · -3.6%
- By 2040
- 49,041 · -10.8%
- By 2050
- 45,136 · -17.9%
- By 2075
- 36,547 · -33.6%
- By 2100
- 27,731 · -49.6%
Race, ethnicity, and origin ACS 2023
- Neighborhood character
- Majority Black (62%)
- Race & ethnicity
- Black 62% White 26% Two or more races 6% Hispanic / Latino 5%
- Common ancestry
- Serbian 1% Italian 1%
- Foreign-born
- 2% · Canada, China
- Languages at home
- 95% English-only · Spanish 5%
Political lean MEDSL · Lenoir
- 2024 margin
- Lean R (+6.8) · D 46.2% · R 53.0%
- 2008→2024 swing
- -6.7pp toward R · 2008: -0.1pp · 2024: -6.8pp
- All cycles
- 2024: R+6.8 2020: R+3.5 2016: R+6.3 2012: R+1.5 2008: R+0.1
Not yet ingested
- Civics
- —
Market trends
- HPI YoY
- ▼ -45.17%
- Current HPI
- 193.3213
- Rent YoY
- —
- Metro
- —
- State GDP YoY
- ▲ 3.28%
- F500 in state
- 26
Industry mix (Fortune 500 HQ in NC)
| Industry | F500 HQs | Revenue |
|---|---|---|
| Financial Services | 2 | $213B |
|
||
| Retail | 2 | $95B |
|
||
| Industrial Conglomerate | 1 | $38B |
|
||
| Metals / Steel | 1 | $35B |
|
||
| Utilities | 1 | $30B |
|
||
| Industrial Machinery | 1 | $19B |
|
||
Price history
+2775.0% since first listed33 events — show timeline
- 2026-06-10 Listed $115,000 Hive MLS
- 2026-04-30 Listing Removed — Hive MLS
- 2026-03-30 Price Changed $76,300 Hive MLS
- 2026-03-30 Price Changed $764,300 Hive MLS
- 2026-03-26 Relisted — Hive MLS
- 2026-03-26 Listing Removed — Hive MLS
- 2026-03-16 Price Changed $76,400 Hive MLS
- 2026-02-21 Relisted — Hive MLS
- 2026-02-21 Price Changed $76,600 Hive MLS
- 2026-02-20 Listing Removed — Hive MLS
- 2026-02-09 Price Changed $76,700 Hive MLS
- 2026-01-14 Price Changed $76,800 Hive MLS
- 2025-12-31 Relisted — Hive MLS
- 2025-12-29 Listing Removed — Hive MLS
- 2025-11-18 Price Changed $76,900 Hive MLS
- 2025-10-29 Relisted — Hive MLS
- 2025-09-09 Relisted — Hive MLS
- 2025-09-02 Price Changed $76,999 Hive MLS
- 2025-08-06 Listed $79,900 Hive MLS
- 2025-07-08 Listing Removed — Hive MLS
- 2025-04-08 Relisted — Hive MLS
- 2025-03-31 Listing Removed — Hive MLS
- 2024-12-07 Price Changed $117,900 Hive MLS
- 2024-12-03 Relisted — Hive MLS
- 2024-11-30 Listing Removed — Hive MLS
- 2024-08-28 Price Changed $119,000 Hive MLS
- 2024-07-30 Relisted — Hive MLS
- 2024-05-14 Price Changed $124,900 Hive MLS
- 2023-11-09 Listed $129,900 Hive MLS
- 2023-06-29 Sold (MLS) $33,000 Hive MLS
- 2023-06-24 Pending — Hive MLS
- 2023-06-08 Listed $45,900 Hive MLS
- 2018-02-27 Sold (Public Records) $4,000 Public Records
Property tax history
+20.9%/yrLatest (2025): $1,011 · +658.7% YoY. Source: county tax records.
Cash-flow waterfall
monthlySold comps — $/sqft
last 12 mo · ≤1 miLoading sold comps…