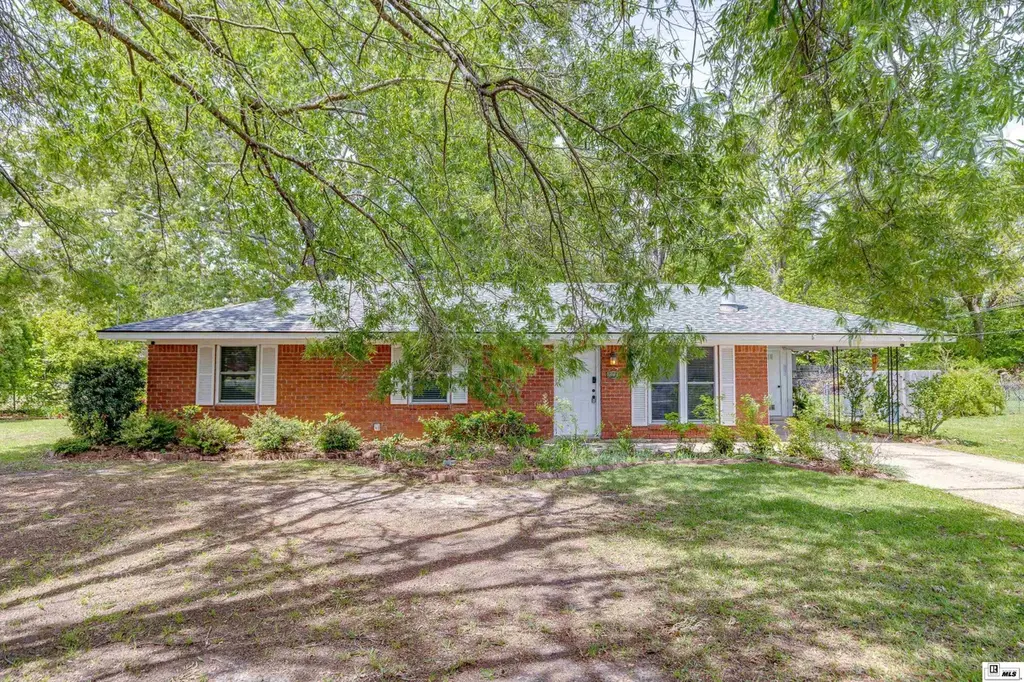
203 Holly Ridge Dr · Monroe, LA
Flood risk 7/10 · Major
- FEMA flood zone
- X (shaded)
- Chance of flooding over 30 yrs
- 0.97%
- Est. flood insurance / yr
- $507 – $1,088
Fire risk 1/10 · Minimal
- Est. fire insurance / yr
- $1,269 – $2,357
Heat risk 7/10 · Major
- Hot days now (above 111°F)
- 7 days/yr
- Hot days in 30 yrs
- 20 days/yr
Wind risk 8/10 · Major
- Chance of severe wind over 30 yrs
- 80.0%
Air-quality risk 2/10 · Minimal
- Unhealthy air days now
- 1 days/yr
- Unhealthy air days in 30 yrs
- 1 days/yr
Risk factors via First Street. Map © Google.
Why this score? — see what drove the C- grade
The composite is a weighted blend of 9 inputs, each scored 0–100. Each bar is that input's sub-score; the figure is the points it added to the 100-point composite (weight × sub-score).
- Cash flow +21.4/30.0
- ARV discount +8.6/15.0
- DSCR +6.8/10.0
- 1% rule +5.0/10.0
- Livability +3.3/5.0
- Schools +3.2/10.0
- Rent growth +2.5/5.0
- Condition / age +2.5/5.0
- Appreciation +0.0/10.0
$180,000
🖨 Deal sheet (PDF) 📄 Offer letter ✓ Due diligence
Key facts
- 0.56 acre lot
- 2 garage spots
- Built 1970
Property features AI
Finance
- Other: Located in the NORTH MONROE subdivision
- HOA & community: No association amenities
Exterior
- Parking: 2-car garage
- Security: Smoke detectors
- Utilities: Public water; Public sewer; Natural gas available and connected
- Home design: Single-family residence; Site-built; One story; Entry level: 1
- Construction: Brick veneer exterior; Asphalt roof; Slab foundation; Built with site-built construction
- Exterior features: Covered patio/porch; Landscaped yard; Corner lot; Cleared lot; Shed
Interior
- Kitchen: Dishwasher; Disposal; Refrigerator; Gas range
- Bedrooms: 3 main-level bedrooms
- Bathrooms: 2 full bathrooms
- Heating & cooling: Central heating; Natural gas heating; Wood stove heating; Central air; Electric cooling; Ceiling fans
- Interior features: Ceiling fans; Walk-in closets; Double pane windows; Wood burning stove fireplace
- Laundry & utility: Washer; Dryer; Gas water heater
Neighborhood map
What this means for you Summary
Snapshot
- This is a 3-bed/1.0-bath single-family listed at $180k.
Deal economics
- At list price, monthly cash flow is $200 ($2k/yr) — positive.
- The deal already cash-flows at list — no discount required.
- Meets the 1% rule at list price ($2k rent vs $180k).
- Cap rate 8.1% vs local median 5.7% in Monroe — top-decile yield for the area; either an underpriced asset or a hidden risk that comps aren't pricing in. Stress-test before assuming the spread holds.
Location & tenants
- Location reads 66/100 on livability (#128 in LA) — a middle-class / working-renter tenant base. Strengths: cost of living A+, health & safety A+; Watch: crime F, amenities F, commute F.
- Ouachita Parish (suburban): math 31% / reading 45% proficiency, ranked #26 of 98 in LA (top 26%) — families likely to look elsewhere, expect single-tenant / working-renter base with shorter leases.
- Zoned schools: Jack Hayes Elementary School (math 20% / reading 30%, grade F, #381 of 646 statewide, top 59%, 587 students, 83% FRL); Ouachita Junior High School (math 12% / reading 25%, grade F, #169 of 218 statewide, top 78%, 422 students, 80% FRL); Ouachita Parish High School (math 23% / reading 31%, grade F, #136 of 265 statewide, top 55%, 1,191 students, 66% FRL) — zoned schools average 76% FRL vs 52% district-wide (25 pts higher); higher-poverty schools than district average — tighter screening recommended.
- Zoned-school proficiency averages 24% at this address vs 38% district-wide (-14 pts) — the specific schools serving this property underperform the Ouachita Parish average; the district grade overstates school quality for this exact location.
- Market conditions: 440 active listings in the ZIP; 3 comparable units currently listed for rent nearby; rentals at typical pace (median 23d on market — plan ~3-4 weeks tenant-placement turnaround); 345 units permitted in Ouachita Parish in 2024 (0 in 5+ unit buildings).
- This rent runs 41% of the median local income ($52k/yr) — at the standard rent-burdened threshold; future hikes will face affordability resistance.
Forward outlook
- Local home prices are declining (-3.0%/yr); year-one equity from $1k of loan paydown is wiped out by about $5k of value loss. Plan a longer hold.
Negotiation context
- Only 5 days on market — expect competitive offers; lowballing is unlikely to land.
Risks & watch-outs
- Watch-outs: flood insurance adds $66/mo.
- Climate carrying-cost: major flood risk; severe wind risk, 80% chance of damaging wind over 30y; extreme-heat days projected 7→20/yr by 2055 (HVAC capex compounding) — expect insurance premiums to compound above CPI over the hold.
Questions for the listing agent
- Built in 1970 — when were the roof, HVAC, electrical panel, plumbing, and water heater last replaced?
- What's the actual annual flood-insurance premium (NFIP or private), and is the property in a SFHA with mandatory coverage?
- Is there a deadline driving the sale (1031 exchange, divorce, estate, relocation)? That informs how much negotiation room exists.
- Crime grade is F in this area — have there been break-ins, vandalism, or insurance claims at this property in the last 3 years? What carrier currently insures it and at what premium?
- What's the average days-on-market for RENTAL listings here right now (not sales)? A rising rental-DOM trend means longer vacancies and softer asking-rent achievability than the comps imply.
- What's the recent tenant-quality profile in this submarket — average credit score on applications, eviction rate, late-payment / NSF rate, and stable-employment percentage? A property-management company in the area should have these aggregated.
- How much new for-sale + rental construction is in the pipeline within 1–3 miles? Heavy new supply typically softens prices + rents 12–24 months out; constrained supply supports both.
Investment metrics
- 1% rule
- 1.00% ✓
- Cap rate
- 8.07%
- Cash-on-cash
- 6.35%
- DSCR
- 1.28
- GRM
- 8.3
CMA / ARV
- ARV (on-the-fly)
- $184,460
- Comps found
- 10
Show comp detail 10 sales within ~0.75 mi
| Address | Dist | Beds/Ba | Sqft | Sold | Price | $/sf | Match |
|---|---|---|---|---|---|---|---|
| 110 Holly Ridge Dr | 0.08mi | 3/1.5 | 1,497 (-7%) | 9mo | $185,000 | $124 | 76 |
| 110 York Dr | 0.30mi | 3/2.0 | 1,550 (-3%) | 6mo | $188,500 | $122 | 71 |
| 211 Shady Ln | 0.47mi | 3/2.0 | 1,770 (+10%) | 3mo | $135,000 | $76 | 54 |
| 81 Holiday Dr | 0.64mi | 3/2.0 | 1,637 (+2%) | 12mo | $138,000 | $84 | 53 |
| 114 York Dr | 0.27mi | 3/2.0 | 1,748 (+9%) | 22mo | $200,000 | $114 | 50 |
| 525 Woodhaven Dr | 0.70mi | 3/2.0 | 1,587 (-1%) | 15mo | $216,000 | $136 | 49 |
| 68 Holiday Dr | 0.74mi | 3/2.0 | 1,526 (-5%) | 13mo | $150,000 | $98 | 42 |
| 423 Birchwood Dr | 0.56mi | 3/2.0 | 1,407 (-12%) | 12mo | $169,500 | $120 | 40 |
| 530 Birchwood Dr | 0.61mi | 3/2.0 | 1,455 (-9%) | 20mo | $167,000 | $115 | 35 |
| 408 Birchwood Dr | 0.63mi | 3/2.0 | 1,450 (-10%) | 24mo | $158,000 | $109 | 31 |
Match score weights: distance 35% · size 25% · config 20% · recency 20%. Top-matched comps best support the ARV.
Projected returns pro-forma
-3.0% appreciation · 3.0% rent growth · sell at horizon
- IRR
- -8.9%
- Equity multiple
- 0.67×
- Total profit
- $-16,386
- Equity at exit
- $26,839
- IRR
- 0.6%
- Equity multiple
- 1.04×
- Total profit
- $2,234
- Equity at exit
- $15,563
Cash invested: $50,400 (down + closing). Projections, not guarantees.
Landlord ↔ Tenant lean methodology
- Overall (STATE)
- 90 Strongly Landlord-Friendly
- State Louisiana
- 90 Strongly Landlord-Friendly · R+12
- County
- — inherits STATE
- City
- — inherits STATE
ZIP-level market 71203
- Home prices YoY
- -32.4%
- Active inventory
- 440
- Price-to-rent
- 8.3×
Monthly cashflow live
- Estimated rent
- $1,806 medium interval (Pro) →
- Mortgage (P&I)
- −$944
- Tax from tax record
- −$141 /mo · $1,689/yr
- Insurance
- −$75
- Flood insurance flood zone
- −$66 /mo · $798/yr
- HOA
- −$0
- Vacancy / Maint / Mgmt
- −$379
- Net cashflow
- $200
Break-even live
Sensitivity live
| Price | -10% $302 | -5% $251 | +0% $200 | +5% $149 | +10% $99 |
|---|---|---|---|---|---|
| Rent | -10% $58 | -5% $129 | +0% $200 | +5% $272 | +10% $343 |
| Rate | -1.0pp $291 | -0.5pp $246 | base $200 | +0.5pp $154 | +1.0pp $106 |
UW: 25.0% down · 7.5% · 30yr · 1.5% tax · 5.0% vac · 8.0% maint · 8.0% mgmt
Financing live
Cash to close
- Down payment
- $45,000
- Closing costs
- $5,400
- Reserves months
- —
- Total cash needed
- —
Loan-product check · same deal, 3 products live
Conventional
25% down · 7.5% · 30yr
- Down + closing
- —
- Monthly P&I
- —
- Monthly cashflow
- —
- DSCR
- —
- Eligible?
- —
Personal DTI + credit; lowest rate.
DSCR
20% down · 8.5% · 30yr
- Down + closing
- —
- Monthly P&I
- —
- Monthly cashflow
- —
- DSCR
- —
- Eligible?
- —
No personal income docs; deal must DSCR.
Hard money
10% down · 12.0% · 12mo
- Down + closing
- —
- Monthly P&I
- —
- Monthly cashflow
- —
- DSCR
- —
- Eligible?
- —
Short-term bridge; refi at stabilization.
Rent comps 3 comps
| Address | Beds | Baths | Sqft | Rent | $/sqft | DOM | Units | Dist |
|---|---|---|---|---|---|---|---|---|
| 323 Woodale Dr Monroe, LA | 1.0–2.0 | 1.0–2.5 | 962 | $1,120 | $1.16 | 45d | 8 | 0.75mi |
| 3200 Sterlington Rd Unit HC Monroe, LA | 2.0 | 2.0 | 1112 | $1,150 | $1.03 | 23d | 1 | 1.11mi |
| 305 Raymond Dr Monroe, LA | 3.0 | 2.0 | 1952 | $3,500 | $1.79 | 23d | 1 | 1.45mi |
Listing history 2 events
-
2026-04-13status Pending
-
2026-04-08$180,000 Active
ⓘ Source: listings_history table (triggers on properties + properties_extension) + one-shot
backfill from property_details.listing_events for pre-trigger history.
Tax reassessment forecast LA · Resets to sale price
- Current annual tax
- $1,689 · $141/mo
- Projected year-2 tax
- $1,689 · $141/mo
- Expected delta
- $0/yr ($0/mo · 0.0%)
ⓘ Screening estimate from a state-policy table — verify with the county assessor before closing.
Climate risk First Street
- Flood 7/10 Severe FEMA zone X (shaded) · 97% chance over 30 yrs
- Wildfire 1/10 Low
- Heat 7/10 Severe 7 d/yr ≥111°F today · 20 d/yr by 30 yrs out
- Wind 8/10 Severe 80% chance of damaging wind over 30 yrs
- Air quality 2/10 Low 1 unhealthy d/yr today · 1 by 30 yrs out
Nearby sold comps map
Loading sold comps map…
Walkable amenities ~0.75 mi
Loading nearby amenities…
Taxation est. · year 1
- Rental income
- $21,669
- − Mortgage interest
- −$10,083
- − Property taxes
- −$1,689
- − Insurance
- −$1,697
- − Repairs & maintenance
- −$1,734
- − Management
- −$1,734
- − Depreciation
- −$5,236
- Taxable loss
- −$503
- Est. tax savings @ 24.0%
- +$121
- After-tax cash flow
- $2,526/yr
For passive investors: Depreciation is non-cash, so a rental often shows a tax loss while cash-flowing — sheltering income. Rental losses are passive: they offset passive income freely, and up to $25,000/yr can offset ordinary (W-2) income if you actively participate and your MAGI is under $100k (phasing out to $0 by $150k); unused losses carry forward. On sale, claimed depreciation is recaptured at up to 25%, and gains may owe capital-gains tax (a 1031 exchange can defer both). Figures are a year-1 estimate at your 24.0% rate — not tax advice; consult a CPA.
Schools (NCES district)
- District
- Ouachita Parish
- NCES district ID
- 2201200
- Math proficiency
- 31% ▼ -38.00%
- Reading proficiency
- 45% ▼ -31.00%
- Median HH income
- $43,316
- Composite
- 32.14/100
- National rank
- #5791
- State rank
- #26 of 98 in LA
Livability — Monroe
- Score
- 66/100
- State rank
- #128
- US rank
- #11948
Category grades
Schools grade is shown separately in the Schools card above.
Census & demographics
- County
- Ouachita Parish · 118,340 people
- City population
- 60,136
- Metro
- Monroe, LA
- Population (ZIP)
- 38,354
- Household income
- $52,326
- Rent vs Own
- Severe rent burden
- 2085.0
Population outlook (Ouachita County) Hauer SSP2
- Today (2025)
- 163,370 people
- By 2030
- 165,520 · +1.3%
- By 2040
- 167,652 · +2.6%
- By 2050
- 166,699 · +2.0%
- By 2075
- 156,348 · -4.3%
- By 2100
- 134,102 · -17.9%
Race, ethnicity, and origin ACS 2023
- Neighborhood character
- Diverse neighborhood (Simpson 0.57)
- Race & ethnicity
- Black 48% White 45% Two or more races 4% Hispanic / Latino 3% Asian 1%
- Common ancestry
- Lithuanian 3% Slovak 1% Serbian 1%
- Foreign-born
- 3% · Canada
- Languages at home
- 96% English-only · Spanish 2% Other Indo-European 1%
Political lean MEDSL · Ouachita
- 2024 margin
- Strong R (+27.9) · D 35.5% · R 63.3% · Other 1.2%
- 2008→2024 swing
- -2.7pp toward R · 2008: -25.2pp · 2024: -27.9pp
- All cycles
- 2024: R+27.9 2020: R+23.6 2016: R+25.4 2012: R+20.9 2008: R+25.2
Not yet ingested
- Civics
- —
Market trends
- HPI YoY
- ▼ -99.01%
- Current HPI
- 206.1948
- Rent YoY
- —
- Metro
- Monroe, LA
- State GDP YoY
- ▲ 3.29%
- F500 in state
- 10
Industry mix (Fortune 500 HQ in LA)
| Industry | F500 HQs | Revenue |
|---|---|---|
| Telecommunications | 2 | $23B |
|
||
| Utilities | 1 | $12B |
|
||
| Wholesale / Distribution | 1 | $5B |
|
||
| Advertising | 1 | $2B |
|
||
Price history
2 events — show timeline
- 2026-04-13 Pending — NELABOR
- 2026-04-08 Listed $180,000 NELABOR
Property tax history
+5.0%/yrLatest (2025): $1,689 · +18.6% YoY. Source: county tax records.
Cash-flow waterfall
monthlySold comps — $/sqft
last 12 mo · ≤1 miLoading sold comps…