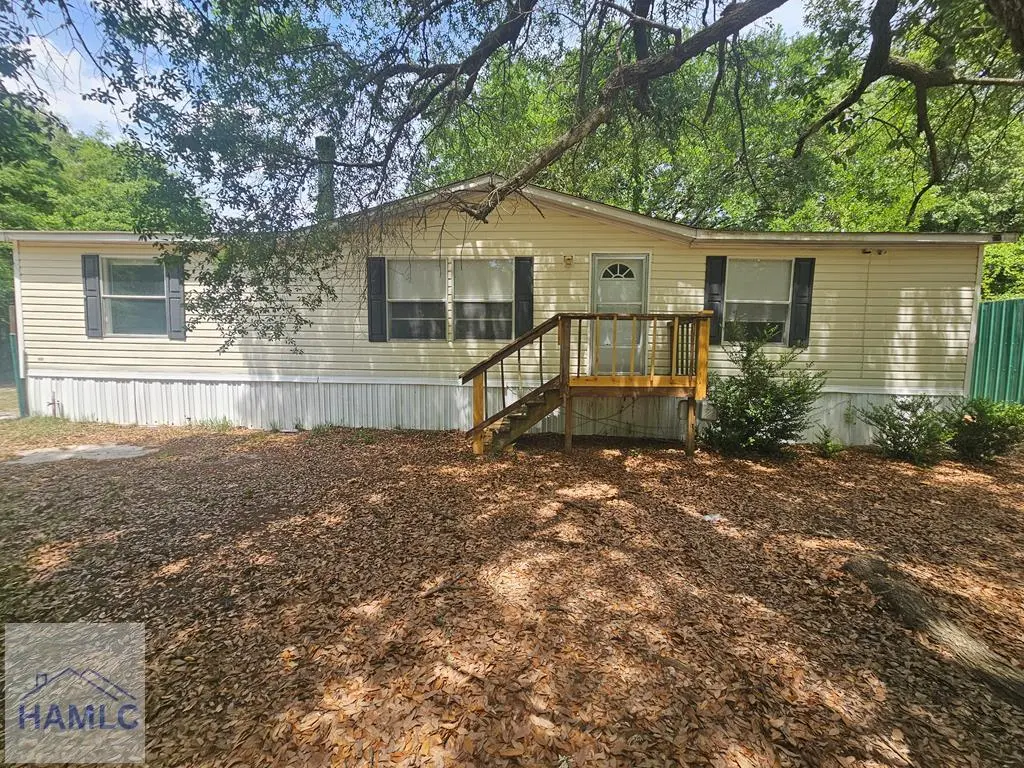
33 Sherwood Forest Drive Frst SE · Walthourville, GA
Flood risk 1/10 · Minimal
- FEMA flood zone
- X (unshaded)
- Chance of flooding over 30 yrs
- 0.0%
- Est. flood insurance / yr
- $507 – $1,088
Fire risk 6/10 · Moderate
- Est. fire insurance / yr
- $963 – $1,789
Heat risk 9/10 · Severe
- Hot days now (above 110°F)
- 7 days/yr
- Hot days in 30 yrs
- 18 days/yr
Wind risk 8/10 · Major
- Chance of severe wind over 30 yrs
- 99.0%
Air-quality risk 2/10 · Minimal
- Unhealthy air days now
- 2 days/yr
- Unhealthy air days in 30 yrs
- 2 days/yr
Risk factors via First Street. Map © Google.
Why this score? — see what drove the B+ grade
The composite is a weighted blend of 9 inputs, each scored 0–100. Each bar is that input's sub-score; the figure is the points it added to the 100-point composite (weight × sub-score).
- Cash flow +30.0/30.0
- ARV discount +15.0/15.0
- DSCR +10.0/10.0
- 1% rule +9.2/10.0
- Appreciation +5.1/10.0
- Livability +3.2/5.0
- Rent growth +2.5/5.0
- Condition / age +2.5/5.0
- Schools +2.3/10.0
$139,999
🖨 Deal sheet 📄 Offer letter ✓ Due diligence
Listing remarks MLS
BEAUTIFUL 3 BR HOME W/ 2 MASTER BR. WALK IN CLOSETS IN ALL ROOMS & HUGE FAMILY RM W/ FIREPLACE. KITCHEN HAS EAT IN AREA AND ALL STANDARD APPLIANCES. SCREENED IN PORCH W/ COVERED CARPORT. CASH ONLY!!
Key facts
- New paint
- Covered back porch
- 0.39 acre lot
Tags
Property features AI
Exterior
- Parking: Carport (1 covered space); Detached parking; Driveway
- Utilities: Public water; Septic tank; Electricity connected / electric on property
- Home design: Manufactured house; Mobile home; Entry on crawl space
- Construction: Vinyl siding, frame and wood siding exterior; Shingle roof; Pillar/post/pier foundation; Built as a manufactured/mobile home
- Exterior features: Storm door(s); Chain link fence (partial)
Interior
- Kitchen: Dishwasher; Electric range; Microwave; Refrigerator; Electric water heater
- Flooring: Tile; Vinyl
- Bathrooms: 3 full bathrooms
- Heating & cooling: Central heating (see remarks); Central air conditioning
- Interior features: Ceiling fan(s); Living room fireplace
- Laundry & utility: Washer hookup
Neighborhood map
What this means for you Summary
Snapshot
- This is a 3-bed/2.0-bath manufactured listed at $140k.
Deal economics
- At list price, monthly cash flow is $721 ($9k/yr) — positive.
- The deal already cash-flows at list — no discount required.
- Meets the 1% rule at list price ($2k rent vs $140k).
- Recommended offer: $136k (3.0% below list) — sets the bar for market timing.
- Cap rate 12.5% vs local median 5.4% in Walthourville — top-decile yield for the area; either an underpriced asset or a hidden risk that comps aren't pricing in. Stress-test before assuming the spread holds.
Location & tenants
- Location reads 64/100 on livability (#255 in GA) — a middle-class / working-renter tenant base. Strengths: cost of living A+, housing A+, crime B; Watch: employment D, amenities F, commute F.
- Long County (rural): math 26% / reading 26% proficiency, ranked #115 of 174 in GA (top 66%) — low school quality limits family demand, transient renter base, plan for 1-2y turnover; 61% free/reduced lunch — lower-income household profile, screen leases tightly.
- Zoned schools: Smiley Elementary School (1,258 students, 67% FRL); Long County Middle School (math 21% / reading 27%, grade F, #311 of 470 statewide, top 68%, 945 students, 69% FRL); Long County High School (math 37% / reading 22%, grade F, #140 of 424 statewide, top 35%, 1,209 students, 70% FRL).
- Market conditions: 140 active listings in the ZIP; 3 comparable units currently listed for rent nearby; rentals lingering (median 44d on market — plan ~5-8 weeks vacancy on turnover, expect pricing pressure); 100% of comp listings sitting > 30 days — soft ceiling on asking rent; 298 units permitted in Long County in 2024 (0 in 5+ unit buildings).
- This rent runs 36% of the median local income ($65k/yr) — at the standard rent-burdened threshold; future hikes will face affordability resistance.
Forward outlook
- In year one you build about $1k of equity ($968 loan paydown + $218 appreciation (0.2% local appreciation)).
- Long County population projected at +72% by 2050 — long-run rental-demand tailwind backs the buy-and-hold thesis.
- At projected returns (0.2% appreciation + 3.0% rent growth), your $39k cash investment doubles in ~4 years — after that, you're playing with house money.
Negotiation context
- It's been on market 42 days — a 3% lower offer ($136k) is reasonable based on typical stale-listing flexibility.
- 2 sale attempts since 14y ago with the ask held roughly flat each time — persistent listings suggest the price (not the market) is what's stuck; bring a comps-based counter.
- Current owner paid $27k; list at $140k implies a 419% gain — meaningful room to come down on a strong offer.
Risks & watch-outs
- Climate carrying-cost: severe wind risk, 99% chance of damaging wind over 30y; major wildfire risk; extreme-heat days projected 7→18/yr by 2055 (HVAC capex compounding) — expect insurance premiums to compound above CPI over the hold.
Questions for the listing agent
- It's been on market 42 days. Have you received any prior offers? Is the seller open to a 3% concession, seller financing, or rate buy-down credit?
- Is there a deadline driving the sale (1031 exchange, divorce, estate, relocation)? That informs how much negotiation room exists.
- Schools are F-rated, which usually means shorter tenancies and higher turnover. Who's the typical renter profile here, and what's been the actual vacancy rate?
- What's the average days-on-market for RENTAL listings here right now (not sales)? A rising rental-DOM trend means longer vacancies and softer asking-rent achievability than the comps imply.
- What's the recent tenant-quality profile in this submarket — average credit score on applications, eviction rate, late-payment / NSF rate, and stable-employment percentage? A property-management company in the area should have these aggregated.
- How much new for-sale + rental construction is in the pipeline within 1–3 miles? Heavy new supply typically softens prices + rents 12–24 months out; constrained supply supports both.
Investment metrics
- 1% rule
- 1.42% ✓
- Cap rate
- 12.47%
- Cash-on-cash
- 22.08%
- DSCR
- 1.98
- GRM
- 5.9
CMA / ARV
- ARV (median comp)
- $214,778
- List price
- $139,999
- Delta
- -34.82%
- Verdict
- UNDERPRICED
- Comps
- 1 within 2.0 mi
Show comp detail 2 sales within ~0.75 mi
| Address | Dist | Beds/Ba | Sqft | Sold | Price | $/sf | Match |
|---|---|---|---|---|---|---|---|
| 110 Copperhead Rd SE | 0.68mi | 3/2.0 | 1,792 (0%) | 19mo | $180,000 | $100 | 53 |
| 292 Copperhead Rd | 0.74mi | 4/2.0 (+1) | 1,664 (-7%) | 19mo | $185,500 | $111 | 33 |
Match score weights: distance 35% · size 25% · config 20% · recency 20%. Top-matched comps best support the ARV.
Projected returns pro-forma
0.16% appreciation · 3.0% rent growth · sell at horizon
- IRR
- 22.4%
- Equity multiple
- 2.09×
- Total profit
- $42,817
- Equity at exit
- $41,743
- IRR
- 26.3%
- Equity multiple
- 3.95×
- Total profit
- $115,784
- Equity at exit
- $51,056
Cash invested: $39,200 (down + closing). Projections, not guarantees.
Landlord ↔ Tenant lean methodology
- Overall (STATE)
- 90 Strongly Landlord-Friendly
- State Georgia
- 90 Strongly Landlord-Friendly · R+3
- County
- — inherits STATE
- City
- — inherits STATE
ZIP-level market 31301
- Home prices YoY
- 0.1%
- Active inventory
- 140
- Price-to-rent
- 5.9×
Monthly cashflow live
- Estimated rent
- $1,988 medium interval (Pro) →
- Mortgage (P&I)
- −$734
- Tax from tax record
- −$57 /mo · $680/yr
- Insurance
- −$58
- HOA
- −$0
- Vacancy / Maint / Mgmt
- −$417
- Net cashflow
- $721
Break-even live
UW: 25.0% down · 7.5% · 30yr · 1.5% tax · 5.0% vac · 8.0% maint · 8.0% mgmt
Financing live
Cash to close
- Down payment
- $35,000
- Closing costs
- $4,200
- Reserves months
- —
- Total cash needed
- —
Loan-product check · same deal, 3 products live
Conventional
25% down · 7.5% · 30yr
- Down + closing
- —
- Monthly P&I
- —
- Monthly cashflow
- —
- DSCR
- —
- Eligible?
- —
Personal DTI + credit; lowest rate.
DSCR
20% down · 8.5% · 30yr
- Down + closing
- —
- Monthly P&I
- —
- Monthly cashflow
- —
- DSCR
- —
- Eligible?
- —
No personal income docs; deal must DSCR.
Hard money
10% down · 12.0% · 12mo
- Down + closing
- —
- Monthly P&I
- —
- Monthly cashflow
- —
- DSCR
- —
- Eligible?
- —
Short-term bridge; refi at stabilization.
Rent comps 3 comps
| Address | Beds | Baths | Sqft | Rent | $/sqft | DOM | Units | Dist |
|---|---|---|---|---|---|---|---|---|
| 43 Sandy Run Rd SE Allenhurst, GA | 4.0 | 2.0 | 1450 | $1,800 | $1.24 | 44d | 1 | 0.86mi |
| 559 McCumber Dr Allenhurst, GA | 3.0 | 2.0 | 1936 | $1,800 | $0.93 | 44d | 1 | 1.49mi |
| 119 Belleau Woods Cir Unit 27 Hinesville, GA | 3.0 | 2.5 | 1444 | $2,075 | $1.44 | 44d | 1 | 1.50mi |
Listing history 21 events
-
2026-06-19days on market $139,999 Active 42 DOM
-
2026-06-18days on market $139,999 Active 41 DOM
-
2026-06-17days on market $139,999 Active 40 DOM
-
2026-06-16days on market $139,999 Active 39 DOM
-
2026-06-15days on market $139,999 Active 38 DOM
-
2026-06-14days on market $139,999 Active 36 DOM
-
2026-06-13days on market $139,999 Active 35 DOM
-
2026-06-10days on market $139,999 Active 33 DOM
-
2026-06-09days on market $139,999 Active 32 DOM
-
2026-06-08days on market $139,999 Active 31 DOM
-
2026-06-07days on market $139,999 Active 30 DOM
-
2026-06-05days on market $139,999 Active 27 DOM
-
2026-06-03days on market $139,999 Active 26 DOM
-
2026-06-02days on market $139,999 Active 25 DOM
-
2026-06-01days on market $139,999 Active 24 DOM
-
2026-05-31days on market $139,999 Active 23 DOM
-
2026-05-30days on market $139,999 Active 22 DOM
-
2026-05-01$139,999 Active 676-char remark
-
2013-10-04soldstatus $27,000 204-char remark
Show marketing remark (204 chars)
BEAUTIFUL 3 BR HOME W/ 2 MASTER BR. WALK IN CLOSETS IN ALL ROOMS & HUGE FAMILY RM W/ FIREPLACE. KITCHEN HAS EAT IN AREA AND ALL STANDARD APPLIANCES. SCREENED IN PORCH W/ COVERED CARPORT. CASH ONLY!!
-
2012-10-04soldstatus $27,000
Show marketing remark (182 chars)
BEAUTIFUL 3 BR HOME W/ MASTER BR. WALK IN CLOSETS IN ALL ROOMS & HUGE FAMILY RM W/ FIREPLACE. KITCHEN HAS EAT IN AREA AND ALL STANDARD APPLIANCES, SCREENED IN PORCH. CASH ONLY!!!
-
2012-03-12$27,000 204-char remark
Show marketing remark (204 chars)
BEAUTIFUL 3 BR HOME W/ 2 MASTER BR. WALK IN CLOSETS IN ALL ROOMS & HUGE FAMILY RM W/ FIREPLACE. KITCHEN HAS EAT IN AREA AND ALL STANDARD APPLIANCES. SCREENED IN PORCH W/ COVERED CARPORT. CASH ONLY!!
ⓘ Source: listings_history table (triggers on properties + properties_extension) + one-shot
backfill from property_details.listing_events for pre-trigger history.
Tax reassessment forecast GA · Resets to sale price
- Current annual tax
- $680 · $57/mo
- Projected year-2 tax
- $1,288 · $107/mo
- Expected delta
- +$608/yr (+$51/mo · 89.4%)
ⓘ Screening estimate from a state-policy table — verify with the county assessor before closing.
Climate risk First Street
- Flood 1/10 Low FEMA zone X (unshaded) · 0% chance over 30 yrs
- Wildfire 6/10 Major
- Heat 9/10 Extreme 7 d/yr ≥110°F today · 18 d/yr by 30 yrs out
- Wind 8/10 Severe 99% chance of damaging wind over 30 yrs
- Air quality 2/10 Low 2 unhealthy d/yr today · 2 by 30 yrs out
Nearby sold comps map
Loading sold comps map…
Walkable amenities ~0.75 mi
Loading nearby amenities…
Taxation est. · year 1
- Rental income
- $23,853
- − Mortgage interest
- −$7,842
- − Property taxes
- −$680
- − Insurance
- −$700
- − Repairs & maintenance
- −$1,908
- − Management
- −$1,908
- − Depreciation
- −$4,073
- Taxable income
- $6,741
- Est. tax owed @ 24.0%
- −$1,618
- After-tax cash flow
- $7,036/yr
For passive investors: Depreciation is non-cash, so a rental often shows a tax loss while cash-flowing — sheltering income. Rental losses are passive: they offset passive income freely, and up to $25,000/yr can offset ordinary (W-2) income if you actively participate and your MAGI is under $100k (phasing out to $0 by $150k); unused losses carry forward. On sale, claimed depreciation is recaptured at up to 25%, and gains may owe capital-gains tax (a 1031 exchange can defer both). Figures are a year-1 estimate at your 24.0% rate — not tax advice; consult a CPA.
Schools (NCES district)
- District
- Long County
- NCES district ID
- 1303360
- Math proficiency
- 26% ▼ -14.00%
- Reading proficiency
- 26% ▼ -13.00%
- Median HH income
- $45,958
- Composite
- 22.51/100
- National rank
- #8090
- State rank
- #115 of 174 in GA
Livability — Walthourville
- Score
- 64/100
- State rank
- #255
- US rank
- #14108
Category grades
Schools grade is shown separately in the Schools card above.
Census & demographics
- County
- Liberty County · 58,565 people
- City population
- 4,933
- Metro
- Hinesville, GA
- Population (ZIP)
- 4,933
- Household income
- $65,417
- Rent vs Own
- Severe rent burden
- 121.0
Population outlook (Long County) Hauer SSP2
- Today (2025)
- 24,669 people
- By 2030
- 28,223 · +14.4%
- By 2040
- 35,430 · +43.6%
- By 2050
- 42,403 · +71.9%
- By 2075
- 56,996 · +131.0%
- By 2100
- 64,185 · +160.2%
Race, ethnicity, and origin ACS 2023
- Neighborhood character
- Diverse neighborhood (Simpson 0.64)
- Race & ethnicity
- Black 51% White 31% Two or more races 15% Hispanic / Latino 9%
- Hispanic origin (detail)
- Mexican 2% Puerto Rican 7%
- Common ancestry
- Slovak 1% Lithuanian 1%
- Foreign-born
- 3% · Canada
- Languages at home
- 96% English-only · Spanish 2%
Political lean MEDSL · Long
- 2024 margin
- Strong R (+29.5) · D 35.1% · R 64.6%
- 2008→2024 swing
- -5.4pp toward R · 2008: -24.1pp · 2024: -29.5pp
- All cycles
- 2024: R+29.5 2020: R+26.4 2016: R+30.8 2012: R+22.9 2008: R+24.1
Not yet ingested
- Civics
- —
Market trends
- HPI YoY
- ▲ 0.16%
- Current HPI
- 187.7716
- Rent YoY
- —
- Metro
- Hinesville, GA
- State GDP YoY
- ▲ 2.66%
- F500 in state
- 28
Industry mix (Fortune 500 HQ in GA)
| Industry | F500 HQs | Revenue |
|---|---|---|
| Paper / Packaging | 2 | $29B |
|
||
| Retail | 1 | $160B |
|
||
| Transportation / Logistics | 1 | $91B |
|
||
| Airlines | 1 | $62B |
|
||
| Consumer Goods | 1 | $47B |
|
||
| Utilities | 1 | $25B |
|
||
Price history
+418.5% since first listed4 events — show timeline
- 2026-05-01 Listed $139,999 HABR
- 2013-10-04 Sold (MLS) $27,000 Hive MLS
- 2012-10-04 Sold (MLS) $27,000 GAMLS
- 2012-03-12 Listed $27,000 Hive MLS
Property tax history
+1.5%/yrLatest (2025): $680 · -25.6% YoY. Source: county tax records.
Cash-flow waterfall
monthlySold comps — $/sqft
last 12 mo · ≤1 miLoading sold comps…