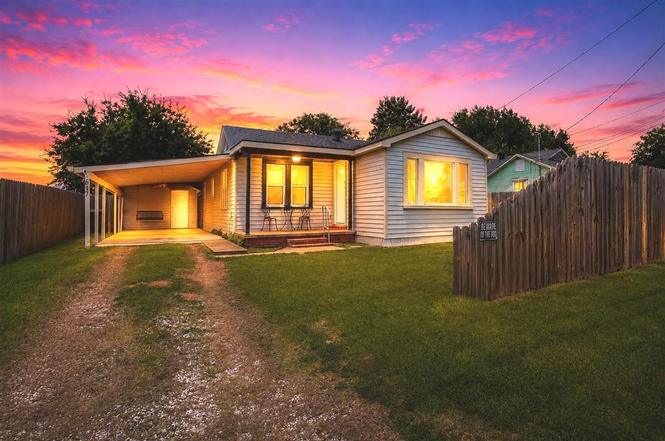
617 Sycamore St · Lake Charles, LA
Flood risk 1/10 · Minimal
- FEMA flood zone
- X (unshaded)
- Chance of flooding over 30 yrs
- 0.0%
- Est. flood insurance / yr
- $507 – $1,088
Fire risk 1/10 · Minimal
- Est. fire insurance / yr
- $1,269 – $2,357
Heat risk 9/10 · Severe
- Hot days now (above 109°F)
- 7 days/yr
- Hot days in 30 yrs
- 22 days/yr
Wind risk 9/10 · Severe
- Chance of severe wind over 30 yrs
- 99.0%
Air-quality risk 2/10 · Minimal
- Unhealthy air days now
- 1 days/yr
- Unhealthy air days in 30 yrs
- 1 days/yr
Risk factors via First Street. Map © Google.
Why this score? — see what drove the D- grade
The composite is a weighted blend of 9 inputs, each scored 0–100. Each bar is that input's sub-score; the figure is the points it added to the 100-point composite (weight × sub-score).
- Cash flow +17.8/30.0
- DSCR +5.6/10.0
- Rent growth +4.0/5.0
- 1% rule +3.5/10.0
- Livability +3.4/5.0
- Schools +3.1/10.0
- Condition / age +2.5/5.0
- ARV discount +0.0/15.0
- Appreciation +0.0/10.0
$124,000
🖨 Deal sheet 📄 Offer letter ✓ Due diligence
Listing remarks
This charming 2-bed, 1-bath home was renovated to the studs in 2021 with new roof, electrical, plumbing, double-pane windows, sheetrock, sub floor, flooring, bathroom, kitchen, etc! Home is move-in ready and offers a BONUS ROOM that could be dining, bedroom, or office!! The kitchen offers updated stainless-steel appliances and is open to the living room. The property is fully privacy fenced with a generous sized yard, an attached carport, and 12x20 workshop with electrical. Home has central air/heat and window units (left in after storm). Property is in flood zone x, where typically no flood insurance is required. Home has never flooded. Home would have a newer “Year Built Effective D
Key facts
- Central air heat
- Attached carport
- Generous sized yard
Tags
Property features AI
Exterior
- Parking: Covered carport; Open parking
- Utilities: Public water; Public sewer; Electricity connected; Natural gas connected; Water connected
- Home design: Single-family residence (house); One story; Updated/remodeled condition; No common walls
- Construction: Vinyl siding; Raised foundation with pillars/posts/piers; Built as a single-family house
- Exterior features: Front porch; Wood privacy fencing; Workshop structure; Paved road frontage on a city street; Has a view
Interior
- Kitchen: Dishwasher; Gas oven; Gas range
- Bedrooms: One main-level bedroom
- Bathrooms: One full bathroom on the main level
- Heating & cooling: Central heating with heat pump; Central air conditioning
- Interior features: Updated/remodeled interior; No fireplace
- Laundry & utility: Washer hookup; Electric dryer hookup; Gas water heater and additional water heater
Neighborhood map
What this means for you Summary
Snapshot
- This is a 2-bed/1.0-bath single-family listed at $124k.
Deal economics
- At list price, monthly cash flow is $102 ($1k/yr) — positive.
- The deal already cash-flows at list — no discount required.
- To meet the 1% rule (rent ≥ 1% of price), the offer needs to be $105k (15.0% below list).
- Recommended offer: $105k (15.0% below list) — sets the bar for 1% rule.
- Cap rate 7.3% vs local median 4.3% in Lake Charles — top-decile yield for the area; either an underpriced asset or a hidden risk that comps aren't pricing in. Stress-test before assuming the spread holds.
Location & tenants
- Location reads 68/100 on livability (#95 in LA) — a middle-class / working-renter tenant base. Strengths: commute A+, cost of living A+, housing A+; Watch: crime F, amenities F, employment D-.
- Calcasieu Parish (other): math 30% / reading 44% proficiency, ranked #29 of 98 in LA (top 30%) — families likely to look elsewhere, expect single-tenant / working-renter base with shorter leases.
- Market conditions: Rents rising fast (+6.2%/yr); 363 active listings in the ZIP; 23 comparable units currently listed for rent nearby; rentals at typical pace (median 21d on market — plan ~3-4 weeks tenant-placement turnaround); 1,298 units permitted in Calcasieu Parish in 2024 (526 in 5+ unit buildings).
Forward outlook
- Local home prices are declining (-3.0%/yr); year-one equity from $857 of loan paydown is wiped out by about $4k of value loss. Plan a longer hold.
- Calcasieu County population projected at +11% by 2050 — modest demand growth; plan on rents tracking national, not racing it.
Negotiation context
- Only 4 days on market — expect competitive offers; lowballing is unlikely to land.
- Current owner paid $80k; list at $124k implies a 55% gain — meaningful room to come down on a strong offer.
Risks & watch-outs
- Climate carrying-cost: severe wind risk, 99% chance of damaging wind over 30y; extreme-heat days projected 7→22/yr by 2055 (HVAC capex compounding) — expect insurance premiums to compound above CPI over the hold.
Questions for the listing agent
- Is there a deadline driving the sale (1031 exchange, divorce, estate, relocation)? That informs how much negotiation room exists.
- Schools are B-rated — typically a magnet for longer-tenancy family renters. What's the average tenant stay here, and is there a school-zone premium baked into asking?
- Crime grade is F in this area — have there been break-ins, vandalism, or insurance claims at this property in the last 3 years? What carrier currently insures it and at what premium?
- The area grade is low — what's the realistic commute time and amenity access for the typical tenant pool here? Any planned neighborhood developments (good or bad) we should know about?
- What's the average days-on-market for RENTAL listings here right now (not sales)? A rising rental-DOM trend means longer vacancies and softer asking-rent achievability than the comps imply.
- What's the recent tenant-quality profile in this submarket — average credit score on applications, eviction rate, late-payment / NSF rate, and stable-employment percentage? A property-management company in the area should have these aggregated.
- How much new for-sale + rental construction is in the pipeline within 1–3 miles? Heavy new supply typically softens prices + rents 12–24 months out; constrained supply supports both.
Investment metrics
- 1% rule
- 0.85% ✗
- Cap rate
- 7.28%
- Cash-on-cash
- 3.52%
- DSCR
- 1.16
- GRM
- 9.8
CMA / ARV
- ARV (on-the-fly)
- $105,141
- Comps found
- 12
Show comp detail 12 sales within ~0.75 mi
| Address | Dist | Beds/Ba | Sqft | Sold | Price | $/sf | Match |
|---|---|---|---|---|---|---|---|
| 710 11th St | 0.44mi | 2/1.0 | 999 (-4%) | 14mo | $45,000 | $45 | 61 |
| 202 Eddy St | 0.62mi | 2/1.0 | 1,007 (-3%) | 8mo | $94,000 | $93 | 59 |
| 1734 Moss St St | 0.56mi | 2/2.0 | 989 (-5%) | 4mo | $109,900 | $111 | 59 |
| 1014 Fall St St | 0.41mi | 2/1.0 | 1,190 (+14%) | 2mo | $45,000 | $38 | 55 |
| 707 Fall St | 0.19mi | 3/1.5 (+1) | 1,192 (+14%) | 10mo | $52,000 | $44 | 51 |
| 624 8th St | 0.68mi | 2/2.0 | 1,110 (+7%) | 3mo | $144,990 | $131 | 51 |
| 122 W 15th St W | 0.52mi | 2/1.0 | 914 (-12%) | 8mo | $62,000 | $68 | 49 |
| 3022 Louisiana Ave | 0.60mi | 3/1.0 (+1) | 1,100 (+6%) | 12mo | $115,000 | $105 | 48 |
| 819 Craft St | 0.52mi | 3/2.0 (+1) | 1,156 (+11%) | 3mo | $143,000 | $124 | 46 |
| 3101 Center St | 0.45mi | 3/1.0 (+1) | 1,180 (+13%) | 10mo | $119,000 | $101 | 44 |
| 3206 Louisiana Ave | 0.70mi | 3/1.0 (+1) | 1,120 (+8%) | 14mo | $66,000 | $59 | 38 |
| 222 W Hale St W | 0.70mi | 3/1.0 (+1) | 1,192 (+14%) | 8mo | $120,000 | $101 | 32 |
Match score weights: distance 35% · size 25% · config 20% · recency 20%. Top-matched comps best support the ARV.
Projected returns pro-forma
-3.0% appreciation · 6.18% rent growth · sell at horizon
- IRR
- -7.7%
- Equity multiple
- 0.71×
- Total profit
- $-10,182
- Equity at exit
- $18,489
- IRR
- 5.0%
- Equity multiple
- 1.42×
- Total profit
- $14,484
- Equity at exit
- $10,721
Cash invested: $34,720 (down + closing). Projections, not guarantees.
Landlord ↔ Tenant lean methodology
- Overall (STATE)
- 90 Strongly Landlord-Friendly
- State Louisiana
- 90 Strongly Landlord-Friendly · R+12
- County
- — inherits STATE
- City
- — inherits STATE
ZIP-level market 70601
- Rents YoY
- 6.2%
- Active inventory
- 363
- Price-to-rent
- 9.8×
Monthly cashflow live
- Estimated rent
- $1,054 high interval (Pro) →
- Mortgage (P&I)
- −$650
- Tax from tax record
- −$29 /mo · $343/yr
- Insurance
- −$52
- HOA
- −$0
- Vacancy / Maint / Mgmt
- −$221
- Net cashflow
- $102
Break-even live
UW: 25.0% down · 7.5% · 30yr · 1.5% tax · 5.0% vac · 8.0% maint · 8.0% mgmt
Financing live
Cash to close
- Down payment
- $31,000
- Closing costs
- $3,720
- Reserves months
- —
- Total cash needed
- —
Loan-product check · same deal, 3 products live
Conventional
25% down · 7.5% · 30yr
- Down + closing
- —
- Monthly P&I
- —
- Monthly cashflow
- —
- DSCR
- —
- Eligible?
- —
Personal DTI + credit; lowest rate.
DSCR
20% down · 8.5% · 30yr
- Down + closing
- —
- Monthly P&I
- —
- Monthly cashflow
- —
- DSCR
- —
- Eligible?
- —
No personal income docs; deal must DSCR.
Hard money
10% down · 12.0% · 12mo
- Down + closing
- —
- Monthly P&I
- —
- Monthly cashflow
- —
- DSCR
- —
- Eligible?
- —
Short-term bridge; refi at stabilization.
Rent comps 23 comps
| Address | Beds | Baths | Sqft | Rent | $/sqft | DOM | Units | Dist |
|---|---|---|---|---|---|---|---|---|
| 603 Falls St Lake Charles, LA | 2.0 | 1.0 | 825 | $825 | $1.00 | 20d | 1 | 0.20mi |
| 1028 Alamo St Lake Charles, LA | 2.0 | 1.0 | 865 | $850 | $0.98 | 20d | 1 | 0.52mi |
| 1300 16th St Lake Charles, LA | 2.0 | 1.5 | 1344 | $1,295 | $0.96 | 20d | 1 | 0.61mi |
| 3206 Hodges St Lake Charles, LA | 2.0 | 1.0 | 1497 | $1,200 | $0.80 | 43d | 1 | 0.63mi |
| 200 W 11th St Unit 4 Lake Charles, LA | 1.0 | 1.0 | 700 | $875 | $1.25 | 20d | 1 | 0.66mi |
| 1710 Granger St Lake Charles, LA | 3.0 | 2.5 | 1450 | $1,900 | $1.31 | 43d | 1 | 0.67mi |
| 2700 Ernest St Lake Charles, LA | 1.0–3.0 | 1.0–2.0 | 1054 | $1,333 | $1.26 | 13d | 1 | 0.69mi |
| 1605 W Common St Unit 1 Lake Charles, LA | 1.0 | 1.0 | 750 | $925 | $1.23 | 20d | 1 | 0.75mi |
| 125 East St Lake Charles, LA | 3.0 | 2.0 | 1138 | $3,850 | $3.38 | 43d | 1 | 0.78mi |
| 3108 Aster St Unit M Lake Charles, LA | 2.0 | 1.0 | 1100 | $1,300 | $1.18 | 13d | 1 | 0.93mi |
| 807 Camelia St Lake Charles, LA | 3.0 | 1.0 | 1322 | $1,500 | $1.13 | 43d | 1 | 0.97mi |
| 520 E Lagrange St Unit 12 Lake Charles, LA | 1.0 | 1.0 | 700 | $749 | $1.07 | 20d | 1 | 0.98mi |
| 3506 Common St Unit 11 Lake Charles, LA | 2.0 | 1.0 | 910 | $950 | $1.04 | 13d | 1 | 0.98mi |
| 114 W Lagrange St Apt 18 Lake Charles, LA | 2.0 | 1.0 | 1200 | $1,300 | $1.08 | 20d | 1 | 0.99mi |
| 121 W Lagrange St Lake Charles, LA | 1.0 | 1.0 | 850 | $750 | $0.88 | 43d | 1 | 1.06mi |
| 1505 7th St Lake Charles, LA | 2.0 | 1.0 | 1054 | $900 | $0.85 | 43d | 1 | 1.11mi |
| 422 W Lagrange St Lake Charles, LA | 1.0 | 1.0 | 775 | $900 | $1.16 | 20d | 1 | 1.18mi |
| 422 W Lagrange St Lake Charles, LA | 2.0 | 2.0 | 995 | $1,050 | $1.06 | 43d | 1 | 1.18mi |
| 3715 Common St Unit B1 Lake Charles, LA | 2.0 | 2.0 | 900 | $1,395 | $1.55 | 13d | 1 | 1.25mi |
| 1915 Legion St Lake Charles, LA | 3.0 | 1.0 | 966 | $950 | $0.98 | 13d | 1 | 1.27mi |
| 3322 Kingham Rd Unit 2 Lake Charles, LA | 2.0 | 1.0 | 870 | $1,075 | $1.24 | 43d | 1 | 1.32mi |
| 823 Kirkman St Unit 4 Lake Charles, LA | 1.0 | 1.0 | 950 | $600 | $0.63 | 20d | 1 | 1.35mi |
| 317 W School St Unit A Lake Charles, LA | 2.0 | 1.0 | 825 | $900 | $1.09 | 43d | 1 | 1.40mi |
Listing history 5 events
-
2026-06-19days on market $124,000 Active 4 DOM
-
2026-06-18days on market $124,000 Active 3 DOM
-
2026-06-17days on market $124,000 Active 2 DOM
-
2026-06-15remarks 693-char remark
-
2026-06-15$124,000 Active 1 DOM
ⓘ Source: listings_history table (triggers on properties + properties_extension) + one-shot
backfill from property_details.listing_events for pre-trigger history.
Tax reassessment forecast LA · Resets to sale price
- Current annual tax
- $343 · $29/mo
- Projected year-2 tax
- $682 · $57/mo
- Expected delta
- +$339/yr (+$28/mo · 98.9%)
ⓘ Screening estimate from a state-policy table — verify with the county assessor before closing.
Climate risk First Street
- Flood 1/10 Low FEMA zone X (unshaded) · 0% chance over 30 yrs
- Wildfire 1/10 Low
- Heat 9/10 Extreme 7 d/yr ≥109°F today · 22 d/yr by 30 yrs out
- Wind 9/10 Extreme 99% chance of damaging wind over 30 yrs
- Air quality 2/10 Low 1 unhealthy d/yr today · 1 by 30 yrs out
Nearby sold comps map
Loading sold comps map…
Walkable amenities ~0.75 mi
Loading nearby amenities…
Taxation est. · year 1
- Rental income
- $12,645
- − Mortgage interest
- −$6,946
- − Property taxes
- −$343
- − Insurance
- −$620
- − Repairs & maintenance
- −$1,012
- − Management
- −$1,012
- − Depreciation
- −$3,607
- Taxable loss
- −$894
- Est. tax savings @ 24.0%
- +$215
- After-tax cash flow
- $1,438/yr
For passive investors: Depreciation is non-cash, so a rental often shows a tax loss while cash-flowing — sheltering income. Rental losses are passive: they offset passive income freely, and up to $25,000/yr can offset ordinary (W-2) income if you actively participate and your MAGI is under $100k (phasing out to $0 by $150k); unused losses carry forward. On sale, claimed depreciation is recaptured at up to 25%, and gains may owe capital-gains tax (a 1031 exchange can defer both). Figures are a year-1 estimate at your 24.0% rate — not tax advice; consult a CPA.
Schools (NCES district)
- District
- Calcasieu Parish
- NCES district ID
- 2200330
- Math proficiency
- 30% ▼ -39.00%
- Reading proficiency
- 44% ▼ -33.00%
- Median HH income
- $44,700
- Composite
- 31.45/100
- National rank
- #5979
- State rank
- #29 of 98 in LA
Livability — Lake Charles
- Score
- 68/100
- State rank
- #95
- US rank
- #9820
Category grades
Schools grade is shown separately in the Schools card above.
Census & demographics
- Census place
- Lake Charles, LA
- County
- Calcasieu Parish · 170,889 people
- City population
- 133,538
- Metro
- Lake Charles, LA
- Population (ZIP)
- 30,872
- Household income
- $49,992
- Rent vs Own
- Severe rent burden
- 1304.0
Population outlook (Calcasieu County) Hauer SSP2
- Today (2025)
- 212,179 people
- By 2030
- 218,199 · +2.8%
- By 2040
- 228,486 · +7.7%
- By 2050
- 236,208 · +11.3%
- By 2075
- 251,696 · +18.6%
- By 2100
- 247,848 · +16.8%
Race, ethnicity, and origin ACS 2023
- Neighborhood character
- Diverse neighborhood (Simpson 0.55)
- Race & ethnicity
- Black 59% White 31% Two or more races 7% Hispanic / Latino 5%
- Common ancestry
- Lithuanian 7% Iranian 1% Serbian 1%
- Foreign-born
- 3% · Canada
- Languages at home
- 95% English-only · Spanish 2% French/Haitian/Cajun 1%
Political lean MEDSL · Calcasieu
- 2024 margin
- Solid R (+39.6) · D 29.5% · R 69.0% · Other 1.5%
- 2008→2024 swing
- -15.0pp toward R · 2008: -24.6pp · 2024: -39.6pp
- All cycles
- 2024: R+39.6 2020: R+35.2 2016: R+33.3 2012: R+28.7 2008: R+24.6
Not yet ingested
- Civics
- —
Market trends
- HPI YoY
- ▼ -109.32%
- Current HPI
- 55.6127
- Rent YoY
- ▲ 6.18%
- Metro
- Lake Charles, LA
- State GDP YoY
- ▲ 3.29%
- F500 in state
- 10
Industry mix (Fortune 500 HQ in LA)
| Industry | F500 HQs | Revenue |
|---|---|---|
| Telecommunications | 2 | $23B |
|
||
| Utilities | 1 | $12B |
|
||
| Wholesale / Distribution | 1 | $5B |
|
||
| Advertising | 1 | $2B |
|
||
Price history
+313.3% since first listed3 events — show timeline
- 2026-06-15 Listed $124,000 SWLAR
- 2014-08-04 Sold (Public Records) $80,000 Public Records
- 1998-04-28 Sold (Public Records) $30,000 Public Records
Property tax history
-0.4%/yrLatest (2025): $343 · +1.3% YoY. Source: county tax records.
Cash-flow waterfall
monthlySold comps — $/sqft
last 12 mo · ≤1 miLoading sold comps…