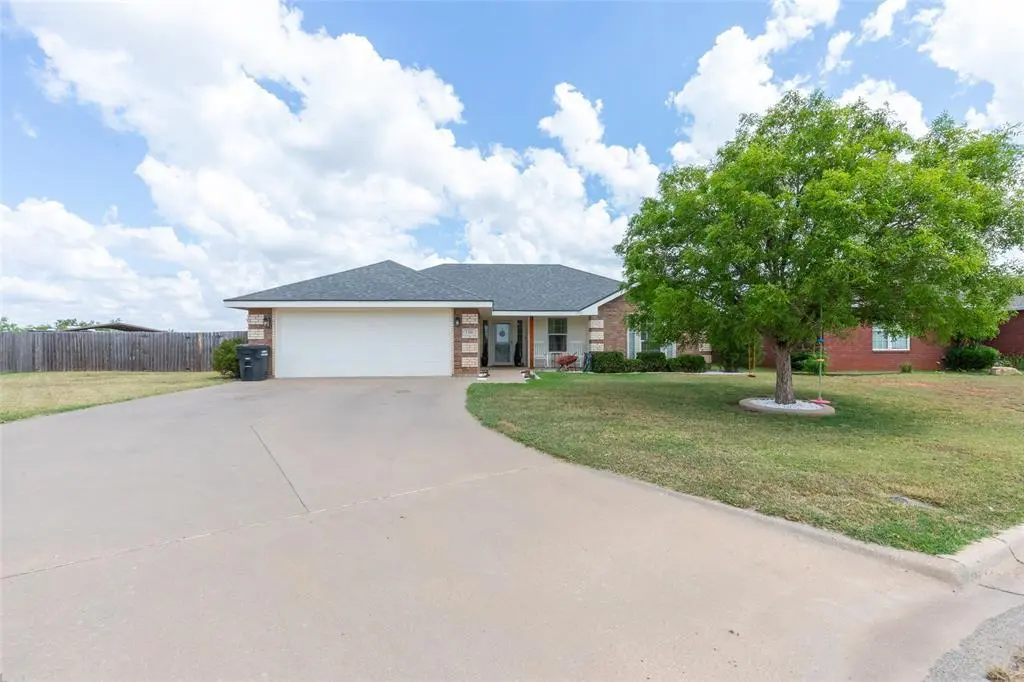
190 Cotton Candy Rd · Abilene, TX
Flood risk 1/10 · Minimal
- FEMA flood zone
- X (unshaded)
- Chance of flooding over 30 yrs
- 0.0%
- Est. flood insurance / yr
- $507 – $1,088
Fire risk 8/10 · Major
- Est. fire insurance / yr
- $1,222 – $2,270
Heat risk 7/10 · Major
- Hot days now (above 103°F)
- 7 days/yr
- Hot days in 30 yrs
- 25 days/yr
Wind risk 4/10 · Minor
- Chance of severe wind over 30 yrs
- 13.0%
Air-quality risk 1/10 · Minimal
- Unhealthy air days now
- 0 days/yr
- Unhealthy air days in 30 yrs
- 0 days/yr
Risk factors via First Street. Map © Google.
Why this score? — see what drove the D+ grade
The composite is a weighted blend of 9 inputs, each scored 0–100. Each bar is that input's sub-score; the figure is the points it added to the 100-point composite (weight × sub-score).
- Cash flow +17.8/30.0
- DSCR +5.6/10.0
- Schools +5.6/10.0
- 1% rule +5.4/10.0
- Rent growth +5.0/5.0
- Livability +3.8/5.0
- Condition / age +2.5/5.0
- ARV discount +1.6/15.0
- Appreciation +0.0/10.0
$300,000
🖨 Deal sheet (PDF) 📄 Offer letter ✓ Due diligence
Listing remarks MLS
Wylie ISD with almost one third of an acre! There's plenty of outdoor space for family and friends to hang out this Summer with this oversized lot! Enjoy the covered deck or covered patio...even enjoy the neighbor's pet donkeys...the sellers even installed a donkey door on the back fence so you can feed the donkeys! Adorable, well maintained home in the desired Parkside Place subdivision...let's see how we can make this home YOURS!
Key facts
- Quartz countertops
- Expansive yard
- Updated kitchen
Tags
Property features AI
Finance
- Other: Property sold with deed restrictions; Easements for utilities
- Financial info: Listing terms include Cash, Conventional, FHA, VA
- HOA & community: No homeowners association
Exterior
- Parking: Attached 2-car garage (24' width, 23' height) with garage door opener and garage faces front; Carport and covered parking; Driveway and on-street parking
- Security: Security system (owned); Smoke detector(s)
- Utilities: City sewer; Electricity available and connected; Cable available; Curbs and asphalt streets; Sewer available; Underground utilities; Not in a municipal utility district
- Home design: Single family residence; One-story; Interior lot on a cul-de-sac; Deed-restricted subdivision (Parkside Place Sub)
- Construction: Brick construction; Built in 2006; Slab foundation
- Exterior features: Covered front and rear porches; Covered porch(es); Private, landscaped yard with large backyard grass; Sprinkler system; Fire pit; Pergola; Gutters; RV/Boat parking; Wood fenced backyard (fenced)
Interior
- Kitchen: Eat-in kitchen with breakfast bar and built-in cabinets; Natural stone/granite counters; Pantry; Water line to refrigerator; Dishwasher; Electric range; Disposal; Refrigerator
- Bedrooms: 3 bedrooms (all on the main level); Primary bedroom on main level with ensuite bath, garden tub, separate shower, dual sinks and walk-in closet
- Flooring: Carpet; Ceramic tile; Vinyl
- Bathrooms: 2 full bathrooms; Primary bath with garden tub, separate shower and dual sinks
- Heating & cooling: Central heating; Electric heating; Fireplace insert; Fireplace(s); Central air; Ceiling fan(s); Electric cooling
- Interior features: Open floorplan with vaulted ceilings; Decorative lighting; Cable TV available; High speed internet available; Pantry; Double vanity; Walk-in closet(s); Bay window(s); Window coverings
- Laundry & utility: Separate utility room with built-in cabinets; Full-size washer/dryer area; Washer hookup and electric dryer hookup; Utility/utility room
Neighborhood map
What this means for you Summary
Snapshot
- This is a 3-bed/2.0-bath single-family listed at $300k.
Deal economics
- At list price, monthly cash flow is $246 ($3k/yr) — positive.
- The deal already cash-flows at list — no discount required.
- Meets the 1% rule at list price ($3k rent vs $300k).
Location & tenants
- Location reads 75/100 on livability (#142 in TX, #4,037 nationally) — a middle-class / working-renter tenant base. Strengths: cost of living A+, housing A+, health & safety A+; Watch: crime D, commute F.
- Wylie ISD (rural): math 63% / reading 62% proficiency, ranked #32 of 826 in TX (top 4%) — acceptable for families but not a draw, mixed tenant base, ~2y average lease; only 17% free/reduced lunch — higher-income household profile.
- Zoned schools: Wylie East El (math 58% / reading 58%, grade C+, #480 of 4,322 statewide, top 11%, 789 students, 30% FRL).
- Market conditions: Rents rising fast (+33.5%/yr); 370 active listings in the ZIP; 17 comparable units currently listed for rent nearby; rentals leasing fast (median 14d on market — plan ~1-2 weeks tenant-placement turnaround); solid renter incomes; 508 units permitted in Taylor County in 2024 (0 in 5+ unit buildings).
- This rent runs 42% of the median local income ($90k/yr) — at the standard rent-burdened threshold; future hikes will face affordability resistance.
Forward outlook
- Local home prices are declining (-3.0%/yr); year-one equity from $2k of loan paydown is wiped out by about $9k of value loss. Plan a longer hold.
- Taylor County population projected at +16% by 2050 — long-run rental-demand tailwind backs the buy-and-hold thesis.
- At projected returns (-3.0% appreciation + 8.0% rent growth), your $84k cash investment doubles in ~10 years — after that, you're playing with house money.
Negotiation context
- Only 2 days on market — expect competitive offers; lowballing is unlikely to land.
- 4 sale attempts since 20y ago; this cycle's ask is 9% above the opening price — seller raised mid-cycle; expect resistance to lowballs.
Risks & watch-outs
- Climate carrying-cost: severe wildfire risk; extreme-heat days projected 7→25/yr by 2055 (HVAC capex compounding) — expect insurance premiums to compound above CPI over the hold.
Questions for the listing agent
- Is there a deadline driving the sale (1031 exchange, divorce, estate, relocation)? That informs how much negotiation room exists.
- Schools are D-rated, which usually means shorter tenancies and higher turnover. Who's the typical renter profile here, and what's been the actual vacancy rate?
- Crime grade is D in this area — have there been break-ins, vandalism, or insurance claims at this property in the last 3 years? What carrier currently insures it and at what premium?
- The area grade is low — what's the realistic commute time and amenity access for the typical tenant pool here? Any planned neighborhood developments (good or bad) we should know about?
- What's the average days-on-market for RENTAL listings here right now (not sales)? A rising rental-DOM trend means longer vacancies and softer asking-rent achievability than the comps imply.
- What's the recent tenant-quality profile in this submarket — average credit score on applications, eviction rate, late-payment / NSF rate, and stable-employment percentage? A property-management company in the area should have these aggregated.
- How much new for-sale + rental construction is in the pipeline within 1–3 miles? Heavy new supply typically softens prices + rents 12–24 months out; constrained supply supports both.
Investment metrics
- 1% rule
- 1.04% ✓
- Cap rate
- 7.28%
- Cash-on-cash
- 3.52%
- DSCR
- 1.16
- GRM
- 8.0
CMA / ARV
- ARV (on-the-fly)
- $265,356
- Comps found
- 12
Show comp detail 12 sales within ~0.75 mi
| Address | Dist | Beds/Ba | Sqft | Sold | Price | $/sf | Match |
|---|---|---|---|---|---|---|---|
| 334 Lollipop Trl | 0.27mi | 3/2.0 | 1,456 (-0%) | 6mo | $265,000 | $182 | 82 |
| 249 Lollipop Trl | 0.21mi | 3/2.0 | 1,537 (+5%) | 3mo | $295,000 | $192 | 79 |
| 250 Sugarberry Ave | 0.10mi | 3/2.0 | 1,580 (+8%) | 5mo | $273,000 | $173 | 78 |
| 334 Miss Ellie Ln | 0.31mi | 3/2.0 | 1,437 (-1%) | 7mo | $269,900 | $188 | 77 |
| 390 Lollipop Trl | 0.35mi | 3/2.0 | 1,449 (-1%) | 7mo | $260,000 | $179 | 77 |
| 202 Sugarberry Ave | 0.05mi | 3/2.0 | 1,598 (+10%) | 7mo | $269,900 | $169 | 76 |
| 233 Sugarberry Ave | 0.10mi | 4/2.0 (+1) | 1,579 (+8%) | 7mo | $265,000 | $168 | 71 |
| 349 Lollipop Trl | 0.31mi | 4/2.0 (+1) | 1,569 (+8%) | 1mo | $285,000 | $182 | 67 |
| 365 Lollipop Trl | 0.33mi | 3/2.0 | 1,595 (+9%) | 4mo | $280,000 | $176 | 65 |
| 5141 Yellowstone Trl | 0.61mi | 3/2.0 | 1,600 (+10%) | 4mo | $299,900 | $187 | 53 |
| 5125 Spring Creek Rd | 0.66mi | 3/2.0 | 1,604 (+10%) | 7mo | $289,900 | $181 | 47 |
| 818 Great Waters Dr | 0.71mi | 3/2.0 | 1,631 (+12%) | 1mo | $307,000 | $188 | 46 |
Match score weights: distance 35% · size 25% · config 20% · recency 20%. Top-matched comps best support the ARV.
Projected returns pro-forma
-3.0% appreciation · 8.0% rent growth · sell at horizon
- IRR
- -4.9%
- Equity multiple
- 0.81×
- Total profit
- $-16,289
- Equity at exit
- $44,731
- IRR
- 10.1%
- Equity multiple
- 1.97×
- Total profit
- $81,640
- Equity at exit
- $25,939
Cash invested: $84,000 (down + closing). Projections, not guarantees.
Landlord ↔ Tenant lean methodology
- Overall (STATE)
- 87 Strongly Landlord-Friendly
- State Texas
- 87 Strongly Landlord-Friendly · R+5
- County
- — inherits STATE
- City
- — inherits STATE
ZIP-level market 79602
- Home prices YoY
- -19.6%
- Rents YoY
- 33.5%
- Active inventory
- 370
- Price-to-rent
- 8.0×
Monthly cashflow live
- Estimated rent
- $3,120 high interval (Pro) →
- Mortgage (P&I)
- −$1,573
- Tax from tax record
- −$520 /mo · $6,246/yr
- Insurance
- −$125
- HOA
- −$0
- Vacancy / Maint / Mgmt
- −$655
- Net cashflow
- $246
Break-even live
Sensitivity live
| Price | -10% $416 | -5% $331 | +0% $246 | +5% $162 | +10% $77 |
|---|---|---|---|---|---|
| Rent | -10% $0 | -5% $123 | +0% $246 | +5% $370 | +10% $493 |
| Rate | -1.0pp $398 | -0.5pp $323 | base $246 | +0.5pp $169 | +1.0pp $90 |
UW: 25.0% down · 7.5% · 30yr · 1.5% tax · 5.0% vac · 8.0% maint · 8.0% mgmt
Financing live
Cash to close
- Down payment
- $75,000
- Closing costs
- $9,000
- Reserves months
- —
- Total cash needed
- —
Loan-product check · same deal, 3 products live
Conventional
25% down · 7.5% · 30yr
- Down + closing
- —
- Monthly P&I
- —
- Monthly cashflow
- —
- DSCR
- —
- Eligible?
- —
Personal DTI + credit; lowest rate.
DSCR
20% down · 8.5% · 30yr
- Down + closing
- —
- Monthly P&I
- —
- Monthly cashflow
- —
- DSCR
- —
- Eligible?
- —
No personal income docs; deal must DSCR.
Hard money
10% down · 12.0% · 12mo
- Down + closing
- —
- Monthly P&I
- —
- Monthly cashflow
- —
- DSCR
- —
- Eligible?
- —
Short-term bridge; refi at stabilization.
Rent comps 17 comps
| Address | Beds | Baths | Sqft | Rent | $/sqft | DOM | Units | Dist |
|---|---|---|---|---|---|---|---|---|
| 350 Miss Ellie Ln Abilene, TX | 3.0 | 2.0 | 1414 | $2,600 | $1.84 | 3d | 1 | 0.29mi |
| 350 Miss Ellie Ln Abilene, TX | 3.0 | 2.0 | 1414 | $2,600 | $1.84 | 7d | 1 | 0.29mi |
| 349 Whiterock Dr Abilene, TX | 4.0 | 2.0 | 1809 | $6,000 | $3.32 | 18d | 1 | 0.56mi |
| 801 Big Water Trl Abilene, TX | 3.0 | 2.0 | 1537 | $2,800 | $1.82 | 13d | 1 | 0.75mi |
| 7319 Mountain View Rd Abilene, TX | 3.0 | 2.0 | 1502 | $4,000 | $2.66 | 44d | 1 | 0.79mi |
| 7326 Mountain View Rd Unit 7328 Abilene, TX | 3.0 | 2.0 | 1481 | $2,995 | $2.02 | 12d | 1 | 0.81mi |
| 7328 Mountain View Rd Abilene, TX | 3.0 | 2.0 | 1481 | $2,995 | $2.02 | 12d | 1 | 0.82mi |
| 7309 Wildflower Way Abilene, TX | 3.0 | 2.0 | 1578 | $3,195 | $2.02 | 24d | 1 | 0.84mi |
| 331 Sophia Ln Abilene, TX | 3.0 | 2.0 | 1632 | $3,195 | $1.96 | 4d | 1 | 0.88mi |
| 273 Martis Way Abilene, TX | 4.0 | 2.0 | 1660 | $3,200 | $1.93 | 13d | 1 | 0.91mi |
| 7709 Sawdust Trl Abilene, TX | 3.0 | 2.0 | 1502 | $3,200 | $2.13 | 44d | 1 | 1.39mi |
| 7717 Sawdust Trl Abilene, TX | 3.0 | 2.0 | 1502 | $3,375 | $2.25 | 12d | 1 | 1.39mi |
| 7627 Hudson Way Abilene, TX | 4.0 | 2.0 | 1598 | $8,900 | $5.57 | 13d | 1 | 1.41mi |
| 7646 Hudson Way Abilene, TX | 4.0 | 2.0 | 1577 | $3,295 | $2.09 | 21d | 1 | 1.44mi |
| 7625 Wildflower Way Abilene, TX | 4.0 | 3.0 | 1800 | $3,300 | $1.83 | 4d | 1 | 1.45mi |
| 7650 Hudson Way Abilene, TX | 4.0 | 2.0 | 1577 | $3,295 | $2.09 | 13d | 1 | 1.45mi |
| 7949 Sawdust Trl Abilene, TX | 3.0 | 2.0 | 1508 | $2,995 | $1.99 | 44d | 1 | 1.49mi |
Listing history 3 events
-
2026-06-14pricestatusdays on market $300,000 Pending 2 DOM
-
2026-06-13remarks 699-char remark
-
2026-06-13$275,000 Active 1 DOM
ⓘ Source: listings_history table (triggers on properties + properties_extension) + one-shot
backfill from property_details.listing_events for pre-trigger history.
Tax reassessment forecast TX · Resets to sale price
- Current annual tax
- $6,246 · $520/mo
- Projected year-2 tax
- $6,246 · $520/mo
- Expected delta
- $0/yr ($0/mo · 0.0%)
ⓘ Screening estimate from a state-policy table — verify with the county assessor before closing.
Climate risk First Street
- Flood 1/10 Low FEMA zone X (unshaded) · 0% chance over 30 yrs
- Wildfire 8/10 Severe
- Heat 7/10 Severe 7 d/yr ≥103°F today · 25 d/yr by 30 yrs out
- Wind 4/10 Moderate 13% chance of damaging wind over 30 yrs
- Air quality 1/10 Low 0 unhealthy d/yr today · 0 by 30 yrs out
Nearby sold comps map
Loading sold comps map…
Walkable amenities ~0.75 mi
Loading nearby amenities…
Taxation est. · year 1
- Rental income
- $37,446
- − Mortgage interest
- −$16,805
- − Property taxes
- −$6,246
- − Insurance
- −$1,500
- − Repairs & maintenance
- −$2,996
- − Management
- −$2,996
- − Depreciation
- −$8,727
- Taxable loss
- −$1,823
- Est. tax savings @ 24.0%
- +$438
- After-tax cash flow
- $3,395/yr
For passive investors: Depreciation is non-cash, so a rental often shows a tax loss while cash-flowing — sheltering income. Rental losses are passive: they offset passive income freely, and up to $25,000/yr can offset ordinary (W-2) income if you actively participate and your MAGI is under $100k (phasing out to $0 by $150k); unused losses carry forward. On sale, claimed depreciation is recaptured at up to 25%, and gains may owe capital-gains tax (a 1031 exchange can defer both). Figures are a year-1 estimate at your 24.0% rate — not tax advice; consult a CPA.
Schools (NCES district)
- District
- Wylie ISD
- NCES district ID
- 4846500
- Math proficiency
- 63% ▼ -12.00%
- Reading proficiency
- 62% ▼ -4.00%
- Median HH income
- $78,248
- Composite
- 55.86/100
- National rank
- #1206
- State rank
- #32 of 826 in TX
Livability — Abilene
- Score
- 75/100
- State rank
- #142
- US rank
- #4037
Category grades
Schools grade is shown separately in the Schools card above.
Census & demographics
- Census place
- Abilene, TX
- County
- Taylor County · 136,672 people
- City population
- 136,672
- Metro
- Abilene, TX
- Population (ZIP)
- 27,425
- Household income
- $89,551
- Rent vs Own
- Severe rent burden
- 338.0
Population outlook (Taylor County) Hauer SSP2
- Today (2025)
- 145,270 people
- By 2030
- 150,050 · +3.3%
- By 2040
- 159,417 · +9.7%
- By 2050
- 168,883 · +16.3%
- By 2075
- 194,436 · +33.8%
- By 2100
- 203,163 · +39.9%
Race, ethnicity, and origin ACS 2023
- Neighborhood character
- Majority White (64%)
- Race & ethnicity
- White 64% Hispanic / Latino 22% Two or more races 12% Black 10% Asian 2%
- Hispanic origin (detail)
- Mexican 19%
- Common ancestry
- Romanian 2% Italian 2% Portuguese 2%
- Foreign-born
- 6% · Canada, Vietnam, Jamaica
- Languages at home
- 87% English-only · Spanish 9% Other Asian/Pacific 1% French/Haitian/Cajun 1%
Political lean MEDSL · Taylor
- 2024 margin
- Solid R (+49.8) · D 24.6% · R 74.4% · Other 1.0%
- 2008→2024 swing
- -4.2pp toward R · 2008: -45.6pp · 2024: -49.8pp
- All cycles
- 2024: R+49.8 2020: R+45.3 2016: R+51.1 2012: R+53.6 2008: R+45.6
Not yet ingested
- Civics
- —
Market trends
- HPI YoY
- ▼ -46.04%
- Current HPI
- 189.3098
- Rent YoY
- ▲ 33.46%
- Metro
- Abilene, TX
- State GDP YoY
- ▲ 3.95%
- F500 in state
- 110
Industry mix (Fortune 500 HQ in TX)
| Industry | F500 HQs | Revenue |
|---|---|---|
| Energy | 16 | $1,198B |
|
||
| Technology | 5 | $198B |
|
||
| Engineering / Construction | 4 | $72B |
|
||
| Energy Services | 3 | $60B |
|
||
| Utilities | 3 | $41B |
|
||
| Healthcare | 2 | $330B |
|
||
Price history
+100.3% since first listed18 events — show timeline
- 2026-06-10 Listed $275,000 NTREIS
- 2021-07-19 Sold (Public Records) — Public Records
- 2021-07-19 Sold (MLS) — NTREIS
- 2021-06-25 Pending — NTREIS
- 2021-06-18 Contingent — NTREIS
- 2021-06-09 Listed $214,500 NTREIS
- 2018-10-16 Sold (Public Records) — Public Records
- 2018-10-15 Sold (MLS) — NTREIS
- 2018-09-17 Pending — NTREIS
- 2018-09-09 Contingent — NTREIS
- 2018-08-16 Price Changed $179,900 NTREIS
- 2018-08-10 Price Changed $184,900 NTREIS
- 2018-07-31 Listed $189,900 NTREIS
- 2007-01-31 Sold (Public Records) — Public Records
- 2007-01-25 Sold (MLS) — NTREIS
- 2006-10-06 Sold (Public Records) — Public Records
- 2006-09-21 Listed $137,283 NTREIS
- 2006-09-21 Listing Removed — NTREIS
Property tax history
+5.7%/yrLatest (2025): $6,246 · +0.8% YoY. Source: county tax records.
Cash-flow waterfall
monthlySold comps — $/sqft
last 12 mo · ≤1 miLoading sold comps…