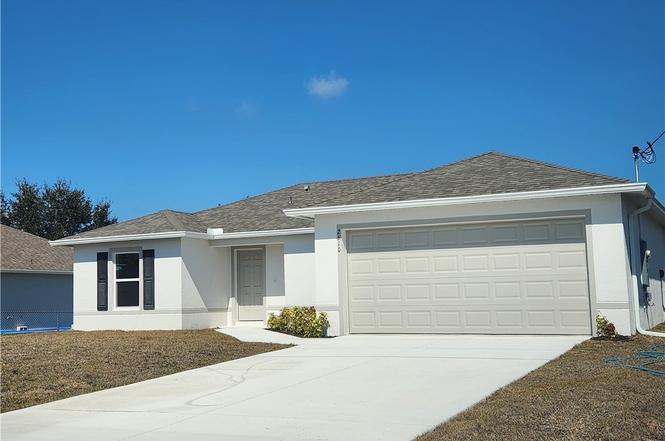
2610 25th St W · Lehigh Acres, FL
Flood risk 1/10 · Minimal
- FEMA flood zone
- X (unshaded)
- Chance of flooding over 30 yrs
- 0.0%
- Est. flood insurance / yr
- $507 – $1,088
Fire risk 2/10 · Minimal
- Est. fire insurance / yr
- $947 – $1,759
Heat risk 10/10 · Severe
- Hot days now (above 107°F)
- 7 days/yr
- Hot days in 30 yrs
- 28 days/yr
Wind risk 10/10 · Severe
- Chance of severe wind over 30 yrs
- 99.0%
Air-quality risk 2/10 · Minimal
- Unhealthy air days now
- 1 days/yr
- Unhealthy air days in 30 yrs
- 1 days/yr
Risk factors via First Street. Map © Google.
Why this score? — see what drove the F grade
The composite is a weighted blend of 9 inputs, each scored 0–100. Each bar is that input's sub-score; the figure is the points it added to the 100-point composite (weight × sub-score).
- Cash flow +8.1/30.0
- ARV discount +7.5/15.0
- Schools +4.1/10.0
- Livability +3.0/5.0
- 1% rule +2.5/10.0
- Condition / age +2.5/5.0
- DSCR +2.1/10.0
- Rent growth +1.3/5.0
- Appreciation +0.0/10.0
$280,000
🖨 Deal sheet 📄 Offer letter ✓ Due diligence
Listing remarks
READY NOW!! MOVE IN READY! Bonus move-in package for a limited time. Includes side-by-side fridge, washer, dryer, garage door opener, and blinds throughout. The SAGO floor plan has three bedrooms, two full bathrooms, a two-car garage, and 1,284 square feet of living space. This home features a split floor plan with two bedrooms on one side of the home and the owner's suite on the other side. The kitchen overlooks the great room and dining area, and has direct access to the garage as well, making it convenient when carrying in those shopping bags. The SAGO comes with one full year of Holiday Builders non-transferable coverage and a 10-year limited structural warranty.
Key facts
- 0.25 acre lot
- 2 garage spots
- Built 2025
Neighborhood map
What this means for you Summary
Snapshot
- This is a 3-bed/2.0-bath land listed at $280k.
Deal economics
- At list price, monthly cash flow is $-273 ($-3k/yr) — negative.
- To cash-flow at today's rent, offer at most $241k (14.1% below list).
- To meet the 1% rule (rent ≥ 1% of price), the offer needs to be $210k (24.8% below list).
- Recommended offer: $210k (24.8% below list) — sets the bar for 1% rule.
Location & tenants
- Location reads 59/100 on livability (#826 in FL) — a working-class tenant base; expect higher turnover. Strengths: cost of living A+, housing A+; Watch: crime C-, employment D+, schools D-.
- Lee (suburban): math 47% / reading 50% proficiency, ranked #42 of 73 in FL (top 58%) — families likely to look elsewhere, expect single-tenant / working-renter base with shorter leases.
- Market conditions: Rents falling (-4.7%/yr); 1335 active listings in the ZIP; 40 comparable units currently listed for rent nearby; rentals at typical pace (median 21d on market — plan ~3-4 weeks tenant-placement turnaround); solid renter incomes; 15,411 units permitted in Lee County in 2024 (4,686 in 5+ unit buildings).
- This rent runs 32% of the median local income ($78k/yr) — at the standard rent-burdened threshold; future hikes will face affordability resistance.
Forward outlook
- Local home prices are declining (-3.0%/yr); year-one equity from $2k of loan paydown is wiped out by about $8k of value loss. Plan a longer hold.
- Lee County population projected at +44% by 2050 — long-run rental-demand tailwind backs the buy-and-hold thesis.
Negotiation context
- It's been on market 223 days — a 12% lower offer ($246k) is reasonable based on typical stale-listing flexibility.
- 2 sale attempts with the ask held roughly flat each time — persistent listings suggest the price (not the market) is what's stuck; bring a comps-based counter.
- Current owner paid $27k; list at $280k implies a 937% gain — meaningful room to come down on a strong offer.
Risks & watch-outs
- Climate carrying-cost: severe wind risk, 99% chance of damaging wind over 30y; extreme-heat days projected 7→28/yr by 2055 (HVAC capex compounding) — expect insurance premiums to compound above CPI over the hold.
Questions for the listing agent
- What do current leases actually rent for vs. the listed asking? Can we see a recent rent roll and the last 12 months of T-12 income?
- It's been on market 223 days. Have you received any prior offers? Is the seller open to a 25% concession, seller financing, or rate buy-down credit?
- Why hasn't it sold? Are there any deal-killer items the seller is aware of (foundation, flood, title, zoning, code violations)?
- Is there a deadline driving the sale (1031 exchange, divorce, estate, relocation)? That informs how much negotiation room exists.
- Schools are D-rated, which usually means shorter tenancies and higher turnover. Who's the typical renter profile here, and what's been the actual vacancy rate?
- The area grade is low — what's the realistic commute time and amenity access for the typical tenant pool here? Any planned neighborhood developments (good or bad) we should know about?
- What's the average days-on-market for RENTAL listings here right now (not sales)? A rising rental-DOM trend means longer vacancies and softer asking-rent achievability than the comps imply.
- What's the recent tenant-quality profile in this submarket — average credit score on applications, eviction rate, late-payment / NSF rate, and stable-employment percentage? A property-management company in the area should have these aggregated.
- How much new for-sale + rental construction is in the pipeline within 1–3 miles? Heavy new supply typically softens prices + rents 12–24 months out; constrained supply supports both.
Investment metrics
- 1% rule
- 0.75% ✗
- Cap rate
- 5.12%
- Cash-on-cash
- -4.17%
- DSCR
- 0.81
- GRM
- 11.1
CMA / ARV
No comps found within radius.
Projected returns pro-forma
-3.0% appreciation · 0.0% rent growth · sell at horizon
- IRR
- -26.7%
- Equity multiple
- 0.12×
- Total profit
- $-68,875
- Equity at exit
- $41,749
- IRR
- -39.0%
- Equity multiple
- -0.35×
- Total profit
- $-106,041
- Equity at exit
- $24,209
Cash invested: $78,400 (down + closing). Projections, not guarantees.
Landlord ↔ Tenant lean methodology
- Overall (STATE)
- 87 Strongly Landlord-Friendly
- State Florida
- 87 Strongly Landlord-Friendly · R+3
- County
- — inherits STATE
- City
- — inherits STATE
ZIP-level market 33971
- Home prices YoY
- -8.0%
- Rents YoY
- -4.7%
- Active inventory
- 1335
- Price-to-rent
- 11.1×
Monthly cashflow live
- Estimated rent
- $2,104 high interval (Pro) →
- Mortgage (P&I)
- −$1,468
- Tax est. 1.5%
- −$350 /mo · $4,200/yr
- Insurance
- −$117
- HOA
- −$0
- Vacancy / Maint / Mgmt
- −$442
- Net cashflow
- $-273
Break-even live
UW: 25.0% down · 7.5% · 30yr · 1.5% tax · 5.0% vac · 8.0% maint · 8.0% mgmt
Financing live
Cash to close
- Down payment
- $70,000
- Closing costs
- $8,400
- Reserves months
- —
- Total cash needed
- —
Loan-product check · same deal, 3 products live
Conventional
25% down · 7.5% · 30yr
- Down + closing
- —
- Monthly P&I
- —
- Monthly cashflow
- —
- DSCR
- —
- Eligible?
- —
Personal DTI + credit; lowest rate.
DSCR
20% down · 8.5% · 30yr
- Down + closing
- —
- Monthly P&I
- —
- Monthly cashflow
- —
- DSCR
- —
- Eligible?
- —
No personal income docs; deal must DSCR.
Hard money
10% down · 12.0% · 12mo
- Down + closing
- —
- Monthly P&I
- —
- Monthly cashflow
- —
- DSCR
- —
- Eligible?
- —
Short-term bridge; refi at stabilization.
Rent comps 40 comps
| Address | Beds | Baths | Sqft | Rent | $/sqft | DOM | Units | Dist |
|---|---|---|---|---|---|---|---|---|
| 2608 25th St W Lehigh Acres, FL | 3.0 | 2.0 | 1633 | $2,300 | $1.41 | 23d | 1 | 0.01mi |
| 2513 22nd St W Lehigh Acres, FL | 4.0 | 2.0 | 1389 | $1,750 | $1.26 | 21d | 1 | 0.26mi |
| 2513 22nd St W Lehigh Acres, FL | 4.0 | 2.0 | 1389 | $1,750 | $1.26 | 14d | 1 | 0.26mi |
| 2815 24th St W Lehigh Acres, FL | 4.0 | 2.0 | 1820 | $1,875 | $1.03 | 3d | 1 | 0.38mi |
| 2615 19th St W Lehigh Acres, FL | 3.0 | 2.0 | 1698 | $2,000 | $1.18 | 23d | 1 | 0.43mi |
| 3315 Sunshine Blvd N Lehigh Acres, FL | 3.0 | 2.0 | 1630 | $2,000 | $1.23 | 3d | 1 | 0.48mi |
| 2917 22nd St W Lehigh Acres, FL | 4.0 | 2.0 | 1550 | $2,150 | $1.39 | 23d | 1 | 0.59mi |
| 2611 Carol Pl Lehigh Acres, FL | 3.0 | 2.0 | 1406 | $1,895 | $1.35 | 10d | 1 | 0.60mi |
| 2614 Carol Pl Lehigh Acres, FL | 3.0 | 2.0 | 1595 | $1,695 | $1.06 | 16d | 1 | 0.64mi |
| 3175 Sunshine Blvd Lehigh Acres, FL | 3.0 | 2.0 | 1633 | $2,100 | $1.29 | 2d | 1 | 0.65mi |
| 3405 Hanna Ave N Lehigh Acres, FL | 4.0 | 3.0 | 1698 | $2,200 | $1.30 | 23d | 1 | 0.65mi |
| 2522 Alice Pl Lehigh Acres, FL | 3.0 | 2.0 | 1630 | $2,300 | $1.41 | 3d | 1 | 0.67mi |
| 3005 31st St W Lehigh Acres, FL | 3.0 | 2.0 | 1600 | $1,950 | $1.22 | 2d | 1 | 0.69mi |
| 3016 25th St W Lehigh Acres, FL | 3.0 | 2.0 | 1100 | $1,555 | $1.41 | 23d | 1 | 0.70mi |
| 2809 Darlene Pl Lehigh Acres, FL | 3.0 | 2.0 | 1600 | $2,000 | $1.25 | 23d | 1 | 0.77mi |
| 1711 W 12th St Lehigh Acres, FL | 3.0 | 2.0 | 1400 | $1,999 | $1.43 | 19d | 1 | 0.77mi |
| 1711 W 12th St Lehigh Acres, FL | 3.0 | 2.0 | 1400 | $1,999 | $1.43 | 19d | 1 | 0.77mi |
| 2918 16th St Lehigh Acres, FL | 3.0 | 2.0 | 1324 | $1,845 | $1.39 | 21d | 1 | 0.81mi |
| 3208 31st St W Lehigh Acres, FL | 3.0 | 2.0 | 1501 | $2,100 | $1.40 | 23d | 1 | 0.90mi |
| 2913 14th St W Lehigh Acres, FL | 3.0 | 2.0 | 1629 | $2,400 | $1.47 | 2d | 1 | 0.91mi |
| 2913 14th St W Lehigh Acres, FL | 4.0 | 2.0 | 1629 | $2,300 | $1.41 | 23d | 1 | 0.91mi |
| 1407 W 10th St Lehigh Acres, FL | 3.0 | 2.0 | 1407 | $1,700 | $1.21 | 23d | 1 | 0.94mi |
| 2610 40th St W Lehigh Acres, FL | 3.0 | 2.0 | 1472 | $2,000 | $1.36 | 23d | 1 | 0.99mi |
| 1418 W 12th St Lehigh Acres, FL | 2.0 | 2.0 | 1113 | $1,295 | $1.16 | 21d | 1 | 1.00mi |
| 3203 18th St W Lehigh Acres, FL | 3.0 | 2.5 | 1710 | $2,250 | $1.32 | 23d | 1 | 1.01mi |
| 8187 Gopher Tortoise Trl Lehigh Acres, FL | 3.0 | 2.0 | 1555 | $2,000 | $1.29 | 23d | 1 | 1.03mi |
| 2719 42nd St W Lehigh Acres, FL | 3.0 | 2.0 | 1637 | $2,000 | $1.22 | 14d | 1 | 1.10mi |
| 3005 40th St W Lehigh Acres, FL | 3.0 | 2.0 | 1272 | $2,000 | $1.57 | 3d | 1 | 1.15mi |
| 2612 7th St W Lehigh Acres, FL | 3.0 | 2.0 | 1492 | $2,295 | $1.54 | 23d | 1 | 1.15mi |
| 8350 Tortoise Isle Ct Lehigh Acres, FL | 3.0 | 2.0 | 1478 | $1,595 | $1.08 | 3d | 1 | 1.16mi |
| 2916 9th St W Lehigh Acres, FL | 3.0 | 2.0 | 1053 | $1,750 | $1.66 | 23d | 1 | 1.16mi |
| 3005 41st St W Lehigh Acres, FL | 3.0 | 2.0 | 1853 | $2,250 | $1.21 | 23d | 1 | 1.20mi |
| 3202 37th St W Lehigh Acres, FL | 3.0 | 2.5 | 1412 | $1,705 | $1.21 | 14d | 1 | 1.21mi |
| 8046 Gopher Tortoise Trl Lehigh Acres, FL | 4.0 | 2.0 | 1828 | $2,300 | $1.26 | 23d | 1 | 1.22mi |
| 2902 7th St W Lehigh Acres, FL | 3.0 | 2.0 | 1841 | $2,215 | $1.20 | 14d | 1 | 1.23mi |
| 2902 7th St W Lehigh Acres, FL | 3.0 | 2.0 | 1841 | $2,085 | $1.13 | 2d | 1 | 1.23mi |
| 1103 W 10th St Lehigh Acres, FL | 3.0 | 2.0 | 1600 | $2,000 | $1.25 | 3d | 1 | 1.24mi |
| 1113-1115 W 12th St Lehigh Acres, FL | 3.0 | 2.0 | 1600 | $1,800 | $1.12 | 23d | 1 | 1.25mi |
| 2808 44th St W Lehigh Acres, FL | 4.0 | 2.0 | 1800 | $1,745 | $0.97 | 23d | 1 | 1.27mi |
| 3109 10th St W Lehigh Acres, FL | 3.0 | 2.0 | 1472 | $1,950 | $1.32 | 23d | 1 | 1.29mi |
Listing history 7 events
-
2026-04-22status Pending
-
2026-01-26status Active
-
2026-01-03status Pending
-
2025-09-29price $280,000
-
2025-08-19$290,000 Active
-
2024-08-23soldstatus $27,000
-
2024-07-29soldstatus $22,000
ⓘ Source: listings_history table (triggers on properties + properties_extension) + one-shot
backfill from property_details.listing_events for pre-trigger history.
Climate risk First Street
- Flood 1/10 Low FEMA zone X (unshaded) · 0% chance over 30 yrs
- Wildfire 2/10 Low
- Heat 10/10 Extreme 7 d/yr ≥107°F today · 28 d/yr by 30 yrs out
- Wind 10/10 Extreme 99% chance of damaging wind over 30 yrs
- Air quality 2/10 Low 1 unhealthy d/yr today · 1 by 30 yrs out
Nearby sold comps map
Loading sold comps map…
Walkable amenities ~0.75 mi
Loading nearby amenities…
Taxation est. · year 1
- Rental income
- $25,251
- − Mortgage interest
- −$15,684
- − Property taxes
- −$4,200
- − Insurance
- −$1,400
- − Repairs & maintenance
- −$2,020
- − Management
- −$2,020
- − Depreciation
- −$8,145
- Taxable loss
- −$8,219
- Est. tax savings @ 24.0%
- +$1,973
- After-tax cash flow
- $-1,300/yr
For passive investors: Depreciation is non-cash, so a rental often shows a tax loss while cash-flowing — sheltering income. Rental losses are passive: they offset passive income freely, and up to $25,000/yr can offset ordinary (W-2) income if you actively participate and your MAGI is under $100k (phasing out to $0 by $150k); unused losses carry forward. On sale, claimed depreciation is recaptured at up to 25%, and gains may owe capital-gains tax (a 1031 exchange can defer both). Figures are a year-1 estimate at your 24.0% rate — not tax advice; consult a CPA.
Schools (NCES district)
- District
- Lee
- NCES district ID
- 1201080
- Math proficiency
- 47% ▼ -11.00%
- Reading proficiency
- 50% ▼ -4.00%
- Median HH income
- $49,518
- Composite
- 41.49/100
- National rank
- #3458
- State rank
- #42 of 73 in FL
Livability — Lehigh Acres
- Score
- 59/100
- State rank
- #826
- US rank
- #20055
Category grades
Schools grade is shown separately in the Schools card above.
Census & demographics
- Census place
- Lehigh Acres, FL
- County
- Lee County · 788,662 people
- City population
- 130,638
- Metro
- Cape Coral-Fort Myers, FL
- Population (ZIP)
- 30,790
- Household income
- $77,723
- Rent vs Own
- Severe rent burden
- 587.0
Population outlook (Lee County) Hauer SSP2
- Today (2025)
- 871,946 people
- By 2030
- 955,468 · +9.6%
- By 2040
- 1,113,587 · +27.7%
- By 2050
- 1,256,891 · +44.1%
- By 2075
- 1,560,270 · +78.9%
- By 2100
- 1,726,848 · +98.0%
Race, ethnicity, and origin ACS 2023
- Neighborhood character
- Diverse neighborhood (Simpson 0.65)
- Race & ethnicity
- Hispanic / Latino 49% Two or more races 32% White 26% Black 19% Asian 2%
- Hispanic origin (detail)
- Mexican 9% Puerto Rican 13% Cuban 14% Dominican 2%
- Common ancestry
- Hispanic 7% Estonian 1% Romanian 1%
- Foreign-born
- 31% · Canada, Vietnam, Guatemala
- Languages at home
- 46% English-only · Spanish 41% French/Haitian/Cajun 9% Other Indo-European 2%
Political lean MEDSL · Lee
- 2024 margin
- Strong R (+28.4) · D 35.5% · R 63.9%
- 2008→2024 swing
- -18.0pp toward R · 2008: -10.4pp · 2024: -28.4pp
- All cycles
- 2024: R+28.4 2020: R+19.2 2016: R+20.4 2012: R+16.6 2008: R+10.4
Not yet ingested
- Civics
- —
Market trends
- HPI YoY
- ▼ -27.68%
- Current HPI
- 317.7147
- Rent YoY
- ▼ -4.69%
- Metro
- Cape Coral-Fort Myers, FL
- State GDP YoY
- ▲ 3.28%
- F500 in state
- 36
Industry mix (Fortune 500 HQ in FL)
| Industry | F500 HQs | Revenue |
|---|---|---|
| Industrial Technology | 2 | $29B |
|
||
| Insurance | 2 | $17B |
|
||
| Retail | 1 | $60B |
|
||
| Technology Distribution | 1 | $58B |
|
||
| Homebuilding | 1 | $35B |
|
||
| Technology Manufacturing | 1 | $35B |
|
||
Price history
+1172.7% since first listed7 events — show timeline
- 2026-04-22 Pending — FORTMLS
- 2026-01-26 Relisted — FORTMLS
- 2026-01-03 Pending — FORTMLS
- 2025-09-29 Price Changed $280,000 FORTMLS
- 2025-08-19 Listed $290,000 FORTMLS
- 2024-08-23 Sold (Public Records) $27,000 Public Records
- 2024-07-29 Sold (Public Records) $22,000 Public Records
Property tax history
+20.9%/yrLatest (2025): $501 · +35.8% YoY. Source: county tax records.
Cash-flow waterfall
monthlySold comps — $/sqft
last 12 mo · ≤1 miLoading sold comps…