None · Ashtabula, OH
Flood risk 1/10 · Minimal
- FEMA flood zone
- X (unshaded)
- Chance of flooding over 30 yrs
- 0.0%
- Est. flood insurance / yr
- $473 – $860
Fire risk 1/10 · Minimal
- Est. fire insurance / yr
- $713 – $1,323
Heat risk 3/10 · Minor
- Hot days now (above 94°F)
- 7 days/yr
- Hot days in 30 yrs
- 18 days/yr
Wind risk 1/10 · Minimal
- Chance of severe wind over 30 yrs
- —
Air-quality risk 3/10 · Minor
- Unhealthy air days now
- 2 days/yr
- Unhealthy air days in 30 yrs
- 5 days/yr
Risk factors via First Street. Map © Google.
Why this score? — see what drove the B- grade
The composite is a weighted blend of 9 inputs, each scored 0–100. Each bar is that input's sub-score; the figure is the points it added to the 100-point composite (weight × sub-score).
- Cash flow +30.0/30.0
- 1% rule +10.0/10.0
- DSCR +10.0/10.0
- ARV discount +7.5/15.0
- Livability +3.6/5.0
- Rent growth +2.5/5.0
- Condition / age +2.5/5.0
- Schools +2.4/10.0
- Appreciation +0.0/10.0
$60,000
🖨 Deal sheet (PDF) 📄 Offer letter ✓ Due diligence
Listing remarks
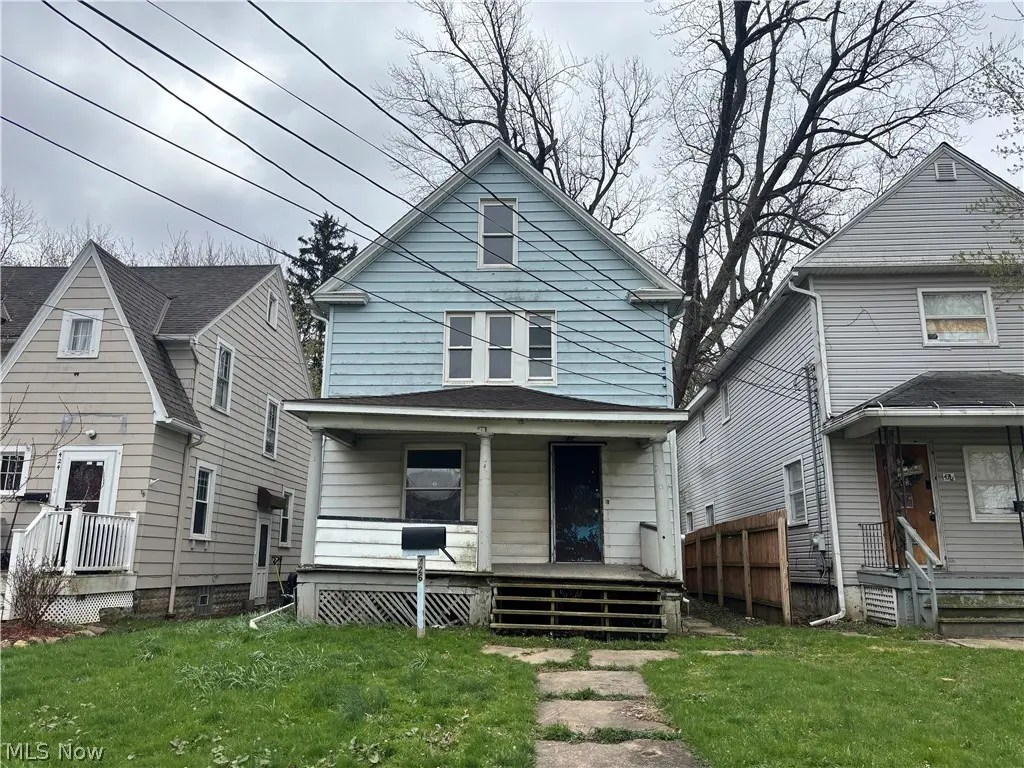
Investor Opportunity, located in Ashtabula County! This property offers strong earning potential. featuring a layout of 3 bedrooms and 1.5 bath, full unfinished basement. Newer furnace and hot water tank. Shed included. alley access and private driveway. If you're searching for your next project, look no further! Property is being sold As-Is. Bring your vision and unlock this homes full potential.
Key facts
- Alley access
- Private driveway
- 3,484 sq ft lot
Tags
Property features AI
Exterior
- Parking: No garage; Unpaved parking
- Utilities: Public water; Public sewer
- Home design: Two-story home
- Construction: Aluminum siding; Asphalt/fiberglass roof
- Exterior features: Yard with shed(s); Lot dimensions approximately 31 x 115; North-facing
Interior
- Bedrooms: 7 total rooms (bedrooms and living spaces included)
- Bathrooms: 1 full bathroom; 1 half bathroom; 1 main-level bathroom
- Heating & cooling: Forced-air gas heating; Central air conditioning
- Interior features: Unfinished basement; Has view
Neighborhood map
What this means for you Summary
Snapshot
- This is a 3-bed/1.0-bath single-family listed at $60k.
Deal economics
- At list price, monthly cash flow is $741 ($9k/yr) — positive.
- The deal already cash-flows at list — no discount required.
- Meets the 1% rule at list price ($1k rent vs $60k).
- Recommended offer: $58k (3.0% below list) — sets the bar for market timing.
- Cap rate 21.1% vs local median 8.2% in Ashtabula — top-decile yield for the area; either an underpriced asset or a hidden risk that comps aren't pricing in. Stress-test before assuming the spread holds.
Location & tenants
- Location reads 71/100 on livability (#420 in OH) — a middle-class / working-renter tenant base. Strengths: cost of living A+, health & safety A+, housing A; Watch: amenities F, commute F, employment F.
- Ashtabula Area City (town): math 24% / reading 35% proficiency, ranked #588 of 656 in OH (top 90%) — low school quality limits family demand, transient renter base, plan for 1-2y turnover; 63% free/reduced lunch — lower-income household profile, screen leases tightly.
- Zoned schools: Superior Intermediate School (math 30% / reading 31%, grade F, #1,151 of 1,584 statewide, top 73%, 436 students, 0% FRL); Lakeside Junior High School (math 24% / reading 34%, grade F, #579 of 654 statewide, top 89%, 505 students, 0% FRL); Lakeside High School (math 12% / reading 37%, grade F, #644 of 781 statewide, top 85%, 894 students, 0% FRL) — zoned schools average 0% FRL vs 63% district-wide (63 pts lower); this property's tenant base skews higher-income than the district average.
- Market conditions: 169 active listings in the ZIP; 155 units permitted in Ashtabula County in 2024 (0 in 5+ unit buildings).
- This rent runs 35% of the median local income ($50k/yr) — at the standard rent-burdened threshold; future hikes will face affordability resistance.
Forward outlook
- Local home prices are declining (-3.0%/yr); year-one equity from $415 of loan paydown is wiped out by about $2k of value loss. Plan a longer hold.
- Ashtabula County population projected at -22% by 2050 — secular population decline; favor cash flow + early exit over multi-decade hold.
- At projected returns (-3.0% appreciation + 3.0% rent growth), your $17k cash investment doubles in ~3 years — after that, you're playing with house money.
Negotiation context
- It's been on market 36 days — a 3% lower offer ($58k) is reasonable based on typical stale-listing flexibility.
- 2 sale attempts since 3y ago with the ask held roughly flat each time — persistent listings suggest the price (not the market) is what's stuck; bring a comps-based counter.
Risks & watch-outs
- Watch-outs: built in 1925 — expect roof / HVAC / electrical / plumbing capex.
Questions for the listing agent
- It's been on market 36 days. Have you received any prior offers? Is the seller open to a 3% concession, seller financing, or rate buy-down credit?
- Built in 1925 — when were the roof, HVAC, electrical panel, plumbing, and water heater last replaced?
- Is there a deadline driving the sale (1031 exchange, divorce, estate, relocation)? That informs how much negotiation room exists.
- What's the average days-on-market for RENTAL listings here right now (not sales)? A rising rental-DOM trend means longer vacancies and softer asking-rent achievability than the comps imply.
- What's the recent tenant-quality profile in this submarket — average credit score on applications, eviction rate, late-payment / NSF rate, and stable-employment percentage? A property-management company in the area should have these aggregated.
- How much new for-sale + rental construction is in the pipeline within 1–3 miles? Heavy new supply typically softens prices + rents 12–24 months out; constrained supply supports both.
Investment metrics
- 1% rule
- 2.40% ✓
- Cap rate
- 21.10%
- Cash-on-cash
- 52.90%
- DSCR
- 3.35
- GRM
- 3.5
CMA / ARV
- ARV (on-the-fly)
- $138,012
- Comps found
- 12
Show comp detail 12 sales within ~0.75 mi
| Address | Dist | Beds/Ba | Sqft | Sold | Price | $/sf | Match |
|---|---|---|---|---|---|---|---|
| 5725 Main Ave | 0.04mi | 3/1.0 | 1,572 (+6%) | 1mo | $30,000 | $19 | 88 |
| 5508 Adams Ave | 0.22mi | 3/1.5 | 1,396 (-6%) | 8mo | $144,000 | $103 | 71 |
| 6208 Jefferson Rd | 0.53mi | 3/1.5 | 1,510 (+2%) | 2mo | $140,000 | $93 | 69 |
| 5705 Poplar | 0.39mi | 3/1.0 | 1,326 (-11%) | 1mo | $45,000 | $34 | 63 |
| 637 Wamar Ln | 0.58mi | 3/1.5 | 1,424 (-4%) | 8mo | $210,000 | $147 | 57 |
| 112 Grove Dr | 0.16mi | 2/1.5 (-1) | 1,264 (-15%) | 5mo | $140,000 | $111 | 56 |
| 6226 Edward Ave | 0.72mi | 3/2.5 | 1,506 (+2%) | 6mo | $170,000 | $113 | 53 |
| 1022 W 51st St | 0.58mi | 4/1.0 (+1) | 1,584 (+7%) | 9mo | $146,000 | $92 | 49 |
| 6235 Jefferson Rd | 0.59mi | 3/1.5 | 1,264 (-15%) | 7mo | $78,500 | $62 | 40 |
| 1629 E 47th St | 0.74mi | 4/2.0 (+1) | 1,312 (-12%) | 3mo | $141,000 | $107 | 35 |
| 4322 Coleman Ave | 0.73mi | 3/1.5 | 1,296 (-13%) | 11mo | $105,000 | $81 | 34 |
| 1247 W 58th St | 0.70mi | 4/2.0 (+1) | 1,632 (+10%) | 12mo | $120,000 | $74 | 32 |
Match score weights: distance 35% · size 25% · config 20% · recency 20%. Top-matched comps best support the ARV.
Projected returns pro-forma
-3.0% appreciation · 3.0% rent growth · sell at horizon
- IRR
- 50.9%
- Equity multiple
- 3.23×
- Total profit
- $37,457
- Equity at exit
- $8,946
- IRR
- 56.3%
- Equity multiple
- 6.56×
- Total profit
- $93,402
- Equity at exit
- $5,188
Cash invested: $16,800 (down + closing). Projections, not guarantees.
Landlord ↔ Tenant lean methodology
- Overall (STATE)
- 73 Landlord-Friendly
- State Ohio
- 73 Landlord-Friendly · R+6
- County
- — inherits STATE
- City
- — inherits STATE
ZIP-level market 44004
- Home prices YoY
- -30.5%
- Active inventory
- 169
- Price-to-rent
- 3.5×
Monthly cashflow live
- Estimated rent
- $1,443 medium interval (Pro) →
- Mortgage (P&I)
- −$315
- Tax from tax record
- −$60 /mo · $717/yr
- Insurance
- −$25
- HOA
- −$0
- Vacancy / Maint / Mgmt
- −$303
- Net cashflow
- $741
Break-even live
Sensitivity live
| Price | -10% $775 | -5% $758 | +0% $741 | +5% $724 | +10% $707 |
|---|---|---|---|---|---|
| Rent | -10% $627 | -5% $684 | +0% $741 | +5% $798 | +10% $855 |
| Rate | -1.0pp $771 | -0.5pp $756 | base $741 | +0.5pp $725 | +1.0pp $709 |
UW: 25.0% down · 7.5% · 30yr · 1.5% tax · 5.0% vac · 8.0% maint · 8.0% mgmt
Financing live
Cash to close
- Down payment
- $15,000
- Closing costs
- $1,800
- Reserves months
- —
- Total cash needed
- —
Loan-product check · same deal, 3 products live
Conventional
25% down · 7.5% · 30yr
- Down + closing
- —
- Monthly P&I
- —
- Monthly cashflow
- —
- DSCR
- —
- Eligible?
- —
Personal DTI + credit; lowest rate.
DSCR
20% down · 8.5% · 30yr
- Down + closing
- —
- Monthly P&I
- —
- Monthly cashflow
- —
- DSCR
- —
- Eligible?
- —
No personal income docs; deal must DSCR.
Hard money
10% down · 12.0% · 12mo
- Down + closing
- —
- Monthly P&I
- —
- Monthly cashflow
- —
- DSCR
- —
- Eligible?
- —
Short-term bridge; refi at stabilization.
Listing history 21 events
-
2026-06-21days on market $60,000 Active 36 DOM
-
2026-06-21days on market $60,000 Active 35 DOM
-
2026-06-18days on market $60,000 Active 33 DOM
-
2026-06-17days on market $60,000 Active 32 DOM
-
2026-06-16days on market $60,000 Active 31 DOM
-
2026-06-15days on market $60,000 Active 30 DOM
-
2026-06-13days on market $60,000 Active 28 DOM
-
2026-06-12days on market $60,000 Active 27 DOM
-
2026-06-09days on market $60,000 Active 24 DOM
-
2026-06-08days on market $60,000 Active 23 DOM
-
2026-06-07days on market $60,000 Active 22 DOM
-
2026-06-07days on market $60,000 Active 21 DOM
-
2026-06-04days on market $60,000 Active 18 DOM
-
2026-06-02days on market $60,000 Active 17 DOM
-
2026-06-01days on market $60,000 Active 16 DOM
-
2026-05-31days on market $60,000 Active 15 DOM
-
2026-05-11$60,000 Active
-
2023-06-16soldstatus $260,450
-
2023-03-27status Pending
-
2023-03-23historical
-
2023-03-03$65,000 Active
ⓘ Source: listings_history table (triggers on properties + properties_extension) + one-shot
backfill from property_details.listing_events for pre-trigger history.
Tax reassessment forecast OH · Partial reset (capped growth)
- Current annual tax
- $717 · $60/mo
- Projected year-2 tax
- $826 · $69/mo
- Expected delta
- +$110/yr (+$9/mo · 15.3%)
ⓘ Screening estimate from a state-policy table — verify with the county assessor before closing.
Climate risk First Street
- Flood 1/10 Low FEMA zone X (unshaded) · 0% chance over 30 yrs
- Wildfire 1/10 Low
- Heat 3/10 Moderate 7 d/yr ≥94°F today · 18 d/yr by 30 yrs out
- Wind 1/10 Low
- Air quality 3/10 Moderate 2 unhealthy d/yr today · 5 by 30 yrs out
Nearby sold comps map
Loading sold comps map…
Walkable amenities ~0.75 mi
Loading nearby amenities…
Taxation est. · year 1
- Rental income
- $17,316
- − Mortgage interest
- −$3,361
- − Property taxes
- −$717
- − Insurance
- −$300
- − Repairs & maintenance
- −$1,385
- − Management
- −$1,385
- − Depreciation
- −$1,745
- Taxable income
- $8,422
- Est. tax owed @ 24.0%
- −$2,021
- After-tax cash flow
- $6,865/yr
For passive investors: Depreciation is non-cash, so a rental often shows a tax loss while cash-flowing — sheltering income. Rental losses are passive: they offset passive income freely, and up to $25,000/yr can offset ordinary (W-2) income if you actively participate and your MAGI is under $100k (phasing out to $0 by $150k); unused losses carry forward. On sale, claimed depreciation is recaptured at up to 25%, and gains may owe capital-gains tax (a 1031 exchange can defer both). Figures are a year-1 estimate at your 24.0% rate — not tax advice; consult a CPA.
Schools (NCES district)
- District
- Ashtabula Area City
- NCES district ID
- 3904351
- Math proficiency
- 24% ▼ -27.00%
- Reading proficiency
- 35% ▼ -13.00%
- Median HH income
- $34,812
- Composite
- 24.3/100
- National rank
- #7712
- State rank
- #588 of 656 in OH
Livability — Ashtabula
- Score
- 71/100
- State rank
- #420
- US rank
- #6883
Category grades
Schools grade is shown separately in the Schools card above.
Census & demographics
- Census place
- Ashtabula, OH
- County
- Ashtabula · 97,617 people
- City population
- 31,076
- Metro
- Cleveland, OH
- Population (ZIP)
- 31,076
- Household income
- $49,507
- Rent vs Own
- Severe rent burden
- 14.1
Population outlook (Ashtabula County) Hauer SSP2
- Today (2025)
- 92,950 people
- By 2030
- 89,146 · -4.1%
- By 2040
- 80,715 · -13.2%
- By 2050
- 72,270 · -22.2%
- By 2075
- 55,780 · -40.0%
- By 2100
- 40,928 · -56.0%
Race, ethnicity, and origin ACS 2023
- Neighborhood character
- Predominantly White (79%)
- Race & ethnicity
- White 79% Hispanic / Latino 9% Two or more races 7% Black 6%
- Hispanic origin (detail)
- Mexican 3% Puerto Rican 5%
- Common ancestry
- Romanian 4% Iranian 2% Slovak 1%
- Foreign-born
- 3% · Canada
- Languages at home
- 94% English-only · Spanish 4%
Political lean MEDSL · Ashtabula
- 2024 margin
- Strong R (+28.4) · D 35.4% · R 63.8%
- 2008→2024 swing
- -41.9pp toward R · 2008: 13.5pp · 2024: -28.4pp
- All cycles
- 2024: R+28.4 2020: R+23.5 2016: R+19.0 2012: D+12.1 2008: D+13.5
Not yet ingested
- Civics
- —
Market trends
- HPI YoY
- ▼ -114.51%
- Current HPI
- 260.7146
- Rent YoY
- —
- Metro
- —
- State GDP YoY
- ▲ 1.98%
- F500 in state
- 48
Industry mix (Fortune 500 HQ in OH)
| Industry | F500 HQs | Revenue |
|---|---|---|
| Insurance | 3 | $145B |
|
||
| Industrial Machinery | 3 | $49B |
|
||
| Financial Services | 3 | $24B |
|
||
| Consumer Goods | 2 | $93B |
|
||
| Aerospace / Defense | 2 | $47B |
|
||
| Utilities | 2 | $33B |
|
||
Price history
-7.7% since first listed5 events — show timeline
- 2026-05-11 Listed $60,000 MLSNOW
- 2023-06-16 Sold (Public Records) $260,450 Public Records
- 2023-03-27 Pending — MLSNOW
- 2023-03-23 Listing Removed — MLSNOW
- 2023-03-03 Listed $65,000 MLSNOW
Property tax history
+14.7%/yrLatest (2025): $717 · +1.2% YoY. Source: county tax records.
Cash-flow waterfall
monthlySold comps — $/sqft
last 12 mo · ≤1 miLoading sold comps…