 Triplex
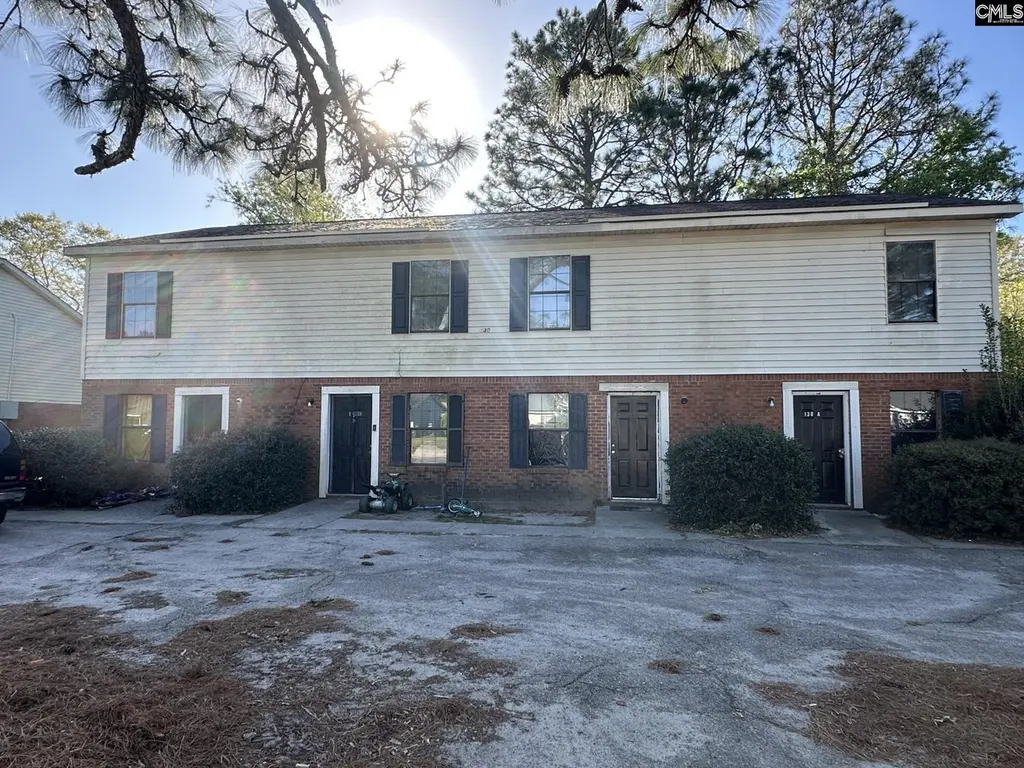
130 Villa Ct · Cayce, SC
Flood risk 1/10 · Minimal
- FEMA flood zone
- X (unshaded)
- Chance of flooding over 30 yrs
- 0.0%
- Est. flood insurance / yr
- $507 – $1,088
Fire risk 4/10 · Minor
- Est. fire insurance / yr
- $783 – $1,453
Heat risk 7/10 · Major
- Hot days now (above 108°F)
- 7 days/yr
- Hot days in 30 yrs
- 16 days/yr
Wind risk 6/10 · Moderate
- Chance of severe wind over 30 yrs
- 67.0%
Air-quality risk 3/10 · Minor
- Unhealthy air days now
- 2 days/yr
- Unhealthy air days in 30 yrs
- 2 days/yr
Risk factors via First Street. Map © Google.
Why this score? — see what drove the B+ grade
The composite is a weighted blend of 9 inputs, each scored 0–100. Each bar is that input's sub-score; the figure is the points it added to the 100-point composite (weight × sub-score).
- Cash flow +30.0/30.0
- ARV discount +15.0/15.0
- 1% rule +10.0/10.0
- DSCR +10.0/10.0
- Schools +4.2/10.0
- Rent growth +3.6/5.0
- Livability +3.6/5.0
- Condition / age +2.5/5.0
- Appreciation +0.0/10.0
$295,000
🖨 Deal sheet (PDF) 📄 Offer letter ✓ Due diligence
Multi-family units
County records classify this as Multi-Family (2-4 Unit). Listing-text estimate: 3 units. confirmed
Listing remarks
Great Investment Opportunity!!! Units are fully leased. Roof 2026. HVAC less than 10 years old. Excellent location with convenience to major highways, airport, shopping, restaurants, etc. Zoned for Lexington District 1 schools. Property being sold AS-IS. There are 3 additional buildings for sale to further elevate this investment opportunity. Disclaimer: CMLS has not reviewed and, therefore, does not endorse vendors who may appear in listings.
Key facts
- Fully leased
- Excellent location
- 0.25 acre lot
Tags
Property features AI
Finance
- Other: Pest control paid by tenants
- Financial info: Each of the four units currently listed with rent of $695 per unit
Exterior
- Parking: Assigned parking with 8 spaces
- Utilities: Public sewer; Gas paid by tenants; Electricity paid by tenants; Sewer paid by tenants; Trash service paid by tenants; Cable paid by tenants; Water service owned (owner listed as water) — public water source
- Home design: Two-story multifamily building; Total of 4 residential units
- Construction: Slab foundation
- Exterior features: Partial brick above foundation with vinyl siding; Lawn maintenance handled by tenants; Paved road access; Public water
Interior
- Bedrooms: Four units each with 2 bedrooms
- Bathrooms: Each unit has 1 full bathroom and 1 half bathroom (four full baths total across the building)
- Heating & cooling: Central heating; Central air conditioning; Heating paid by tenants
- Interior features: Total heated area approximately 4,026 square feet
Neighborhood map
What this means for you Summary
Snapshot
- This is a 3 × 3-bed/1.33-bath units multifamily listed at $295k.
Deal economics
- At list price, monthly cash flow is $2k ($22k/yr) — positive. Per door: $603/mo.
- The deal already cash-flows at list — no discount required.
- Meets the 1% rule at list price ($5k rent vs $295k).
- Recommended offer: $291k (1.5% below list) — sets the bar for market timing.
Location & tenants
- Location reads 71/100 on livability (#55 in SC) — a middle-class / working-renter tenant base. Strengths: cost of living A+, housing A+, health & safety A+; Watch: employment D+, crime F, commute F.
- Lexington 01 (suburban): math 42% / reading 53% proficiency, ranked #11 of 80 in SC (top 14%) — families likely to look elsewhere, expect single-tenant / working-renter base with shorter leases.
- Zoned schools: White Knoll Elementary (math 32% / reading 36%, grade F, #359 of 597 statewide, top 60%, 673 students, 41% FRL); White Knoll High (math 47% / reading 85%, grade B, #81 of 196 statewide, top 42%, 2,204 students, 45% FRL).
- Market conditions: Rents rising fast (+4.6%/yr); 187 active listings in the ZIP; 1,712 units permitted in Lexington County in 2024 (0 in 5+ unit buildings).
- At $4,954/mo this rent would consume 79% of the median local household income ($75k/yr) (locally 147% of renters already pay >50% of income on rent) — very limited rent-growth headroom before tenants either downsize or default.
Forward outlook
- Local home prices are declining (-3.0%/yr); year-one equity from $2k of loan paydown is wiped out by about $9k of value loss. Plan a longer hold.
- Lexington County population projected at +26% by 2050 — long-run rental-demand tailwind backs the buy-and-hold thesis.
- At projected returns (-3.0% appreciation + 4.6% rent growth), your $83k cash investment doubles in ~5 years — after that, you're playing with house money.
Negotiation context
- It's been on market 15 days — a 2% lower offer ($291k) is reasonable based on typical stale-listing flexibility.
- Current owner paid $121k; list at $295k implies a 144% gain — meaningful room to come down on a strong offer.
Risks & watch-outs
- Climate carrying-cost: major wind risk, 67% chance of damaging wind over 30y; extreme-heat days projected 7→16/yr by 2055 (HVAC capex compounding) — expect insurance premiums to compound above CPI over the hold.
Questions for the listing agent
- Can we see the unit-by-unit rent roll, current vacancy, and any below-market leases? What's the average tenancy length?
- What capital expenditures (roof, boiler, parking lot, exteriors) have been made in the last 5 years, and what's planned in the next 2?
- Is there a deadline driving the sale (1031 exchange, divorce, estate, relocation)? That informs how much negotiation room exists.
- Schools are D-rated, which usually means shorter tenancies and higher turnover. Who's the typical renter profile here, and what's been the actual vacancy rate?
- Crime grade is F in this area — have there been break-ins, vandalism, or insurance claims at this property in the last 3 years? What carrier currently insures it and at what premium?
- What's the average days-on-market for RENTAL listings here right now (not sales)? A rising rental-DOM trend means longer vacancies and softer asking-rent achievability than the comps imply.
- What's the recent tenant-quality profile in this submarket — average credit score on applications, eviction rate, late-payment / NSF rate, and stable-employment percentage? A property-management company in the area should have these aggregated.
- How much new apartment / multifamily construction is in the pipeline within 1–3 miles? Heavy new supply (>2% of stock underway) typically softens rents 12–24 months out; light construction supports rent growth.
Investment metrics
- 1% rule
- 1.68% ✓
- Cap rate
- 13.65%
- Cash-on-cash
- 26.28%
- DSCR
- 2.17
- GRM
- 5.0
CMA / ARV
- ARV (on-the-fly)
- $503,250
- Comps found
- 1
Show comp detail 1 sale within ~0.75 mi
| Address | Dist | Beds/Ba | Sqft | Sold | Price | $/sf | Match |
|---|---|---|---|---|---|---|---|
| 4026 Platt Springs Rd | 0.27mi | 8/6.0 (-1) | 4,000 (-1%) | 23mo | $500,000 | $125 | 53 |
Match score weights: distance 35% · size 25% · config 20% · recency 20%. Top-matched comps best support the ARV.
Projected returns pro-forma
-3.0% appreciation · 4.57% rent growth · sell at horizon
- IRR
- 21.9%
- Equity multiple
- 1.91×
- Total profit
- $75,453
- Equity at exit
- $43,985
- IRR
- 31.0%
- Equity multiple
- 4.00×
- Total profit
- $248,176
- Equity at exit
- $25,506
Cash invested: $82,600 (down + closing). Projections, not guarantees.
Landlord ↔ Tenant lean methodology
- Overall (STATE)
- 90 Strongly Landlord-Friendly
- State South Carolina
- 90 Strongly Landlord-Friendly · R+6
- County
- — inherits STATE
- City
- — inherits STATE
ZIP-level market 29170
- Home prices YoY
- -16.9%
- Rents YoY
- 4.6%
- Active inventory
- 187
- Price-to-rent
- 14.9×
Monthly cashflow live
- Estimated rent
- $4,954 medium interval (Pro) →
- Mortgage (P&I)
- −$1,547
- Tax from tax record
- −$435 /mo · $5,221/yr
- Insurance
- −$123
- HOA
- −$0
- Vacancy / Maint / Mgmt
- −$1,040
- Net cashflow
- $1,809
Break-even live
Sensitivity live
| Price | -10% $1,976 | -5% $1,892 | +0% $1,809 | +5% $1,725 | +10% $1,642 |
|---|---|---|---|---|---|
| Rent | -10% $1,417 | -5% $1,613 | +0% $1,809 | +5% $2,004 | +10% $2,200 |
| Rate | -1.0pp $1,957 | -0.5pp $1,884 | base $1,809 | +0.5pp $1,732 | +1.0pp $1,654 |
3-unit breakdown (identical units grouped — click to expand)
| Units | Beds | Baths | Est. rent |
|---|---|---|---|
| 3× units | 3 | 1.33 | $4,953 |
| #1 | 3 | 1.33 | $1,651 |
| #2 | 3 | 1.33 | $1,651 |
| #3 | 3 | 1.33 | $1,651 |
| Total (3 units) | $4,954 | ||
UW: 25.0% down · 7.5% · 30yr · 1.5% tax · 5.0% vac · 8.0% maint · 8.0% mgmt
Financing live
Cash to close
- Down payment
- $73,750
- Closing costs
- $8,850
- Reserves months
- —
- Total cash needed
- —
Loan-product check · same deal, 3 products live
Conventional
25% down · 7.5% · 30yr
- Down + closing
- —
- Monthly P&I
- —
- Monthly cashflow
- —
- DSCR
- —
- Eligible?
- —
Personal DTI + credit; lowest rate.
DSCR
20% down · 8.5% · 30yr
- Down + closing
- —
- Monthly P&I
- —
- Monthly cashflow
- —
- DSCR
- —
- Eligible?
- —
No personal income docs; deal must DSCR.
Hard money
10% down · 12.0% · 12mo
- Down + closing
- —
- Monthly P&I
- —
- Monthly cashflow
- —
- DSCR
- —
- Eligible?
- —
Short-term bridge; refi at stabilization.
Listing history 4 events
-
2026-05-18status Pending
-
2026-05-02$295,000 Active
-
2021-05-05soldstatus $121,000
-
1986-12-01soldstatus $140,000
ⓘ Source: listings_history table (triggers on properties + properties_extension) + one-shot
backfill from property_details.listing_events for pre-trigger history.
Tax reassessment forecast SC · Resets to sale price
- Current annual tax
- $5,221 · $435/mo
- Projected year-2 tax
- $5,221 · $435/mo
- Expected delta
- $0/yr ($0/mo · 0.0%)
ⓘ Screening estimate from a state-policy table — verify with the county assessor before closing.
Climate risk First Street
- Flood 1/10 Low FEMA zone X (unshaded) · 0% chance over 30 yrs
- Wildfire 4/10 Moderate
- Heat 7/10 Severe 7 d/yr ≥108°F today · 16 d/yr by 30 yrs out
- Wind 6/10 Major 67% chance of damaging wind over 30 yrs
- Air quality 3/10 Moderate 2 unhealthy d/yr today · 2 by 30 yrs out
Nearby sold comps map
Loading sold comps map…
Walkable amenities ~0.75 mi
Loading nearby amenities…
Taxation est. · year 1
- Rental income
- $59,448
- − Mortgage interest
- −$16,525
- − Property taxes
- −$5,221
- − Insurance
- −$1,475
- − Repairs & maintenance
- −$4,756
- − Management
- −$4,756
- − Depreciation
- −$8,582
- Taxable income
- $18,134
- Est. tax owed @ 24.0%
- −$4,352
- After-tax cash flow
- $17,351/yr
For passive investors: Depreciation is non-cash, so a rental often shows a tax loss while cash-flowing — sheltering income. Rental losses are passive: they offset passive income freely, and up to $25,000/yr can offset ordinary (W-2) income if you actively participate and your MAGI is under $100k (phasing out to $0 by $150k); unused losses carry forward. On sale, claimed depreciation is recaptured at up to 25%, and gains may owe capital-gains tax (a 1031 exchange can defer both). Figures are a year-1 estimate at your 24.0% rate — not tax advice; consult a CPA.
Schools (NCES district)
- District
- Lexington 01
- NCES district ID
- 4502700
- Math proficiency
- 42% ▼ -12.00%
- Reading proficiency
- 53% ▼ -2.00%
- Median HH income
- $61,298
- Composite
- 41.75/100
- National rank
- #3399
- State rank
- #11 of 80 in SC
Livability — Cayce
- Score
- 71/100
- State rank
- #55
- US rank
- #7173
Category grades
Schools grade is shown separately in the Schools card above.
Census & demographics
- County
- Lexington County · 232,571 people
- City population
- 12,837
- Metro
- Columbia, SC
- Population (ZIP)
- 21,247
- Household income
- $74,902
- Rent vs Own
- Severe rent burden
- 147.0
Population outlook (Lexington County) Hauer SSP2
- Today (2025)
- 322,999 people
- By 2030
- 342,356 · +6.0%
- By 2040
- 377,715 · +16.9%
- By 2050
- 406,984 · +26.0%
- By 2075
- 465,447 · +44.1%
- By 2100
- 485,674 · +50.4%
Race, ethnicity, and origin ACS 2023
- Neighborhood character
- Predominantly White (66%)
- Race & ethnicity
- White 66% Black 17% Hispanic / Latino 10% Two or more races 8% Asian 3%
- Hispanic origin (detail)
- Mexican 6% Puerto Rican 1%
- Common ancestry
- Serbian 2% Italian 2% Romanian 2%
- Foreign-born
- 9% · Canada, Jamaica, Guatemala
- Languages at home
- 90% English-only · Spanish 7% Other Indo-European 2%
Political lean MEDSL · Lexington
- 2024 margin
- Solid R (+33.5) · D 32.5% · R 66.0% · Other 1.4%
- 2008→2024 swing
- +4.6pp toward D · 2008: -38.0pp · 2024: -33.5pp
- All cycles
- 2024: R+33.5 2020: R+30.1 2016: R+36.7 2012: R+37.8 2008: R+38.0
Not yet ingested
- Civics
- —
Market trends
- HPI YoY
- ▼ -52.72%
- Current HPI
- 259.713
- Rent YoY
- ▲ 4.57%
- Metro
- Columbia, SC
- State GDP YoY
- ▲ 4.51%
- F500 in state
- 2
Industry mix (Fortune 500 HQ in SC)
| Industry | F500 HQs | Revenue |
|---|---|---|
| Packaging | 1 | $7B |
|
||
Price history
+110.7% since first listed4 events — show timeline
- 2026-05-18 Pending — Consolidated MLS
- 2026-05-02 Listed $295,000 Consolidated MLS
- 2021-05-05 Sold (Public Records) $121,000 Public Records
- 1986-12-01 Sold (Public Records) $140,000 Public Records
Property tax history
+3.9%/yrLatest (2024): $5,221 · +0.9% YoY. Source: county tax records.
Cash-flow waterfall
monthlySold comps — $/sqft
last 12 mo · ≤1 miLoading sold comps…