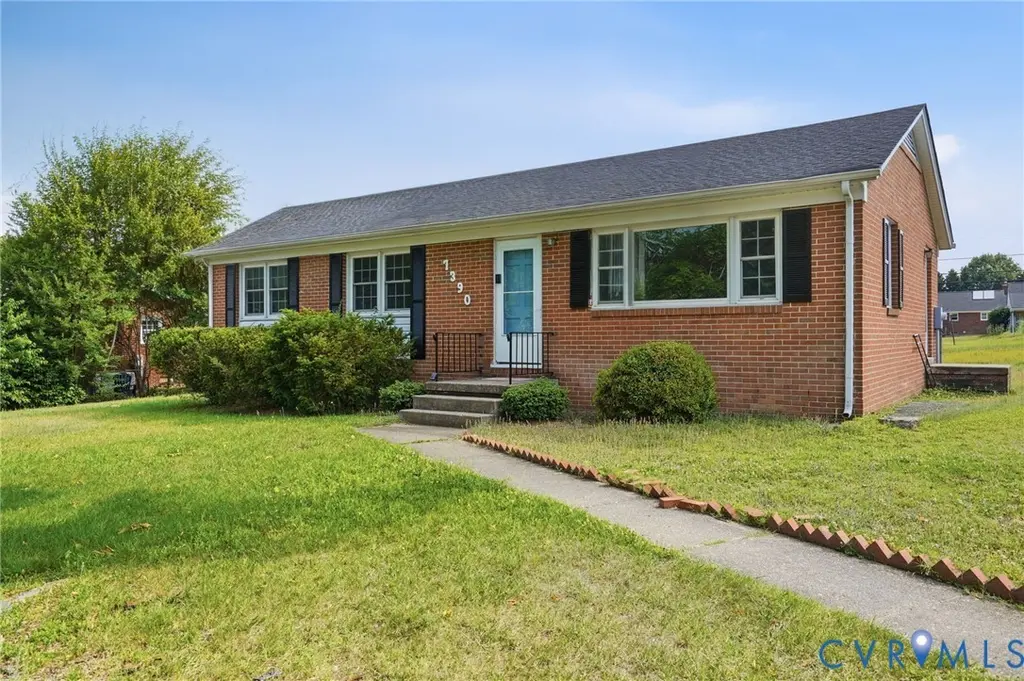
7390 Brandy Creek Dr · Mechanicsville, VA
Flood risk 1/10 · Minimal
- FEMA flood zone
- X (unshaded)
- Chance of flooding over 30 yrs
- 0.0%
- Est. flood insurance / yr
- $507 – $1,088
Fire risk 2/10 · Minimal
- Est. fire insurance / yr
- $666 – $1,236
Heat risk 8/10 · Major
- Hot days now (above 105°F)
- 7 days/yr
- Hot days in 30 yrs
- 16 days/yr
Wind risk 6/10 · Moderate
- Chance of severe wind over 30 yrs
- 27.0%
Air-quality risk 2/10 · Minimal
- Unhealthy air days now
- 1 days/yr
- Unhealthy air days in 30 yrs
- 2 days/yr
Risk factors via First Street. Map © Google.
Why this score? — see what drove the D grade
The composite is a weighted blend of 9 inputs, each scored 0–100. Each bar is that input's sub-score; the figure is the points it added to the 100-point composite (weight × sub-score).
- Cash flow +11.9/30.0
- Schools +7.0/10.0
- ARV discount +6.7/15.0
- Livability +3.7/5.0
- DSCR +3.5/10.0
- 1% rule +2.6/10.0
- Rent growth +2.5/5.0
- Condition / age +2.5/5.0
- Appreciation +0.0/10.0
$324,950
🖨 Deal sheet 📄 Offer letter ✓ Due diligence
Listing remarks
Be the first to see this 3-bedroom solid Brich Ranch home in the Brandy Creek community. This home offers solid oak wood floors throughout the home, three generously sized bedrooms including the Primary Suite with an attached ½ bath for your conveniences and a large eat-in kitchen. The exterior of this home features all brick siding, newer roof replacement and a large level lot.
Key facts
- Brick siding
- Large level lot
- 0.41 acre lot
Tags
Property features AI
Exterior
- Parking: Driveway parking; Off-street parking; Unpaved parking areas
- Utilities: Public water; Public sewer; Electric service
- Home design: Single-story home; Approximate year built; Brick and drywall construction; Composition roof
- Construction: Brick and drywall exterior; Composition roof; Built approximately (year details approximate)
- Exterior features: Storage shed; Stoop; Unpaved driveway; Level lot
Interior
- Kitchen: Eat-in kitchen; Refrigerator; Oven
- Bedrooms: All bedrooms on the main level; Bedrooms feature hardwood flooring and ceiling fans
- Flooring: Vinyl plank (LVP) flooring in kitchen and laundry; Hardwood flooring in living room and bedrooms
- Bathrooms: One full bathroom with tub and shower; One attached half bath
- Heating & cooling: Heat pump for heating and cooling; Electric heating components
- Interior features: Ceiling fans; Eat-in kitchen; Primary bedroom with bath; Main-level primary suite; Crawl space basement
- Laundry & utility: Main-level laundry; Electric water heater
Neighborhood map
What this means for you Summary
Snapshot
- This is a 3-bed/1.5-bath single-family listed at $325k.
Deal economics
- At list price, monthly cash flow is $-83 ($-991/yr) — negative.
- To cash-flow at today's rent, offer at most $310k (4.5% below list).
- To meet the 1% rule (rent ≥ 1% of price), the offer needs to be $246k (24.4% below list).
- Recommended offer: $246k (24.4% below list) — sets the bar for 1% rule.
- Cap rate 6.0% vs local median 3.1% in Mechanicsville — top-decile yield for the area; either an underpriced asset or a hidden risk that comps aren't pricing in. Stress-test before assuming the spread holds.
Location & tenants
- Location reads 73/100 on livability (#165 in VA) — a middle-class / working-renter tenant base. Strengths: schools A+, employment A+, housing A+; Watch: amenities F, commute F.
- Hanover County Public School District (suburban): math 79% / reading 81% proficiency, ranked #5 of 131 in VA (top 4%) — strong family-tenant draw, lease renewals of 3-5y typical; only 15% free/reduced lunch — higher-income household profile.
- Market conditions: 214 active listings in the ZIP; 2 comparable units currently listed for rent nearby; solid renter incomes; 447 units permitted in Hanover County in 2024 (0 in 5+ unit buildings).
Forward outlook
- Local home prices are declining (-3.0%/yr); year-one equity from $2k of loan paydown is wiped out by about $10k of value loss. Plan a longer hold.
- Hanover County population projected at +11% by 2050 — modest demand growth; plan on rents tracking national, not racing it.
Negotiation context
- It's been on market 19 days — a 2% lower offer ($320k) is reasonable based on typical stale-listing flexibility.
Risks & watch-outs
- Climate carrying-cost: major wind risk, 27% chance of damaging wind over 30y; extreme-heat days projected 7→16/yr by 2055 (HVAC capex compounding) — expect insurance premiums to compound above CPI over the hold.
Questions for the listing agent
- What do current leases actually rent for vs. the listed asking? Can we see a recent rent roll and the last 12 months of T-12 income?
- Built in 1962 — when were the roof, HVAC, electrical panel, plumbing, and water heater last replaced?
- Is there a deadline driving the sale (1031 exchange, divorce, estate, relocation)? That informs how much negotiation room exists.
- Schools are A-rated — typically a magnet for longer-tenancy family renters. What's the average tenant stay here, and is there a school-zone premium baked into asking?
- The area grade is low — what's the realistic commute time and amenity access for the typical tenant pool here? Any planned neighborhood developments (good or bad) we should know about?
- What's the average days-on-market for RENTAL listings here right now (not sales)? A rising rental-DOM trend means longer vacancies and softer asking-rent achievability than the comps imply.
- What's the recent tenant-quality profile in this submarket — average credit score on applications, eviction rate, late-payment / NSF rate, and stable-employment percentage? A property-management company in the area should have these aggregated.
- How much new for-sale + rental construction is in the pipeline within 1–3 miles? Heavy new supply typically softens prices + rents 12–24 months out; constrained supply supports both.
Investment metrics
- 1% rule
- 0.76% ✗
- Cap rate
- 5.99%
- Cash-on-cash
- -1.09%
- DSCR
- 0.95
- GRM
- 11.0
CMA / ARV
- ARV (on-the-fly)
- $319,545
- Comps found
- 8
Show comp detail 8 sales within ~0.75 mi
| Address | Dist | Beds/Ba | Sqft | Sold | Price | $/sf | Match |
|---|---|---|---|---|---|---|---|
| 7380 Brandy Creek Dr | 0.04mi | 3/1.5 | 1,075 (-12%) | 10mo | $315,000 | $293 | 71 |
| 7336 Walnut Grove Rd | 0.61mi | 3/2.0 | 1,196 (-2%) | 10mo | $329,950 | $276 | 58 |
| 7283 Walnut Grove Dr | 0.65mi | 3/1.5 | 1,300 (+7%) | 7mo | $339,000 | $261 | 52 |
| 7247 Drewce Ct | 0.59mi | 4/2.0 (+1) | 1,296 (+7%) | 8mo | $350,000 | $270 | 48 |
| 7071 Sunnyhill Dr | 0.51mi | 3/2.0 | 1,378 (+13%) | 7mo | $355,000 | $258 | 46 |
| 7021 Walgrove Ct | 0.66mi | 4/2.0 (+1) | 1,321 (+9%) | 2mo | $340,000 | $257 | 46 |
| 7250 Drewce Ct | 0.56mi | 4/2.0 (+1) | 1,296 (+7%) | 14mo | $341,000 | $263 | 44 |
| 6384 Wilpat Rd | 0.64mi | 4/2.0 (+1) | 1,296 (+7%) | 21mo | $300,000 | $231 | 34 |
Match score weights: distance 35% · size 25% · config 20% · recency 20%. Top-matched comps best support the ARV.
Projected returns pro-forma
-3.0% appreciation · 3.0% rent growth · sell at horizon
- IRR
- -18.1%
- Equity multiple
- 0.36×
- Total profit
- $-58,013
- Equity at exit
- $48,451
- IRR
- -10.5%
- Equity multiple
- 0.37×
- Total profit
- $-57,690
- Equity at exit
- $28,096
Cash invested: $90,986 (down + closing). Projections, not guarantees.
Landlord ↔ Tenant lean methodology
- Overall (STATE)
- 55 Moderately Landlord-Leaning
- State Virginia
- 55 Moderately Landlord-Leaning · D+2
- County
- — inherits STATE
- City
- — inherits STATE
ZIP-level market 23111
- Home prices YoY
- -14.0%
- Active inventory
- 214
- Price-to-rent
- 11.0×
Monthly cashflow live
- Estimated rent
- $2,457 medium interval (Pro) →
- Mortgage (P&I)
- −$1,704
- Tax from tax record
- −$184 /mo · $2,210/yr
- Insurance
- −$135
- HOA
- −$0
- Vacancy / Maint / Mgmt
- −$516
- Net cashflow
- $-83
Break-even live
UW: 25.0% down · 7.5% · 30yr · 1.5% tax · 5.0% vac · 8.0% maint · 8.0% mgmt
Financing live
Cash to close
- Down payment
- $81,238
- Closing costs
- $9,748
- Reserves months
- —
- Total cash needed
- —
Loan-product check · same deal, 3 products live
Conventional
25% down · 7.5% · 30yr
- Down + closing
- —
- Monthly P&I
- —
- Monthly cashflow
- —
- DSCR
- —
- Eligible?
- —
Personal DTI + credit; lowest rate.
DSCR
20% down · 8.5% · 30yr
- Down + closing
- —
- Monthly P&I
- —
- Monthly cashflow
- —
- DSCR
- —
- Eligible?
- —
No personal income docs; deal must DSCR.
Hard money
10% down · 12.0% · 12mo
- Down + closing
- —
- Monthly P&I
- —
- Monthly cashflow
- —
- DSCR
- —
- Eligible?
- —
Short-term bridge; refi at stabilization.
Rent comps 2 comps
| Address | Beds | Baths | Sqft | Rent | $/sqft | DOM | Units | Dist |
|---|---|---|---|---|---|---|---|---|
| 7112 Mechanicsville Tpke Mechanicsville, VA | 1.0–2.0 | 1.0–2.0 | 908 | $2,319 | $2.55 | 1d | 11 | 0.72mi |
| 7264 Cold Harbor Rd Mechanicsville, VA | 2.0–3.0 | 2.0 | 1160 | $1,799 | $1.55 | 1d | 1 | 1.49mi |
Listing history 11 events
-
2026-06-13statusdays on market $324,950 Pending 19 DOM
-
2026-06-10price $324,950 Active 18 DOM
-
2026-06-09days on market $329,950 Active 18 DOM
-
2026-06-08days on market $329,950 Active 17 DOM
-
2026-06-07days on market $329,950 Active 16 DOM
-
2026-06-05days on market $329,950 Active 13 DOM
-
2026-06-03days on market $329,950 Active 12 DOM
-
2026-06-02days on market $329,950 Active 11 DOM
-
2026-06-01days on market $329,950 Active 10 DOM
-
2026-05-31days on market $329,950 Active 9 DOM
-
2026-05-21$329,950 Active
ⓘ Source: listings_history table (triggers on properties + properties_extension) + one-shot
backfill from property_details.listing_events for pre-trigger history.
Tax reassessment forecast VA · Resets to sale price
- Current annual tax
- $2,210 · $184/mo
- Projected year-2 tax
- $2,665 · $222/mo
- Expected delta
- +$455/yr (+$38/mo · 20.6%)
ⓘ Screening estimate from a state-policy table — verify with the county assessor before closing.
Climate risk First Street
- Flood 1/10 Low FEMA zone X (unshaded) · 0% chance over 30 yrs
- Wildfire 2/10 Low
- Heat 8/10 Severe 7 d/yr ≥105°F today · 16 d/yr by 30 yrs out
- Wind 6/10 Major 27% chance of damaging wind over 30 yrs
- Air quality 2/10 Low 1 unhealthy d/yr today · 2 by 30 yrs out
Nearby sold comps map
Loading sold comps map…
Walkable amenities ~0.75 mi
Loading nearby amenities…
Taxation est. · year 1
- Rental income
- $29,484
- − Mortgage interest
- −$18,202
- − Property taxes
- −$2,210
- − Insurance
- −$1,625
- − Repairs & maintenance
- −$2,359
- − Management
- −$2,359
- − Depreciation
- −$9,453
- Taxable loss
- −$6,723
- Est. tax savings @ 24.0%
- +$1,613
- After-tax cash flow
- $623/yr
For passive investors: Depreciation is non-cash, so a rental often shows a tax loss while cash-flowing — sheltering income. Rental losses are passive: they offset passive income freely, and up to $25,000/yr can offset ordinary (W-2) income if you actively participate and your MAGI is under $100k (phasing out to $0 by $150k); unused losses carry forward. On sale, claimed depreciation is recaptured at up to 25%, and gains may owe capital-gains tax (a 1031 exchange can defer both). Figures are a year-1 estimate at your 24.0% rate — not tax advice; consult a CPA.
Schools (NCES district)
- District
- Hanover County Public School District
- NCES district ID
- 5101830
- Math proficiency
- 79% ▼ -11.00%
- Reading proficiency
- 81% ▼ -3.00%
- Median HH income
- $78,386
- Composite
- 70.37/100
- National rank
- #268
- State rank
- #5 of 131 in VA
Livability — Mechanicsville
- Score
- 73/100
- State rank
- #165
- US rank
- #5098
Category grades
Schools grade is shown separately in the Schools card above.
Census & demographics
- Census place
- Mechanicsville, VA
- County
- Hanover County · 134,767 people
- City population
- 72,258
- Metro
- Richmond, VA
- Population (ZIP)
- 38,070
- Household income
- $98,969
- Rent vs Own
- Severe rent burden
- 825.0
Population outlook (Hanover County) Hauer SSP2
- Today (2025)
- 111,687 people
- By 2030
- 115,373 · +3.3%
- By 2040
- 120,828 · +8.2%
- By 2050
- 123,591 · +10.7%
- By 2075
- 132,168 · +18.3%
- By 2100
- 130,105 · +16.5%
Race, ethnicity, and origin ACS 2023
- Neighborhood character
- Predominantly White (83%)
- Race & ethnicity
- White 83% Black 8% Two or more races 6% Hispanic / Latino 2% Asian 1%
- Common ancestry
- Italian 3% Serbian 3% Lithuanian 2%
- Foreign-born
- 4% · Canada
- Languages at home
- 97% English-only · Spanish 1% Other Asian/Pacific 1%
Political lean MEDSL · Hanover
- 2024 margin
- Strong R (+25.8) · D 36.6% · R 62.4% · Other 1.1%
- 2008→2024 swing
- +7.8pp toward D · 2008: -33.6pp · 2024: -25.8pp
- All cycles
- 2024: R+25.8 2020: R+26.8 2016: R+32.5 2012: R+36.7 2008: R+33.6
Not yet ingested
- Civics
- —
Market trends
- HPI YoY
- ▼ -41.34%
- Current HPI
- 253.858
- Rent YoY
- —
- Metro
- Richmond, VA
- State GDP YoY
- ▲ 2.40%
- F500 in state
- 50
Industry mix (Fortune 500 HQ in VA)
| Industry | F500 HQs | Revenue |
|---|---|---|
| Aerospace / Defense | 4 | $236B |
|
||
| Technology / Defense | 3 | $32B |
|
||
| Financial Services | 2 | $176B |
|
||
| Utilities | 2 | $27B |
|
||
| Insurance | 2 | $25B |
|
||
| Technology | 2 | $15B |
|
||
Price history
1 event — show timeline
- 2026-05-21 Listed $329,950 CVRMLS
Property tax history
+6.0%/yrLatest (2026): $2,210 · +5.2% YoY. Source: county tax records.
Cash-flow waterfall
monthlySold comps — $/sqft
last 12 mo · ≤1 miLoading sold comps…