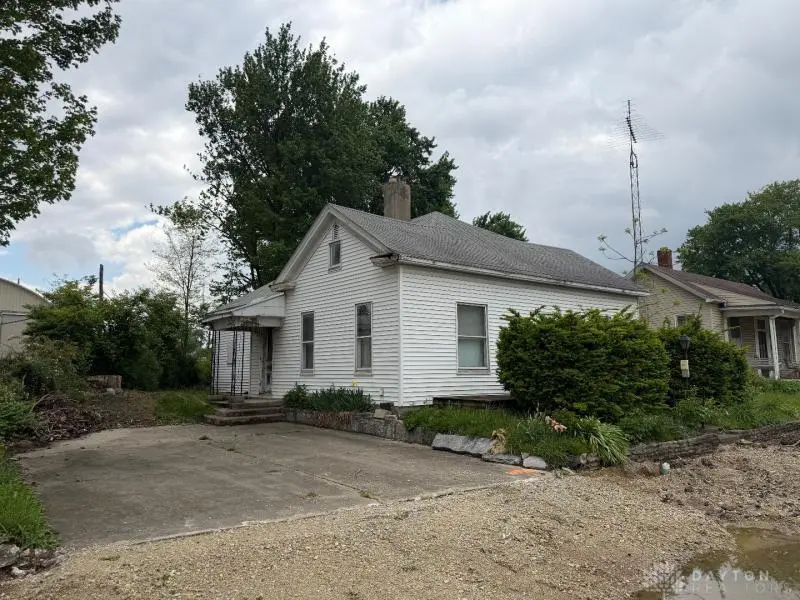
415 N Maple St · Eaton, OH
Flood risk 1/10 · Minimal
- FEMA flood zone
- X (unshaded)
- Chance of flooding over 30 yrs
- 0.0%
- Est. flood insurance / yr
- $507 – $1,088
Fire risk 1/10 · Minimal
- Est. fire insurance / yr
- $713 – $1,323
Heat risk 3/10 · Minor
- Hot days now (above 100°F)
- 7 days/yr
- Hot days in 30 yrs
- 19 days/yr
Wind risk 2/10 · Minimal
- Chance of severe wind over 30 yrs
- 0.0%
Air-quality risk 3/10 · Minor
- Unhealthy air days now
- 2 days/yr
- Unhealthy air days in 30 yrs
- 4 days/yr
Risk factors via First Street. Map © Google.
Why this score? — see what drove the B grade
The composite is a weighted blend of 9 inputs, each scored 0–100. Each bar is that input's sub-score; the figure is the points it added to the 100-point composite (weight × sub-score).
- Cash flow +30.0/30.0
- 1% rule +10.0/10.0
- DSCR +10.0/10.0
- ARV discount +7.5/15.0
- Schools +5.7/10.0
- Livability +3.9/5.0
- Rent growth +2.5/5.0
- Condition / age +2.5/5.0
- Appreciation +0.0/10.0
$25,000
🖨 Deal sheet 📄 Offer letter ✓ Due diligence
Listing remarks
Investor opportunity in the heart of Eaton! 415 N Maple St offers strong upside for a fix-and-flip or long-term rental strategy. This property is ideal for buyers looking to add value through a full interior renovation. The roof is approximately 15 years old, and the home will need a full rehab inside, making it a great project for experienced investors or contractors looking for their next value-add opportunity. Located in an established neighborhood with strong comparable sales nearby. Property is being sold as-is. Great opportunity for investors seeking a quick flip
Key facts
- Interior renovation
- Full rehab
- 4,080 sq ft lot
Tags
Property features AI
Finance
- Financial info: Offered for sale
Exterior
- Parking: No garage
- Home design: Single-story property; Entry level: main
- Construction: Slab foundation
- Exterior features: Residential zoning; Lot dimensions approximately 78 x 102 x 128
Interior
- Bathrooms: One full bathroom; Full bathroom on the main level
- Interior features: Total of 4 rooms
Neighborhood map
What this means for you Summary
Snapshot
- This is a 2-bed/1.0-bath single-family listed at $25k.
Deal economics
- At list price, monthly cash flow is $471 ($6k/yr) — positive.
- The deal already cash-flows at list — no discount required.
- Meets the 1% rule at list price ($864 rent vs $25k).
- Recommended offer: $25k (1.5% below list) — sets the bar for market timing.
- Cap rate 28.9% vs local median 2.2% in Eaton — top-decile yield for the area; either an underpriced asset or a hidden risk that comps aren't pricing in. Stress-test before assuming the spread holds.
Location & tenants
- Location reads 78/100 on livability (#180 in OH, #2,768 nationally) — a middle-class / working-renter tenant base. Strengths: cost of living A+, housing A+, health & safety A+; Watch: amenities F, commute F.
- Eaton Community City (town): math 67% / reading 68% proficiency, ranked #184 of 656 in OH (top 28%) — acceptable for families but not a draw, mixed tenant base, ~2y average lease.
- Market conditions: 88 active listings in the ZIP; 55 units permitted in Preble County in 2024 (0 in 5+ unit buildings).
- This rent is only 15% of the median local income ($69k/yr) — well below the 30% rent-burden line; pricing power to push rent on renewal without tenant pushback.
Forward outlook
- Local home prices are declining (-3.0%/yr); year-one equity from $173 of loan paydown is wiped out by about $750 of value loss. Plan a longer hold.
- Preble County population projected at -17% by 2050 — secular population decline; favor cash flow + early exit over multi-decade hold.
- At projected returns (-3.0% appreciation + 3.0% rent growth), your $7k cash investment doubles in ~2 years — after that, you're playing with house money.
Negotiation context
- It's been on market 29 days — a 2% lower offer ($25k) is reasonable based on typical stale-listing flexibility.
Risks & watch-outs
- Watch-outs: property tax is 3.4% of price; built in 1940 — expect roof / HVAC / electrical / plumbing capex.
Questions for the listing agent
- Built in 1940 — when were the roof, HVAC, electrical panel, plumbing, and water heater last replaced?
- Property tax is high relative to price — has the assessment been appealed recently, and will the sale trigger a re-assessment?
- Is there a deadline driving the sale (1031 exchange, divorce, estate, relocation)? That informs how much negotiation room exists.
- Schools are A-rated — typically a magnet for longer-tenancy family renters. What's the average tenant stay here, and is there a school-zone premium baked into asking?
- What's the average days-on-market for RENTAL listings here right now (not sales)? A rising rental-DOM trend means longer vacancies and softer asking-rent achievability than the comps imply.
- What's the recent tenant-quality profile in this submarket — average credit score on applications, eviction rate, late-payment / NSF rate, and stable-employment percentage? A property-management company in the area should have these aggregated.
- How much new for-sale + rental construction is in the pipeline within 1–3 miles? Heavy new supply typically softens prices + rents 12–24 months out; constrained supply supports both.
Investment metrics
- 1% rule
- 3.46% ✓
- Cap rate
- 28.89%
- Cash-on-cash
- 80.70%
- DSCR
- 4.59
- GRM
- 2.4
CMA / ARV
- ARV (median comp)
- $173,737
- List price
- $25,000
- Delta
- -85.61%
- Verdict
- UNDERPRICED
- Comps
- 20 within 1.0 mi
Show comp detail 12 sales within ~0.75 mi
| Address | Dist | Beds/Ba | Sqft | Sold | Price | $/sf | Match |
|---|---|---|---|---|---|---|---|
| 405 Walnut St | 0.36mi | 2/1.0 | 1,477 (-2%) | 6mo | $162,000 | $110 | 75 |
| 612 N Cherry St | 0.13mi | 3/1.0 (+1) | 1,386 (-8%) | 4mo | $158,000 | $114 | 72 |
| 300 S Barron St | 0.53mi | 3/1.0 (+1) | 1,530 (+2%) | 4mo | $121,000 | $79 | 64 |
| 124 Deem St | 0.24mi | 3/1.0 (+1) | 1,696 (+13%) | 1mo | $158,000 | $93 | 62 |
| 1211 N Aukerman St | 0.57mi | 3/2.0 (+1) | 1,428 (-5%) | 2mo | $220,000 | $154 | 55 |
| 308 Hubble St | 0.38mi | 3/1.0 (+1) | 1,341 (-11%) | 6mo | $62,000 | $46 | 54 |
| 210 W Spring St | 0.46mi | 3/1.0 (+1) | 1,352 (-10%) | 4mo | $170,000 | $126 | 54 |
| 219 Nation Ave | 0.57mi | 3/2.0 (+1) | 1,556 (+4%) | 7mo | $235,000 | $151 | 53 |
| 1405 Judy Ave | 0.70mi | 3/2.0 (+1) | 1,504 (+0%) | 7mo | $220,000 | $146 | 52 |
| 321 Liberty St | 0.67mi | 2/1.0 | 1,296 (-14%) | 2mo | $172,000 | $133 | 44 |
| 331 W Chicago St | 0.58mi | 3/1.5 (+1) | 1,320 (-12%) | 6mo | $199,000 | $151 | 40 |
| 922 E Somers St | 0.56mi | 3/2.0 (+1) | 1,318 (-12%) | 8mo | $110,000 | $83 | 38 |
Match score weights: distance 35% · size 25% · config 20% · recency 20%. Top-matched comps best support the ARV.
Projected returns pro-forma
-3.0% appreciation · 3.0% rent growth · sell at horizon
- IRR
- 80.9%
- Equity multiple
- 4.71×
- Total profit
- $25,968
- Equity at exit
- $3,728
- IRR
- 84.4%
- Equity multiple
- 9.77×
- Total profit
- $61,370
- Equity at exit
- $2,162
Cash invested: $7,000 (down + closing). Projections, not guarantees.
Landlord ↔ Tenant lean methodology
- Overall (STATE)
- 73 Landlord-Friendly
- State Ohio
- 73 Landlord-Friendly · R+6
- County
- — inherits STATE
- City
- — inherits STATE
ZIP-level market 45320
- Home prices YoY
- -29.4%
- Active inventory
- 88
- Price-to-rent
- 2.4×
Monthly cashflow live
- Estimated rent
- $864 medium interval (Pro) →
- Mortgage (P&I)
- −$131
- Tax from tax record
- −$70 /mo · $844/yr
- Insurance
- −$10
- HOA
- −$0
- Vacancy / Maint / Mgmt
- −$181
- Net cashflow
- $471
Break-even live
UW: 25.0% down · 7.5% · 30yr · 1.5% tax · 5.0% vac · 8.0% maint · 8.0% mgmt
Financing live
Cash to close
- Down payment
- $6,250
- Closing costs
- $750
- Reserves months
- —
- Total cash needed
- —
Loan-product check · same deal, 3 products live
Conventional
25% down · 7.5% · 30yr
- Down + closing
- —
- Monthly P&I
- —
- Monthly cashflow
- —
- DSCR
- —
- Eligible?
- —
Personal DTI + credit; lowest rate.
DSCR
20% down · 8.5% · 30yr
- Down + closing
- —
- Monthly P&I
- —
- Monthly cashflow
- —
- DSCR
- —
- Eligible?
- —
No personal income docs; deal must DSCR.
Hard money
10% down · 12.0% · 12mo
- Down + closing
- —
- Monthly P&I
- —
- Monthly cashflow
- —
- DSCR
- —
- Eligible?
- —
Short-term bridge; refi at stabilization.
Listing history 6 events
-
2026-06-02days on market $25,000 Active 29 DOM
-
2026-06-01days on market $25,000 Active 28 DOM
-
2026-05-31days on market $25,000 Active 27 DOM
-
2026-05-30days on market $25,000 Active 26 DOM
-
2026-05-15price $30,000 575-char remark
-
2026-05-04$45,000 Active 575-char remark
ⓘ Source: listings_history table (triggers on properties + properties_extension) + one-shot
backfill from property_details.listing_events for pre-trigger history.
Tax reassessment forecast OH · Partial reset (capped growth)
- Current annual tax
- $844 · $70/mo
- Projected year-2 tax
- $844 · $70/mo
- Expected delta
- $0/yr ($0/mo · 0.0%)
ⓘ Screening estimate from a state-policy table — verify with the county assessor before closing.
Climate risk First Street
- Flood 1/10 Low FEMA zone X (unshaded) · 0% chance over 30 yrs
- Wildfire 1/10 Low
- Heat 3/10 Moderate 7 d/yr ≥100°F today · 19 d/yr by 30 yrs out
- Wind 2/10 Low 0% chance of damaging wind over 30 yrs
- Air quality 3/10 Moderate 2 unhealthy d/yr today · 4 by 30 yrs out
Nearby sold comps map
Loading sold comps map…
Walkable amenities ~0.75 mi
Loading nearby amenities…
Taxation est. · year 1
- Rental income
- $10,369
- − Mortgage interest
- −$1,400
- − Property taxes
- −$844
- − Insurance
- −$125
- − Repairs & maintenance
- −$830
- − Management
- −$830
- − Depreciation
- −$727
- Taxable income
- $5,613
- Est. tax owed @ 24.0%
- −$1,347
- After-tax cash flow
- $4,302/yr
For passive investors: Depreciation is non-cash, so a rental often shows a tax loss while cash-flowing — sheltering income. Rental losses are passive: they offset passive income freely, and up to $25,000/yr can offset ordinary (W-2) income if you actively participate and your MAGI is under $100k (phasing out to $0 by $150k); unused losses carry forward. On sale, claimed depreciation is recaptured at up to 25%, and gains may owe capital-gains tax (a 1031 exchange can defer both). Figures are a year-1 estimate at your 24.0% rate — not tax advice; consult a CPA.
Schools (NCES district)
- District
- Eaton Community City
- NCES district ID
- 3904393
- Math proficiency
- 67% ▼ -10.00%
- Reading proficiency
- 68% ▼ -5.00%
- Median HH income
- $46,677
- Composite
- 56.98/100
- National rank
- #1108
- State rank
- #184 of 656 in OH
Livability — Eaton
- Score
- 78/100
- State rank
- #180
- US rank
- #2768
Category grades
Schools grade is shown separately in the Schools card above.
Census & demographics
- Census place
- Eaton, OH
- County
- Preble · 42,634 people
- Population (ZIP)
- 15,402
- Household income
- $68,740
- Rent vs Own
- Severe rent burden
- 16.4
Population outlook (Preble County) Hauer SSP2
- Today (2025)
- 39,711 people
- By 2030
- 38,511 · -3.0%
- By 2040
- 35,783 · -9.9%
- By 2050
- 33,006 · -16.9%
- By 2075
- 27,067 · -31.8%
- By 2100
- 21,255 · -46.5%
Race, ethnicity, and origin ACS 2023
- Neighborhood character
- Predominantly White (95%)
- Race & ethnicity
- White 95% Two or more races 3%
- Common ancestry
- Slovak 2% Italian 2% Lithuanian 1%
- Foreign-born
- 1% · Canada
- Languages at home
- 98% English-only · Tagalog/Filipino 1%
Political lean MEDSL · Preble
- 2024 margin
- Solid R (+59.1) · D 20.1% · R 79.2%
- 2008→2024 swing
- -27.9pp toward R · 2008: -31.2pp · 2024: -59.1pp
- All cycles
- 2024: R+59.1 2020: R+57.5 2016: R+54.0 2012: R+36.7 2008: R+31.2
Not yet ingested
- Civics
- —
Market trends
- HPI YoY
- ▼ -91.15%
- Current HPI
- 218.4233
- Rent YoY
- —
- Metro
- —
- State GDP YoY
- ▲ 1.98%
- F500 in state
- 48
Industry mix (Fortune 500 HQ in OH)
| Industry | F500 HQs | Revenue |
|---|---|---|
| Insurance | 3 | $145B |
|
||
| Industrial Machinery | 3 | $49B |
|
||
| Financial Services | 3 | $24B |
|
||
| Consumer Goods | 2 | $93B |
|
||
| Aerospace / Defense | 2 | $47B |
|
||
| Utilities | 2 | $33B |
|
||
Price history
-44.4% since first listed4 events — show timeline
- 2026-06-03 Listing Removed — Dayton MLS
- 2026-05-27 Price Changed $25,000 Dayton MLS
- 2026-05-15 Price Changed $30,000 Dayton MLS
- 2026-05-04 Listed $45,000 Dayton MLS
Property tax history
+2.4%/yrLatest (2025): $844 · +1.1% YoY. Source: county tax records.
Cash-flow waterfall
monthlySold comps — $/sqft
last 12 mo · ≤1 miLoading sold comps…