39 Liza St Plan · Boyne City, MI
Flood risk No data
- FEMA flood zone
- —
- Chance of flooding over 30 yrs
- —
- Est. flood insurance / yr
- —
Fire risk No data
- Est. fire insurance / yr
- —
Heat risk No data
- Hot days now (above threshold)
- —
- Hot days in 30 yrs
- —
Wind risk No data
- Chance of severe wind over 30 yrs
- —
Air-quality risk No data
- Unhealthy air days now
- —
- Unhealthy air days in 30 yrs
- —
Risk factors via First Street. Map © Google.
Why this score? — see what drove the C grade
The composite is a weighted blend of 9 inputs, each scored 0–100. Each bar is that input's sub-score; the figure is the points it added to the 100-point composite (weight × sub-score).
- Cash flow +22.2/30.0
- ARV discount +7.5/15.0
- DSCR +7.1/10.0
- 1% rule +5.8/10.0
- Condition / age +5.0/5.0
- Schools +4.0/10.0
- Livability +4.0/5.0
- Rent growth +2.5/5.0
- Appreciation +0.0/10.0
$147,995
🖨 Deal sheet 📄 Offer letter ✓ Due diligence
Listing remarks
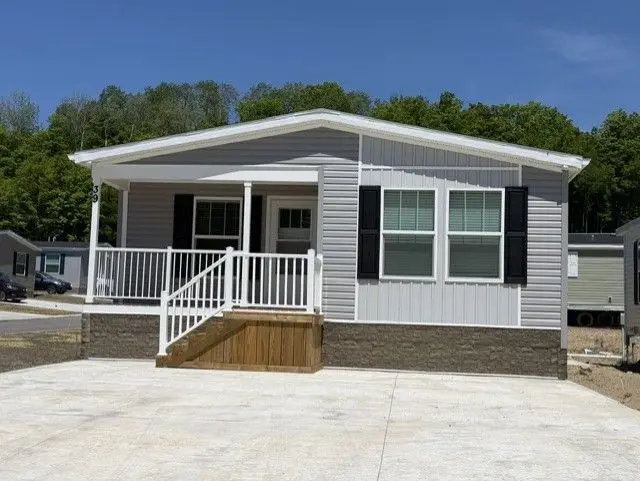
Check out this brand-new home located in Boyne City s newest community! It includes an open floor plan with a fantastic kitchen and with an island. It is a full drywall home and has three bedrooms and two bathrooms. It includes new kitchen appliances, washer and dryer, central air, and a covered porch.
Key facts
- Covered porch
- Open floor plan
- Fantastic kitchen
Tags
Property features AI
Finance
- Financial info: List price $147,995
Exterior
- Home design: Address: 39 Liza St Plan, Boyne City, MI 49712; Active listing
- Exterior features: Living area approximately 1,498
Interior
- Bedrooms: 3 bedrooms
- Bathrooms: 2 full bathrooms
- Interior features: Plan home (new construction plan named "39 Liza St")
Neighborhood map
What this means for you Summary
Snapshot
- This is a 3-bed/2.0-bath manufactured listed at $148k. Condition is rated excellent.
Deal economics
- At list price, monthly cash flow is $240 ($3k/yr) — positive.
- The deal already cash-flows at list — no discount required.
- Meets the 1% rule at list price ($2k rent vs $148k).
- Recommended offer: $146k (1.5% below list) — sets the bar for market timing.
Location & tenants
- Location reads 79/100 on livability (#93 in MI, #2,175 nationally) — a middle-class / working-renter tenant base. Strengths: crime A+, cost of living A+, housing A+; Watch: employment D+, amenities F, commute F.
- Boyne City Public Schools (town): math 39% / reading 54% proficiency, ranked #128 of 540 in MI (top 24%) — families likely to look elsewhere, expect single-tenant / working-renter base with shorter leases.
- Market conditions: 32 active listings in the ZIP; 1 comparable units currently listed for rent nearby; 113 units permitted in Charlevoix County in 2024 (0 in 5+ unit buildings).
Forward outlook
- Local home prices are declining (-3.0%/yr); year-one equity from $1k of loan paydown is wiped out by about $4k of value loss. Plan a longer hold.
- Charlevoix County population projected to shrink 7% by 2050 — rents likely to lag national; underwrite the cash flow, not the appreciation.
Negotiation context
- It's been on market 15 days — a 2% lower offer ($146k) is reasonable based on typical stale-listing flexibility.
Questions for the listing agent
- Is there a deadline driving the sale (1031 exchange, divorce, estate, relocation)? That informs how much negotiation room exists.
- Schools are B-rated — typically a magnet for longer-tenancy family renters. What's the average tenant stay here, and is there a school-zone premium baked into asking?
- What's the average days-on-market for RENTAL listings here right now (not sales)? A rising rental-DOM trend means longer vacancies and softer asking-rent achievability than the comps imply.
- What's the recent tenant-quality profile in this submarket — average credit score on applications, eviction rate, late-payment / NSF rate, and stable-employment percentage? A property-management company in the area should have these aggregated.
- How much new for-sale + rental construction is in the pipeline within 1–3 miles? Heavy new supply typically softens prices + rents 12–24 months out; constrained supply supports both.
Investment metrics
- 1% rule
- 1.08% ✓
- Cap rate
- 8.24%
- Cash-on-cash
- 6.96%
- DSCR
- 1.31
- GRM
- 7.7
CMA / ARV
No comps found within radius.
Projected returns pro-forma
-3.0% appreciation · 3.0% rent growth · sell at horizon
- IRR
- -5.6%
- Equity multiple
- 0.79×
- Total profit
- $-8,643
- Equity at exit
- $22,067
- IRR
- 4.1%
- Equity multiple
- 1.30×
- Total profit
- $12,292
- Equity at exit
- $12,796
Cash invested: $41,439 (down + closing). Projections, not guarantees.
Landlord ↔ Tenant lean methodology
- Overall (STATE)
- 62 Landlord-Friendly
- State Michigan
- 62 Landlord-Friendly · EVEN
- County
- — inherits STATE
- City
- — inherits STATE
ZIP-level market 49712
- Active inventory
- 32
- Price-to-rent
- 7.7×
Monthly cashflow live
- Estimated rent
- $1,599 medium interval (Pro) →
- Mortgage (P&I)
- −$776
- Tax est. 1.5%
- −$185 /mo · $2,220/yr
- Insurance
- −$62
- HOA
- −$0
- Vacancy / Maint / Mgmt
- −$336
- Net cashflow
- $240
Break-even live
UW: 25.0% down · 7.5% · 30yr · 1.5% tax · 5.0% vac · 8.0% maint · 8.0% mgmt
Financing live
Cash to close
- Down payment
- $36,999
- Closing costs
- $4,440
- Reserves months
- —
- Total cash needed
- —
Loan-product check · same deal, 3 products live
Conventional
25% down · 7.5% · 30yr
- Down + closing
- —
- Monthly P&I
- —
- Monthly cashflow
- —
- DSCR
- —
- Eligible?
- —
Personal DTI + credit; lowest rate.
DSCR
20% down · 8.5% · 30yr
- Down + closing
- —
- Monthly P&I
- —
- Monthly cashflow
- —
- DSCR
- —
- Eligible?
- —
No personal income docs; deal must DSCR.
Hard money
10% down · 12.0% · 12mo
- Down + closing
- —
- Monthly P&I
- —
- Monthly cashflow
- —
- DSCR
- —
- Eligible?
- —
Short-term bridge; refi at stabilization.
Rent comps 1 comps
| Address | Beds | Baths | Sqft | Rent | $/sqft | DOM | Units | Dist |
|---|---|---|---|---|---|---|---|---|
| 141 Fox Run St Boyne City, MI | 3.0 | 2.0 | 1296 | $1,599 | $1.23 | 43d | 1 | 0.17mi |
Listing history 12 events
-
2026-06-18days on market $147,995 Active 15 DOM
-
2026-06-17days on market $147,995 Active 14 DOM
-
2026-06-16days on market $147,995 Active 13 DOM
-
2026-06-15days on market $147,995 Active 12 DOM
-
2026-06-13days on market $147,995 Active 10 DOM
-
2026-06-12days on market $147,995 Active 9 DOM
-
2026-06-09days on market $147,995 Active 6 DOM
-
2026-06-08days on market $147,995 Active 5 DOM
-
2026-06-07days on market $147,995 Active 4 DOM
-
2026-06-07days on market $147,995 Active 3 DOM
-
2026-06-04remarks 303-char remark
-
2026-06-04$147,995 Active 1 DOM
ⓘ Source: listings_history table (triggers on properties + properties_extension) + one-shot
backfill from property_details.listing_events for pre-trigger history.
Nearby sold comps map
Loading sold comps map…
Walkable amenities ~0.75 mi
Loading nearby amenities…
Taxation est. · year 1
- Rental income
- $19,188
- − Mortgage interest
- −$8,290
- − Property taxes
- −$2,220
- − Insurance
- −$740
- − Repairs & maintenance
- −$1,535
- − Management
- −$1,535
- − Depreciation
- −$4,305
- Taxable income
- $563
- Est. tax owed @ 24.0%
- −$135
- After-tax cash flow
- $2,750/yr
For passive investors: Depreciation is non-cash, so a rental often shows a tax loss while cash-flowing — sheltering income. Rental losses are passive: they offset passive income freely, and up to $25,000/yr can offset ordinary (W-2) income if you actively participate and your MAGI is under $100k (phasing out to $0 by $150k); unused losses carry forward. On sale, claimed depreciation is recaptured at up to 25%, and gains may owe capital-gains tax (a 1031 exchange can defer both). Figures are a year-1 estimate at your 24.0% rate — not tax advice; consult a CPA.
Condition & rehab AI · 10 photos
This brand-new manufactured home in Boyne City is move-in ready with modern finishes and a well-maintained exterior. It offers a good return on investment with minimal updates needed to maximize its value.
Value-add opportunities
- Both Painting the exterior siding — Enhances curb appeal and can increase both resale and rental value.
- Both Upgrading the flooring in the bedrooms — Improves the aesthetic and functionality of the bedrooms, which can boost both resale and rental value.
- Both Adding smart home features — Enhances convenience and can attract tech-savvy buyers or renters, increasing both resale and rental value.
Renovation cost estimate screening
Value-add ROI direction
- Both Painting the exterior siding — Enhances curb appeal and can increase both resale and rental value. ↑
- Both Upgrading the flooring in the bedrooms — Improves the aesthetic and functionality of the bedrooms, which can boost both resale and rental value. ↑
- Both Adding smart home features — Enhances convenience and can attract tech-savvy buyers or renters, increasing both resale and rental value. ↑
ⓘ Cost ranges are severity-bucket heuristics (US national rule-of-thumb). Get contractor quotes + a written scope before underwriting a rehab budget.
Schools (NCES district)
- District
- Boyne City Public Schools
- NCES district ID
- 2606500
- Math proficiency
- 39% ▼ -6.00%
- Reading proficiency
- 54% ▼ -1.00%
- Median HH income
- $50,238
- Composite
- 39.85/100
- National rank
- #3869
- State rank
- #128 of 540 in MI
Livability — Boyne City
- Score
- 79/100
- State rank
- #93
- US rank
- #2175
Category grades
Schools grade is shown separately in the Schools card above.
Census & demographics
- Census place
- Boyne City, MI
- City population
- 8,177
- Population (ZIP)
- 8,177
Population outlook (Charlevoix County) Hauer SSP2
- Today (2025)
- 26,625 people
- By 2030
- 26,629 · +0.0%
- By 2040
- 26,037 · -2.2%
- By 2050
- 24,648 · -7.4%
- By 2075
- 21,275 · -20.1%
- By 2100
- 16,263 · -38.9%
Race, ethnicity, and origin ACS 2023
- Neighborhood character
- Predominantly White (93%)
- Race & ethnicity
- White 93% Two or more races 4% Hispanic / Latino 2%
- Common ancestry
- Romanian 8% Iranian 5% Lithuanian 4%
- Foreign-born
- 1% · Canada
- Languages at home
- 97% English-only · Spanish 1% Other Asian/Pacific 1%
Political lean MEDSL · Charlevoix
- 2024 margin
- R (+16.9) · D 40.8% · R 57.7% · Other 1.6%
- 2008→2024 swing
- -13.5pp toward R · 2008: -3.4pp · 2024: -16.9pp
- All cycles
- 2024: R+16.9 2020: R+17.1 2016: R+24.3 2012: R+14.7 2008: R+3.4
Not yet ingested
- Civics
- —
Market trends
- HPI YoY
- ▼ -226.32%
- Current HPI
- 281.0628
- Rent YoY
- —
- Metro
- —
- State GDP YoY
- ▲ 1.37%
- F500 in state
- 28
Industry mix (Fortune 500 HQ in MI)
| Industry | F500 HQs | Revenue |
|---|---|---|
| Automotive Parts | 3 | $48B |
|
||
| Automotive | 2 | $372B |
|
||
| Chemicals | 1 | $45B |
|
||
| Automotive Retail | 1 | $29B |
|
||
| Healthcare / Medical Devices | 1 | $23B |
|
||
| Automotive Technology | 1 | $20B |
|
||
Cash-flow waterfall
monthlySold comps — $/sqft
last 12 mo · ≤1 miLoading sold comps…