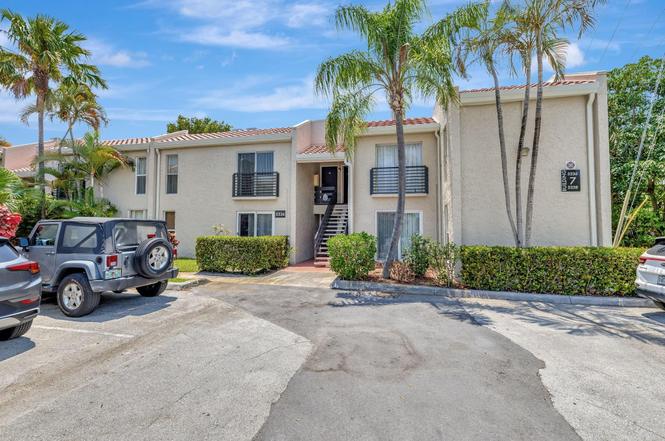
5336 NE 6th Ave Unit H7 · Oakland Park, FL
Flood risk 4/10 · Minor
- FEMA flood zone
- X (shaded)
- Chance of flooding over 30 yrs
- 0.21%
- Est. flood insurance / yr
- $507 – $1,088
Fire risk 1/10 · Minimal
- Est. fire insurance / yr
- $947 – $1,759
Heat risk 10/10 · Severe
- Hot days now (above 106°F)
- 7 days/yr
- Hot days in 30 yrs
- 26 days/yr
Wind risk 10/10 · Severe
- Chance of severe wind over 30 yrs
- 99.0%
Air-quality risk 2/10 · Minimal
- Unhealthy air days now
- 1 days/yr
- Unhealthy air days in 30 yrs
- 2 days/yr
Risk factors via First Street. Map © Google.
Why this score? — see what drove the B- grade
The composite is a weighted blend of 9 inputs, each scored 0–100. Each bar is that input's sub-score; the figure is the points it added to the 100-point composite (weight × sub-score).
- Cash flow +27.3/30.0
- 1% rule +10.0/10.0
- DSCR +9.5/10.0
- ARV discount +7.5/15.0
- Schools +4.1/10.0
- Livability +3.9/5.0
- Rent growth +3.0/5.0
- Condition / age +2.5/5.0
- Appreciation +0.0/10.0
$205,000
🖨 Deal sheet 📄 Offer letter ✓ Due diligence
Listing remarks
Beautifully UPDATED, Light & Bright 2nd FLOOR CORNER UNIT in desirable East Ft. Lauderdale! This spacious condo offers a split bedroom plan with matching neutral tile floors throughout. The remodeled open-concept kitchen features wood cabinetry and stainless appliances, perfect for everyday living and entertaining. The primary bathroom has been enlarged and upgraded with a walk-in shower, while the second bath boasts an updated design with tub. Relax on the lovely screened-in porch and capture breathtaking west-facing sunsets. Additional conveniences include in-unit washer & dryer, 24-hour manned gated security, and small pets under 20 lbs. are always welcome. Ideally located cl
Key facts
- Screened-in porch
- Walk-in shower
- $880 HOA
Tags
Property features AI
Finance
- Financial info: Pets allowed (number and size limits apply)
- HOA & community: HOA with amenities including clubhouse, fitness center, parking, pool, security, and maintenance; Monthly HOA fee; HOA covers insurance, grounds maintenance, sewer, trash, water, roof repairs, and pool service
Exterior
- Parking: Assigned parking; Guest parking; 1 open parking space (1 total)
- Security: Security guard; Security patrol; Security fence; Smoke detectors
- Utilities: Public water; Public sewer; Cable available
- Home design: Condominium; Resale property; 2 stories; Second-floor entry; Faces north
- Construction: Built with CBS and other materials; Other roof
- Exterior features: Screened porch; Fenced; Not waterfront; West of US-1 road frontage
Interior
- Kitchen: Disposal; Dishwasher; Electric range; Microwave; Refrigerator
- Bedrooms: 3 bedrooms (main level / stacked)
- Flooring: Tile
- Bathrooms: 2 full bathrooms (main level)
- Heating & cooling: Central heating; Central air conditioning
- Interior features: Stacked bedroom layout; Blinds; Unfurnished
- Laundry & utility: In-unit laundry; Electric water heater
Neighborhood map
What this means for you Summary
Snapshot
- This is a 3-bed/2.0-bath condo listed at $205k.
Deal economics
- At list price, monthly cash flow is $596 ($7k/yr) — positive.
- The deal already cash-flows at list — no discount required.
- Meets the 1% rule at list price ($4k rent vs $205k).
- Recommended offer: $187k (9.0% below list) — sets the bar for market timing.
- Cap rate 9.8% vs local median 3.8% in Oakland Park — top-decile yield for the area; either an underpriced asset or a hidden risk that comps aren't pricing in. Stress-test before assuming the spread holds.
Location & tenants
- Location reads 77/100 on livability (#193 in FL, #3,082 nationally) — a middle-class / working-renter tenant base. Strengths: commute A+, housing A+, health & safety A+; Watch: amenities F.
- Broward (suburban): math 42% / reading 53% proficiency, ranked #46 of 73 in FL (top 63%) — families likely to look elsewhere, expect single-tenant / working-renter base with shorter leases.
- Zoned schools: North Andrews Gardens Elementary School (math 40% / reading 48%, grade F, #1,330 of 2,144 statewide, top 63%, 780 students, 77% FRL); James S. Rickards Middle School (math 18% / reading 31%, grade F, #522 of 571 statewide, top 93%, 755 students, 75% FRL); Northeast High School (math 12% / reading 37%, grade F, #505 of 667 statewide, top 79%, 1,552 students, 69% FRL) — zoned schools average 74% FRL vs 51% district-wide (23 pts higher); higher-poverty schools than district average — tighter screening recommended.
- Zoned-school proficiency averages 31% at this address vs 48% district-wide (-16 pts) — the specific schools serving this property underperform the Broward average; the district grade overstates school quality for this exact location.
- Market conditions: Rents rising (+2.0%/yr); 355 active listings in the ZIP; 37 comparable units currently listed for rent nearby; rentals at typical pace (median 24d on market — plan ~3-4 weeks tenant-placement turnaround); solid renter incomes; 2,111 units permitted in Broward County in 2024 (1,265 in 5+ unit buildings).
Forward outlook
- Local home prices are declining (-3.0%/yr); year-one equity from $1k of loan paydown is wiped out by about $6k of value loss. Plan a longer hold.
- Broward County population projected at +34% by 2050 — long-run rental-demand tailwind backs the buy-and-hold thesis.
Negotiation context
- It's been on market 99 days — a 9% lower offer ($187k) is reasonable based on typical stale-listing flexibility.
- 2 sale attempts with the ask held roughly flat each time — persistent listings suggest the price (not the market) is what's stuck; bring a comps-based counter.
- Current owner paid $69k; list at $205k implies a 197% gain — meaningful room to come down on a strong offer.
Risks & watch-outs
- Watch-outs: HOA is 25% of rent.
- Climate carrying-cost: severe wind risk, 99% chance of damaging wind over 30y; extreme-heat days projected 7→26/yr by 2055 (HVAC capex compounding) — expect insurance premiums to compound above CPI over the hold.
Questions for the listing agent
- It's been on market 99 days. Have you received any prior offers? Is the seller open to a 9% concession, seller financing, or rate buy-down credit?
- Built in 1973 — when were the roof, HVAC, electrical panel, plumbing, and water heater last replaced?
- What does the HOA fee cover, when was the last increase, and are there any pending special assessments or reserve-fund shortfalls?
- Any open or pending special assessments — roof, HVAC, plumbing, elevator, façade? What's the per-unit balance and payoff schedule, and is the seller paying it off at close or rolling it to the buyer?
- Why hasn't it sold? Are there any deal-killer items the seller is aware of (foundation, flood, title, zoning, code violations)?
- Is there a deadline driving the sale (1031 exchange, divorce, estate, relocation)? That informs how much negotiation room exists.
- Schools are D-rated, which usually means shorter tenancies and higher turnover. Who's the typical renter profile here, and what's been the actual vacancy rate?
- What's the average days-on-market for RENTAL listings here right now (not sales)? A rising rental-DOM trend means longer vacancies and softer asking-rent achievability than the comps imply.
- What's the recent tenant-quality profile in this submarket — average credit score on applications, eviction rate, late-payment / NSF rate, and stable-employment percentage? A property-management company in the area should have these aggregated.
- How much new apartment / multifamily construction is in the pipeline within 1–3 miles? Heavy new supply (>2% of stock underway) typically softens rents 12–24 months out; light construction supports rent growth.
Investment metrics
- 1% rule
- 1.72% ✓
- Cap rate
- 9.78%
- Cash-on-cash
- 12.46%
- DSCR
- 1.55
- GRM
- 4.8
CMA / ARV
No comps found within radius.
Projected returns pro-forma
-3.0% appreciation · 2.01% rent growth · sell at horizon
- IRR
- 0.8%
- Equity multiple
- 1.03×
- Total profit
- $1,785
- Equity at exit
- $30,566
- IRR
- 9.2%
- Equity multiple
- 1.67×
- Total profit
- $38,582
- Equity at exit
- $17,725
Cash invested: $57,400 (down + closing). Projections, not guarantees.
Landlord ↔ Tenant lean methodology
- Overall (STATE)
- 87 Strongly Landlord-Friendly
- State Florida
- 87 Strongly Landlord-Friendly · R+3
- County
- — inherits STATE
- City
- — inherits STATE
ZIP-level market 33334
- Home prices YoY
- -34.6%
- Rents YoY
- 2.0%
- Active inventory
- 355
- Price-to-rent
- 4.8×
Monthly cashflow live
- Estimated rent
- $3,525 high interval (Pro) →
- Mortgage (P&I)
- −$1,075
- Tax from tax record
- −$149 /mo · $1,784/yr
- Insurance
- −$85
- HOA
- −$880
- Vacancy / Maint / Mgmt
- −$740
- Net cashflow
- $596
Break-even live
UW: 25.0% down · 7.5% · 30yr · 1.5% tax · 5.0% vac · 8.0% maint · 8.0% mgmt
Financing live
Cash to close
- Down payment
- $51,250
- Closing costs
- $6,150
- Reserves months
- —
- Total cash needed
- —
Loan-product check · same deal, 3 products live
Conventional
25% down · 7.5% · 30yr
- Down + closing
- —
- Monthly P&I
- —
- Monthly cashflow
- —
- DSCR
- —
- Eligible?
- —
Personal DTI + credit; lowest rate.
DSCR
20% down · 8.5% · 30yr
- Down + closing
- —
- Monthly P&I
- —
- Monthly cashflow
- —
- DSCR
- —
- Eligible?
- —
No personal income docs; deal must DSCR.
Hard money
10% down · 12.0% · 12mo
- Down + closing
- —
- Monthly P&I
- —
- Monthly cashflow
- —
- DSCR
- —
- Eligible?
- —
Short-term bridge; refi at stabilization.
Rent comps 37 comps
| Address | Beds | Baths | Sqft | Rent | $/sqft | DOM | Units | Dist |
|---|---|---|---|---|---|---|---|---|
| 5157 NE 5th Ave Unit 1 Fort Lauderdale, FL | 3.0 | 2.0 | 1250 | $3,500 | $2.80 | 2d | 1 | 0.15mi |
| 5409 NE 4th Ave Fort Lauderdale, FL | 3.0 | 2.0 | 1178 | $3,200 | $2.72 | 24d | 1 | 0.28mi |
| 4780 NE 8th Ter Oakland Park, FL | 3.0 | 2.0 | 1130 | $4,200 | $3.72 | 24d | 1 | 0.40mi |
| 5655 NE 5th Ter Fort Lauderdale, FL | 3.0 | 2.0 | 1178 | $3,250 | $2.76 | 15d | 1 | 0.42mi |
| 5655 NE 5th Ter Fort Lauderdale, FL | 3.0 | 2.0 | 1178 | $3,250 | $2.76 | 24d | 1 | 0.42mi |
| 4680 NE 5th Ave Fort Lauderdale, FL | 3.0 | 2.0 | 1300 | $3,800 | $2.92 | 7d | 1 | 0.51mi |
| 5365 N Andrews Ave Fort Lauderdale, FL | 3.0 | 2.0 | 1016 | $3,500 | $3.44 | 24d | 1 | 0.60mi |
| 4601 NE 4th Ave Unit 1261561P Fort Lauderdale, FL | 3.0 | 2.0 | 1097 | $4,430 | $4.04 | 24d | 1 | 0.61mi |
| 540 NE 59th Ct Fort Lauderdale, FL | 3.0 | 2.0 | 964 | $3,400 | $3.53 | 24d | 1 | 0.62mi |
| 5841 NE 3rd Ave Fort Lauderdale, FL | 3.0 | 2.0 | 834 | $3,200 | $3.84 | 24d | 1 | 0.62mi |
| 4650 NE 2nd Ave Fort Lauderdale, FL | 3.0 | 2.0 | 1356 | $3,950 | $2.91 | 24d | 1 | 0.64mi |
| 4580 NE 3rd Ave Fort Lauderdale, FL | 3.0 | 2.0 | 1192 | $3,300 | $2.77 | 20d | 1 | 0.65mi |
| 320 NW 51st Ct Fort Lauderdale, FL | 3.0 | 2.0 | 1396 | $3,500 | $2.51 | 24d | 1 | 0.73mi |
| 261 NE 45th St Fort Lauderdale, FL | 3.0 | 2.0 | 997 | $3,247 | $3.26 | 24d | 1 | 0.74mi |
| 240 NW 48th Ct Fort Lauderdale, FL | 3.0 | 2.0 | 1240 | $3,100 | $2.50 | 3d | 1 | 0.75mi |
| 4511 NE 13th Ave Oakland Park, FL | 3.0 | 3.0 | 1416 | $4,300 | $3.04 | 24d | 1 | 0.75mi |
| 4511 NE 13th Ave Oakland Park, FL | 3.0 | 3.0 | 1416 | $4,300 | $3.04 | 3d | 1 | 0.75mi |
| 4511 NE 13th Ave Oakland Park, FL | 2.0 | 2.0 | 1400 | $3,200 | $2.29 | 7d | 1 | 0.75mi |
| 540 NE 61st Ct Fort Lauderdale, FL | 3.0 | 2.0 | 1272 | $3,395 | $2.67 | 2d | 1 | 0.79mi |
| 4764 NE 15th Way Oakland Park, FL | 3.0 | 2.0 | 1218 | $3,500 | $2.87 | 24d | 1 | 0.87mi |
| 1575 NE 47th St Oakland Park, FL | 3.0 | 2.0 | 1358 | $3,700 | $2.72 | 24d | 1 | 0.89mi |
| 4360 NE 13th Ave Oakland Park, FL | 3.0 | 2.0 | 1269 | $3,700 | $2.92 | 24d | 1 | 0.91mi |
| 4360 NE 13th Ave Oakland Park, FL | 3.0 | 2.0 | 1459 | $3,700 | $2.54 | 5d | 1 | 0.91mi |
| 4360 NE 13th Ave Unit Main Oakland Park, FL | 3.0 | 2.0 | 1269 | $4,500 | $3.55 | 21d | 1 | 0.91mi |
| 351 NE 41st St Oakland Park, FL | 2.0 | 1.0 | 900 | $3,400 | $3.78 | 24d | 1 | 1.00mi |
| 5770 NE 18th Ave Fort Lauderdale, FL | 4.0 | 2.0 | 1459 | $7,500 | $5.14 | 13d | 1 | 1.08mi |
| 1421 NE 41st St Oakland Park, FL | 2.0 | 2.0 | 1366 | $4,000 | $2.93 | 24d | 1 | 1.09mi |
| 6500 N Andrews Ave Fort Lauderdale, FL | 2.0 | 1.0–2.0 | 943 | $3,146 | $3.34 | 2d | 31 | 1.11mi |
| 3801 Dixie Hwy Oakland Park, FL | 2.0 | 1.0–2.0 | 944 | $3,584 | $3.80 | 14d | 45 | 1.28mi |
| 3781 NE 13th Ave Oakland Park, FL | 2.0 | 1.0 | 869 | $3,900 | $4.49 | 24d | 1 | 1.34mi |
| 1740 NE 64th St Fort Lauderdale, FL | 3.0 | 2.0 | 1364 | $4,800 | $3.52 | 3d | 1 | 1.37mi |
| 1740 NE 64th St Fort Lauderdale, FL | 3.0 | 2.0 | 1364 | $4,800 | $3.52 | 10d | 1 | 1.37mi |
| 2155 NE 56th Ct Fort Lauderdale, FL | 3.0 | 2.0 | 1500 | $3,500 | $2.33 | 24d | 1 | 1.42mi |
| 2100 NE 45th St #1 Fort Lauderdale, FL | 3.0 | 3.5 | 1340 | $9,500 | $7.09 | 24d | 1 | 1.42mi |
| 331 NW 38th St Oakland Park, FL | 2.0 | 1.5 | 1040 | $3,900 | $3.75 | 7d | 1 | 1.44mi |
| 331 NW 38th St Oakland Park, FL | 2.0 | 1.5 | 1040 | $3,900 | $3.75 | 16d | 1 | 1.44mi |
| 4804 NE 21st Ave #4804 Fort Lauderdale, FL | 2.0 | 2.0 | 1400 | $4,500 | $3.21 | 24d | 1 | 1.46mi |
HOA detail condo
- Monthly dues
- $880 · $10,560/yr
- Likely covers
- security
- Assessments
- None detected in remarks — confirm with the listing agent.
Listing history 19 events
-
2026-06-18days on market $205,000 Active 99 DOM
-
2026-06-17days on market $205,000 Active 98 DOM
-
2026-06-16days on market $205,000 Active 97 DOM
-
2026-06-15days on market $205,000 Active 96 DOM
-
2026-06-13days on market $205,000 Active 94 DOM
-
2026-06-09days on market $205,000 Active 90 DOM
-
2026-06-07days on market $205,000 Active 88 DOM
-
2026-06-04days on market $205,000 Active 85 DOM
-
2026-06-03days on market $205,000 Active 84 DOM
-
2026-06-02days on market $205,000 Active 83 DOM
-
2026-06-01days on market $205,000 Active 82 DOM
-
2026-05-31days on market $205,000 Active 81 DOM
-
2026-04-16price $205,000
-
2026-04-15status Active
-
2026-03-21historical Active Under Contract
-
2025-10-02$215,000 Active
-
2014-08-18soldstatus $69,000
-
2005-07-20soldstatus $130,000
-
1986-01-01soldstatus $62,900
ⓘ Source: listings_history table (triggers on properties + properties_extension) + one-shot
backfill from property_details.listing_events for pre-trigger history.
Tax reassessment forecast FL · Resets to sale price
- Current annual tax
- $1,784 · $149/mo
- Projected year-2 tax
- $1,784 · $149/mo
- Expected delta
- $0/yr ($0/mo · 0.0%)
ⓘ Screening estimate from a state-policy table — verify with the county assessor before closing.
Climate risk First Street
- Flood 4/10 Moderate FEMA zone X (shaded) · 21% chance over 30 yrs
- Wildfire 1/10 Low
- Heat 10/10 Extreme 7 d/yr ≥106°F today · 26 d/yr by 30 yrs out
- Wind 10/10 Extreme 99% chance of damaging wind over 30 yrs
- Air quality 2/10 Low 1 unhealthy d/yr today · 2 by 30 yrs out
Nearby sold comps map
Loading sold comps map…
Walkable amenities ~0.75 mi
Loading nearby amenities…
Taxation est. · year 1
- Rental income
- $42,304
- − Mortgage interest
- −$11,483
- − Property taxes
- −$1,784
- − Insurance
- −$1,025
- − Repairs & maintenance
- −$3,384
- − Management
- −$3,384
- − HOA
- −$10,560
- − Depreciation
- −$5,964
- Taxable income
- $4,720
- Est. tax owed @ 24.0%
- −$1,133
- After-tax cash flow
- $6,018/yr
For passive investors: Depreciation is non-cash, so a rental often shows a tax loss while cash-flowing — sheltering income. Rental losses are passive: they offset passive income freely, and up to $25,000/yr can offset ordinary (W-2) income if you actively participate and your MAGI is under $100k (phasing out to $0 by $150k); unused losses carry forward. On sale, claimed depreciation is recaptured at up to 25%, and gains may owe capital-gains tax (a 1031 exchange can defer both). Figures are a year-1 estimate at your 24.0% rate — not tax advice; consult a CPA.
Schools (NCES district)
- District
- Broward
- NCES district ID
- 1200180
- Math proficiency
- 42% ▼ -18.00%
- Reading proficiency
- 53% ▼ -5.00%
- Median HH income
- $52,139
- Composite
- 40.88/100
- National rank
- #3621
- State rank
- #46 of 73 in FL
Livability — Oakland Park
- Score
- 77/100
- State rank
- #193
- US rank
- #3082
Category grades
Schools grade is shown separately in the Schools card above.
Census & demographics
- Census place
- Oakland Park, FL
- County
- Broward County · 1,963,430 people
- City population
- 68,410
- Metro
- Miami-Fort Lauderdale-Pompano Beach, FL
- Population (ZIP)
- 30,935
- Household income
- $75,361
- Rent vs Own
- Severe rent burden
- 1755.0
Population outlook (Broward County) Hauer SSP2
- Today (2025)
- 2,207,033 people
- By 2030
- 2,360,704 · +7.0%
- By 2040
- 2,661,208 · +20.6%
- By 2050
- 2,946,698 · +33.5%
- By 2075
- 3,602,273 · +63.2%
- By 2100
- 3,970,984 · +79.9%
Race, ethnicity, and origin ACS 2023
- Neighborhood character
- Diverse neighborhood (Simpson 0.68)
- Race & ethnicity
- White 43% Hispanic / Latino 32% Two or more races 25% Black 17% Asian 2%
- Hispanic origin (detail)
- Mexican 2% Puerto Rican 4% Cuban 4%
- Common ancestry
- Hispanic 5% Lithuanian 3% Romanian 2%
- Foreign-born
- 31% · Canada, Jamaica, Vietnam
- Languages at home
- 59% English-only · Spanish 28% Other Indo-European 5% French/Haitian/Cajun 5%
Political lean MEDSL · Broward
- 2024 margin
- D (+17.0) · D 58.0% · R 41.0%
- 2008→2024 swing
- -17.8pp toward R · 2008: 34.7pp · 2024: 17.0pp
- All cycles
- 2024: D+17.0 2020: D+29.8 2016: D+35.0 2012: D+34.9 2008: D+34.7
Not yet ingested
- Civics
- —
Market trends
- HPI YoY
- ▼ -208.58%
- Current HPI
- 394.9526
- Rent YoY
- ▲ 2.01%
- Metro
- Miami-Fort Lauderdale-Pompano Beach, FL
- State GDP YoY
- ▲ 3.28%
- F500 in state
- 36
Industry mix (Fortune 500 HQ in FL)
| Industry | F500 HQs | Revenue |
|---|---|---|
| Industrial Technology | 2 | $29B |
|
||
| Insurance | 2 | $17B |
|
||
| Retail | 1 | $60B |
|
||
| Technology Distribution | 1 | $58B |
|
||
| Homebuilding | 1 | $35B |
|
||
| Technology Manufacturing | 1 | $35B |
|
||
Price history
+225.9% since first listed7 events — show timeline
- 2026-04-16 Price Changed $205,000 Beaches MLS
- 2026-04-15 Relisted — Beaches MLS
- 2026-03-21 Contingent — Beaches MLS
- 2025-10-02 Listed $215,000 Beaches MLS
- 2014-08-18 Sold (Public Records) $69,000 Public Records
- 2005-07-20 Sold (Public Records) $130,000 Public Records
- 1986-01-01 Sold (Public Records) $62,900 Public Records
Property tax history
+1.8%/yrLatest (2025): $1,784 · +3.2% YoY. Source: county tax records.
Cash-flow waterfall
monthlySold comps — $/sqft
last 12 mo · ≤1 miLoading sold comps…