44144 W Cypress Ln · Maricopa, AZ
Flood risk 4/10 · Minor
- FEMA flood zone
- X
- Chance of flooding over 30 yrs
- 0.22%
- Est. flood insurance / yr
- $507 – $1,088
Fire risk 6/10 · Moderate
- Est. fire insurance / yr
- $610 – $1,132
Heat risk 9/10 · Severe
- Hot days now (above 114°F)
- 7 days/yr
- Hot days in 30 yrs
- 18 days/yr
Wind risk 1/10 · Minimal
- Chance of severe wind over 30 yrs
- —
Air-quality risk 2/10 · Minimal
- Unhealthy air days now
- 1 days/yr
- Unhealthy air days in 30 yrs
- 1 days/yr
Risk factors via First Street. Map © Google.
Why this score? — see what drove the D+ grade
The composite is a weighted blend of 9 inputs, each scored 0–100. Each bar is that input's sub-score; the figure is the points it added to the 100-point composite (weight × sub-score).
- ARV discount +14.8/15.0
- Cash flow +10.8/30.0
- Appreciation +4.6/10.0
- Livability +3.6/5.0
- DSCR +3.1/10.0
- Rent growth +2.9/5.0
- 1% rule +2.8/10.0
- Condition / age +2.5/5.0
- Schools +2.3/10.0
$250,400
🖨 Deal sheet 📄 Offer letter ✓ Due diligence
Listing remarks MLS
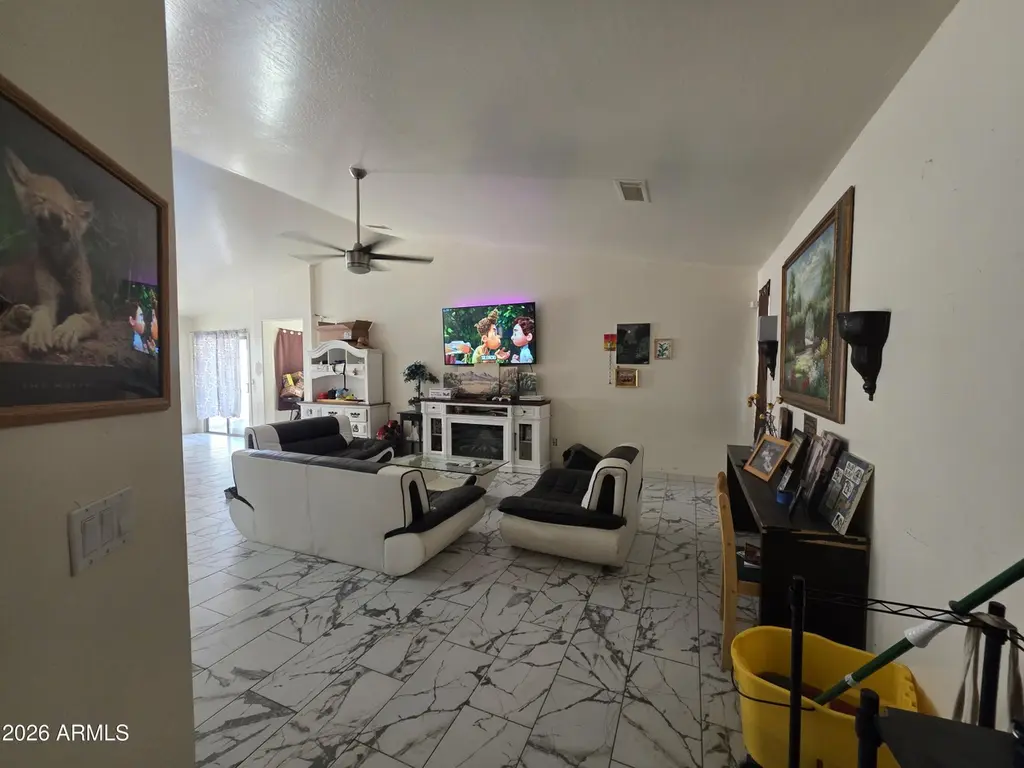
Come check out this perfect family home located in a quiet Maricopa neighborhood within just minutes of multiple schools, shopping centers, Ak-Chin Resort and Casino, and the Copper Sky Recreation Park. BRAND NEW Wood-like laminate and tile run throughout the home and with 3 bedrooms, 2 bathrooms, 1,572 sq ft, and a large backyard, it is perfect for the whole family. House is priced to sell so don't miss your opportunity to make this house your home!
Key facts
- 5,401 sq ft lot
- 2 garage spots
- Built 2005
Property features AI
Finance
- Other: Community amenities include playground and biking/walking path
- Financial info: Current financing options noted: FHA and assumable (no qualify)
- HOA & community: Homeowners association with quarterly fee (maintenance of grounds) reported; Association fee charged quarterly
Exterior
- Parking: 2 covered parking spaces; 2 open parking spaces; 2-car garage
- Utilities: City water; Public sewer; 220-volt supply to kitchen
- Home design: Single-family residence; Fee simple ownership; Property listed as fixer condition
- Construction: Stucco and wood frame construction; Painted exterior; Tile roof
- Exterior features: Block fencing; Dirt in back yard; Gravel/stone in front yard; City-maintained road access
Interior
- Kitchen: 220-volt outlet in kitchen; Laminate counters; Pantry; Disposal
- Bedrooms: Up to 4 bedrooms
- Flooring: Laminate flooring; Tile flooring
- Bathrooms: 2 full bathrooms
- Heating & cooling: Electric heating; Central air conditioning
- Interior features: Breakfast bar; Vaulted ceilings; Pantry; 3/4 bath in primary bedroom; Laminate counters; Disposal
- Laundry & utility: Indoor laundry with washer/dryer hookups
Neighborhood map
What this means for you Summary
Snapshot
- This is a 3-bed/2.0-bath single-family listed at $250k.
Deal economics
- At list price, monthly cash flow is $-115 ($-1k/yr) — negative.
- To cash-flow at today's rent, offer at most $230k (8.1% below list).
- To meet the 1% rule (rent ≥ 1% of price), the offer needs to be $194k (22.4% below list).
- Recommended offer: $194k (22.4% below list) — sets the bar for 1% rule.
- Cap rate 5.7% vs local median 3.7% in Maricopa — top-decile yield for the area; either an underpriced asset or a hidden risk that comps aren't pricing in. Stress-test before assuming the spread holds.
Location & tenants
- Location reads 72/100 on livability (#28 in AZ) — a middle-class / working-renter tenant base. Strengths: housing A+, employment A-, crime B+; Watch: amenities F, commute F, health & safety F.
- Maricopa Unified School District (4441) (town): math 20% / reading 29% proficiency, ranked #128 of 249 in AZ (top 51%) — low school quality limits family demand, transient renter base, plan for 1-2y turnover.
- Zoned schools: Saddleback Elementary School (math 24% / reading 33%, grade F, #580 of 1,109 statewide, top 53%, 795 students, 56% FRL); Maricopa Wells Middle School (math 13% / reading 23%, grade F, #143 of 218 statewide, top 66%, 934 students, 57% FRL); Maricopa High School (math 12% / reading 19%, grade F, #262 of 381 statewide, top 69%, 2,188 students, 46% FRL).
- Market conditions: Rents rising (+1.8%/yr); 845 active listings in the ZIP; 40 comparable units currently listed for rent nearby; rentals at typical pace (median 25d on market — plan ~3-4 weeks tenant-placement turnaround); 40% of comp listings sitting > 30 days — soft ceiling on asking rent; solid renter incomes; 9,504 units permitted in Pinal County in 2024 (776 in 5+ unit buildings).
Forward outlook
- Local home prices are declining (-0.9%/yr); year-one equity from $2k of loan paydown is wiped out by about $2k of value loss. Plan a longer hold.
Negotiation context
- Only 8 days on market — expect competitive offers; lowballing is unlikely to land.
- 4 sale attempts since 7y ago with the ask held roughly flat each time — persistent listings suggest the price (not the market) is what's stuck; bring a comps-based counter.
- Current owner paid $185k; 35% above their basis — modest negotiation headroom, anchor on the comps not their cost.
Risks & watch-outs
- Climate carrying-cost: major wildfire risk; extreme-heat days projected 7→18/yr by 2055 (HVAC capex compounding) — expect insurance premiums to compound above CPI over the hold.
Questions for the listing agent
- What do current leases actually rent for vs. the listed asking? Can we see a recent rent roll and the last 12 months of T-12 income?
- What does the HOA fee cover, when was the last increase, and are there any pending special assessments or reserve-fund shortfalls?
- Is there a deadline driving the sale (1031 exchange, divorce, estate, relocation)? That informs how much negotiation room exists.
- Schools are B-rated — typically a magnet for longer-tenancy family renters. What's the average tenant stay here, and is there a school-zone premium baked into asking?
- The area grade is low — what's the realistic commute time and amenity access for the typical tenant pool here? Any planned neighborhood developments (good or bad) we should know about?
- What's the average days-on-market for RENTAL listings here right now (not sales)? A rising rental-DOM trend means longer vacancies and softer asking-rent achievability than the comps imply.
- What's the recent tenant-quality profile in this submarket — average credit score on applications, eviction rate, late-payment / NSF rate, and stable-employment percentage? A property-management company in the area should have these aggregated.
- How much new for-sale + rental construction is in the pipeline within 1–3 miles? Heavy new supply typically softens prices + rents 12–24 months out; constrained supply supports both.
Investment metrics
- 1% rule
- 0.78% ✗
- Cap rate
- 5.74%
- Cash-on-cash
- -1.97%
- DSCR
- 0.91
- GRM
- 10.7
CMA / ARV
- ARV (on-the-fly)
- $298,680
- Comps found
- 12
Show comp detail 12 sales within ~0.75 mi
| Address | Dist | Beds/Ba | Sqft | Sold | Price | $/sf | Match |
|---|---|---|---|---|---|---|---|
| 44357 W Cypress Ln | 0.15mi | 3/2.0 | 1,573 (+0%) | 1mo | $310,000 | $197 | 92 |
| 44441 W Cypress Ln | 0.20mi | 4/2.0 (+1) | 1,573 (+0%) | 9mo | $299,000 | $190 | 78 |
| 43871 W Cowpath Rd | 0.58mi | 3/2.0 | 1,509 (-4%) | 3mo | $260,000 | $172 | 64 |
| 44781 W Zion Rd | 0.42mi | 3/2.0 | 1,445 (-8%) | 9mo | $325,000 | $225 | 60 |
| 43909 W Arizona Ave | 0.73mi | 3/2.0 | 1,509 (-4%) | 2mo | $190,500 | $126 | 58 |
| 18552 N Ibis Way | 0.74mi | 3/2.0 | 1,509 (-4%) | 3mo | $306,000 | $203 | 56 |
| 45085 W Mescal St | 0.60mi | 3/2.0 | 1,413 (-10%) | 1mo | $290,000 | $205 | 54 |
| 43171 W Cowpath Rd | 0.65mi | 4/2.0 (+1) | 1,534 (-2%) | 10mo | $225,000 | $147 | 53 |
| 45085 W Windrose Dr | 0.61mi | 3/2.0 | 1,413 (-10%) | 4mo | $285,000 | $202 | 51 |
| 45084 W Desert Cedars Ln | 0.64mi | 3/2.0 | 1,753 (+12%) | 7mo | $305,000 | $174 | 45 |
| 18930 N Dallas Smith Ln | 0.72mi | 3/2.0 | 1,725 (+10%) | 6mo | $235,000 | $136 | 45 |
| 45070 W Windrose Dr | 0.61mi | 3/2.0 | 1,753 (+12%) | 9mo | $260,000 | $148 | 45 |
Match score weights: distance 35% · size 25% · config 20% · recency 20%. Top-matched comps best support the ARV.
Projected returns pro-forma
-0.89% appreciation · 1.78% rent growth · sell at horizon
- IRR
- -9.0%
- Equity multiple
- 0.61×
- Total profit
- $-27,287
- Equity at exit
- $61,796
- IRR
- -3.3%
- Equity multiple
- 0.70×
- Total profit
- $-21,001
- Equity at exit
- $66,050
Cash invested: $70,112 (down + closing). Projections, not guarantees.
Landlord ↔ Tenant lean methodology
- Overall (STATE)
- 87 Strongly Landlord-Friendly
- State Arizona
- 87 Strongly Landlord-Friendly · R+3
- County
- — inherits STATE
- City
- — inherits STATE
ZIP-level market 85138
- Home prices YoY
- -0.3%
- Rents YoY
- 1.8%
- Active inventory
- 845
- Price-to-rent
- 10.7×
Monthly cashflow live
- Estimated rent
- $1,943 high interval (Pro) →
- Mortgage (P&I)
- −$1,313
- Tax from tax record
- −$141 /mo · $1,688/yr
- Insurance
- −$104
- HOA
- −$92
- Vacancy / Maint / Mgmt
- −$408
- Net cashflow
- $-115
Break-even live
UW: 25.0% down · 7.5% · 30yr · 1.5% tax · 5.0% vac · 8.0% maint · 8.0% mgmt
Financing live
Cash to close
- Down payment
- $62,600
- Closing costs
- $7,512
- Reserves months
- —
- Total cash needed
- —
Loan-product check · same deal, 3 products live
Conventional
25% down · 7.5% · 30yr
- Down + closing
- —
- Monthly P&I
- —
- Monthly cashflow
- —
- DSCR
- —
- Eligible?
- —
Personal DTI + credit; lowest rate.
DSCR
20% down · 8.5% · 30yr
- Down + closing
- —
- Monthly P&I
- —
- Monthly cashflow
- —
- DSCR
- —
- Eligible?
- —
No personal income docs; deal must DSCR.
Hard money
10% down · 12.0% · 12mo
- Down + closing
- —
- Monthly P&I
- —
- Monthly cashflow
- —
- DSCR
- —
- Eligible?
- —
Short-term bridge; refi at stabilization.
Rent comps 40 comps
| Address | Beds | Baths | Sqft | Rent | $/sqft | DOM | Units | Dist |
|---|---|---|---|---|---|---|---|---|
| 43814 W Cypress Ln Maricopa, AZ | 4.0 | 2.0 | 2170 | $2,095 | $0.97 | 44d | 1 | 0.21mi |
| 43760 W Cypress Ln Maricopa, AZ | 4.0 | 2.0 | 2142 | $2,000 | $0.93 | 44d | 1 | 0.24mi |
| 44928 W Zion Rd Maricopa, AZ | 3.0 | 2.5 | 1875 | $1,950 | $1.04 | 44d | 1 | 0.49mi |
| 44900 W Bowlin Rd Maricopa, AZ | 1.0–3.0 | 1.0–2.0 | 1015 | $2,320 | $2.28 | 1d | 1 | 0.50mi |
| 18283 N Presley Ln Maricopa, AZ | 3.0 | 2.5 | 2156 | $2,000 | $0.93 | 24d | 1 | 0.53mi |
| 44170 W Honeycutt Ave Maricopa, AZ | 1.0–3.0 | 1.0–2.0 | 913 | $1,450 | $1.59 | 1d | 1 | 0.62mi |
| 43361 W Elizabeth Ave Maricopa, AZ | 3.0 | 2.0 | 1509 | $1,795 | $1.19 | 24d | 1 | 0.62mi |
| 43811 W Elizabeth Ave Maricopa, AZ | 3.0 | 2.0 | 1509 | $1,575 | $1.04 | 24d | 1 | 0.66mi |
| 45129 W Desert Cedars Ln Maricopa, AZ | 4.0 | 2.0 | 1753 | $1,875 | $1.07 | 5d | 1 | 0.66mi |
| 45310 W Norris Rd Maricopa, AZ | 3.0 | 2.0 | 1385 | $1,539 | $1.11 | 2d | 1 | 0.78mi |
| 45310 W Norris Rd Maricopa, AZ | 3.0 | 2.0 | 1385 | $1,649 | $1.19 | 24d | 1 | 0.78mi |
| 43205 W Jeremy St Maricopa, AZ | 3.0 | 2.0 | 1699 | $1,850 | $1.09 | 5d | 1 | 0.79mi |
| 17447 N Marina Ave Maricopa, AZ | 3.0 | 2.0 | 1397 | $1,595 | $1.14 | 24d | 1 | 0.81mi |
| 44000 W Palo Olmo Rd Maricopa, AZ | 3.0 | 2.0 | 1853 | $1,850 | $1.00 | 44d | 1 | 0.86mi |
| 45539 W Sky Ln Maricopa, AZ | 4.0 | 2.0 | 1831 | $1,909 | $1.04 | 3d | 1 | 0.87mi |
| 42725 W Martie Lynn Rd Maricopa, AZ | 3.0 | 2.0 | 1509 | $2,015 | $1.34 | 24d | 1 | 0.87mi |
| 45556 W Tucker Rd Maricopa, AZ | 4.0 | 2.0 | 2152 | $1,795 | $0.83 | 44d | 1 | 0.92mi |
| 45462 W Tulip Ln Maricopa, AZ | 3.0 | 2.0 | 1391 | $1,750 | $1.26 | 44d | 1 | 0.92mi |
| 43269 W Arizona Ave Maricopa, AZ | 4.0 | 2.0 | 1533 | $1,695 | $1.11 | 44d | 1 | 0.92mi |
| 44124 W Palo Cedro Rd Maricopa, AZ | 3.0 | 2.0 | 1619 | $1,595 | $0.99 | 44d | 1 | 0.96mi |
| 19680 N Ortman Cir Maricopa, AZ | 3.0 | 2.0 | 1975 | $1,700 | $0.86 | 3d | 1 | 1.01mi |
| 45779 W Tucker Rd Maricopa, AZ | 4.0 | 2.0 | 1925 | $2,199 | $1.14 | 24d | 1 | 1.05mi |
| 42495 W Monteverde Dr Maricopa, AZ | 3.0 | 2.0 | 1484 | $2,500 | $1.68 | 44d | 1 | 1.08mi |
| 45811 W Amsterdam Rd Maricopa, AZ | 3.0 | 2.0 | 1993 | $1,700 | $0.85 | 44d | 1 | 1.12mi |
| 45967 W Starlight Dr Maricopa, AZ | 3.0 | 2.0 | 1671 | $1,675 | $1.00 | 22d | 1 | 1.15mi |
| 45959 W Ranch Rd Maricopa, AZ | 4.0 | 2.0 | 1605 | $1,709 | $1.06 | 3d | 1 | 1.16mi |
| 42381 W Mira Ct Maricopa, AZ | 3.0 | 2.0 | 1584 | $1,795 | $1.13 | 44d | 1 | 1.19mi |
| 42381 W Mira Ct Maricopa, AZ | 3.0 | 2.0 | 1584 | $1,795 | $1.13 | 24d | 1 | 1.19mi |
| 42584 W Maricopa-Casa Grande Hwy Maricopa, AZ | 2.0–4.0 | 1.0–2.0 | 1140 | $1,723 | $1.51 | 1d | 58 | 1.20mi |
| 43223 W Neely Dr Maricopa, AZ | 4.0 | 2.0 | 2223 | $2,900 | $1.30 | 17d | 1 | 1.21mi |
| 43368 W Palmen Dr Maricopa, AZ | 4.0 | 2.5 | 2200 | $1,889 | $0.86 | 44d | 1 | 1.24mi |
| 42275 W Calle St Maricopa, AZ | 4.0 | 3.0 | 1807 | $2,050 | $1.13 | 3d | 1 | 1.24mi |
| 42275 W Calle St Maricopa, AZ | 4.0 | 3.0 | 1807 | $2,050 | $1.13 | 44d | 1 | 1.24mi |
| 42246 W Balsa Dr Maricopa, AZ | 3.0 | 2.0 | 1585 | $1,679 | $1.06 | 44d | 1 | 1.27mi |
| 18184 N Calacera St Maricopa, AZ | 3.0 | 2.0 | 1603 | $1,795 | $1.12 | 17d | 1 | 1.28mi |
| 46149 W Guilder Ave Maricopa, AZ | 3.0 | 2.0 | 1432 | $1,600 | $1.12 | 4d | 1 | 1.28mi |
| 19165 N Ventana Ln Maricopa, AZ | 3.0 | 2.0 | 1440 | $1,650 | $1.15 | 24d | 1 | 1.32mi |
| 46176 W Amsterdam Rd Maricopa, AZ | 4.0 | 2.0 | 2200 | $1,895 | $0.86 | 44d | 1 | 1.35mi |
| 44456 W Eddie Way Maricopa, AZ | 3.0 | 2.0 | 1679 | $1,695 | $1.01 | 44d | 1 | 1.45mi |
| 42826 W Darter Dr Maricopa, AZ | 2.0 | 2.0 | 1596 | $1,875 | $1.17 | 24d | 1 | 1.45mi |
HOA detail
- Monthly dues
- $92 · $1,104/yr
Listing history 7 events
-
2026-06-18days on market $250,400 Active 8 DOM
-
2026-06-17days on market $250,400 Active 7 DOM
-
2026-06-16days on market $250,400 Active 6 DOM
-
2026-06-15days on market $250,400 Active 5 DOM
-
2026-06-13days on market $250,400 Active 3 DOM
-
2026-06-13remarks 325-char remark
-
2026-06-13$250,400 Active 2 DOM
ⓘ Source: listings_history table (triggers on properties + properties_extension) + one-shot
backfill from property_details.listing_events for pre-trigger history.
Tax reassessment forecast AZ · Resets to sale price
- Current annual tax
- $1,688 · $141/mo
- Projected year-2 tax
- $1,688 · $141/mo
- Expected delta
- $0/yr ($0/mo · 0.0%)
ⓘ Screening estimate from a state-policy table — verify with the county assessor before closing.
Climate risk First Street
- Flood 4/10 Moderate FEMA zone X · 22% chance over 30 yrs
- Wildfire 6/10 Major
- Heat 9/10 Extreme 7 d/yr ≥114°F today · 18 d/yr by 30 yrs out
- Wind 1/10 Low
- Air quality 2/10 Low 1 unhealthy d/yr today · 1 by 30 yrs out
Nearby sold comps map
Loading sold comps map…
Walkable amenities ~0.75 mi
Loading nearby amenities…
Taxation est. · year 1
- Rental income
- $23,318
- − Mortgage interest
- −$14,026
- − Property taxes
- −$1,688
- − Insurance
- −$1,252
- − Repairs & maintenance
- −$1,865
- − Management
- −$1,865
- − HOA
- −$1,104
- − Depreciation
- −$7,284
- Taxable loss
- −$5,768
- Est. tax savings @ 24.0%
- +$1,384
- After-tax cash flow
- $4/yr
For passive investors: Depreciation is non-cash, so a rental often shows a tax loss while cash-flowing — sheltering income. Rental losses are passive: they offset passive income freely, and up to $25,000/yr can offset ordinary (W-2) income if you actively participate and your MAGI is under $100k (phasing out to $0 by $150k); unused losses carry forward. On sale, claimed depreciation is recaptured at up to 25%, and gains may owe capital-gains tax (a 1031 exchange can defer both). Figures are a year-1 estimate at your 24.0% rate — not tax advice; consult a CPA.
Schools (NCES district)
- District
- Maricopa Unified School District (4441)
- NCES district ID
- 0404720
- Math proficiency
- 20% ▼ -18.00%
- Reading proficiency
- 29% ▼ -9.00%
- Median HH income
- $63,725
- Composite
- 22.92/100
- National rank
- #7993
- State rank
- #128 of 249 in AZ
Livability — Maricopa
- Score
- 72/100
- State rank
- #28
- US rank
- #5943
Category grades
Schools grade is shown separately in the Schools card above.
Census & demographics
- Census place
- Maricopa, AZ
- County
- Pinal County · 399,947 people
- City population
- 76,044
- Metro
- Phoenix-Mesa-Chandler, AZ
- Population (ZIP)
- 55,260
- Household income
- $95,867
- Rent vs Own
- Severe rent burden
- 432.0
Population outlook (Pinal County) Hauer SSP2
- Today (2025)
- 437,574 people
- By 2030
- 446,903 · +2.1%
- By 2040
- 452,589 · +3.4%
- By 2050
- 444,126 · +1.5%
- By 2075
- 430,300 · -1.7%
- By 2100
- 393,536 · -10.1%
Race, ethnicity, and origin ACS 2023
- Neighborhood character
- Diverse neighborhood (Simpson 0.69)
- Race & ethnicity
- White 45% Hispanic / Latino 30% Two or more races 17% Black 13% Native American 3% Asian 3% Pacific Islander 1%
- Hispanic origin (detail)
- Mexican 26% Puerto Rican 1%
- Common ancestry
- Lithuanian 2% Romanian 2% Italian 2%
- Foreign-born
- 10% · Canada
- Languages at home
- 79% English-only · Spanish 16% Other Asian/Pacific 1% Other Indo-European 1%
Political lean MEDSL · Pinal
- 2024 margin
- Strong R (+22.1) · D 38.5% · R 60.6%
- 2008→2024 swing
- -7.6pp toward R · 2008: -14.5pp · 2024: -22.1pp
- All cycles
- 2024: R+22.1 2020: R+17.3 2016: R+19.3 2012: R+17.1 2008: R+14.5
Not yet ingested
- Civics
- —
Market trends
- HPI YoY
- ▼ -0.89%
- Current HPI
- 258.1461
- Rent YoY
- ▲ 1.78%
- Metro
- Phoenix-Mesa-Chandler, AZ
- State GDP YoY
- ▲ 4.54%
- F500 in state
- 20
Industry mix (Fortune 500 HQ in AZ)
| Industry | F500 HQs | Revenue |
|---|---|---|
| Technology | 2 | $13B |
|
||
| Mining / Metals | 1 | $23B |
|
||
| Environmental Services | 1 | $16B |
|
||
| Metals / Steel | 1 | $14B |
|
||
| Technology Distribution | 1 | $9B |
|
||
| Homebuilding | 1 | $8B |
|
||
Price history
-93.3% since first listed11 events — show timeline
- 2026-06-10 Listed $250,400 ARMLS
- 2023-12-24 Listing Removed — ARMLS
- 2023-12-15 Listed $315,000 ARMLS
- 2019-10-28 Sold (Public Records) $185,000 Public Records
- 2019-10-28 Sold (MLS) $185,000 ARMLS
- 2019-10-23 Pending — ARMLS
- 2019-10-23 Listed $184,800 ARMLS
- 2019-10-22 Sold (MLS) $185,000 ARMLS
- 2019-09-13 Pending — ARMLS
- 2019-09-06 Listed $184,800 ARMLS
- 2004-02-03 Sold (Public Records) $3,738,900 Public Records
Property tax history
-0.9%/yrLatest (2025): $1,688 · +3.6% YoY. Source: county tax records.
Cash-flow waterfall
monthlySold comps — $/sqft
last 12 mo · ≤1 miLoading sold comps…