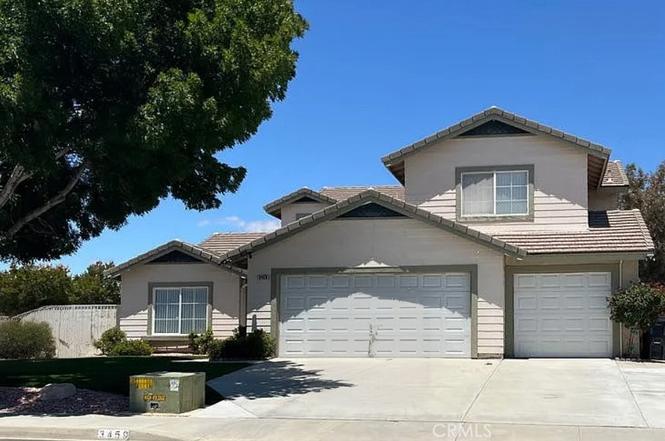
3459 Desert Cloud · Rosamond, CA
Flood risk 2/10 · Minimal
- FEMA flood zone
- X (shaded)
- Chance of flooding over 30 yrs
- 0.03%
- Est. flood insurance / yr
- $507 – $1,088
Fire risk 5/10 · Moderate
- Est. fire insurance / yr
- $659 – $1,223
Heat risk 7/10 · Major
- Hot days now (above 100°F)
- 4 days/yr
- Hot days in 30 yrs
- 12 days/yr
Wind risk 1/10 · Minimal
- Chance of severe wind over 30 yrs
- —
Air-quality risk 7/10 · Major
- Unhealthy air days now
- 14 days/yr
- Unhealthy air days in 30 yrs
- 18 days/yr
Risk factors via First Street. Map © Google.
Why this score? — see what drove the D+ grade
The composite is a weighted blend of 9 inputs, each scored 0–100. Each bar is that input's sub-score; the figure is the points it added to the 100-point composite (weight × sub-score).
- ARV discount +15.0/15.0
- Cash flow +10.4/30.0
- Appreciation +6.2/10.0
- 1% rule +3.0/10.0
- DSCR +3.0/10.0
- Rent growth +2.5/5.0
- Livability +2.5/5.0
- Condition / age +2.5/5.0
- Schools +2.2/10.0
$420,000
🖨 Deal sheet (PDF) 📄 Offer letter ✓ Due diligence
Listing remarks MLS
This is love at 1st sight. Offering great curb appeal with RV parking. This home has just about everything for your family. Featuring a formal living & formal dining room. A huge family room with lots of natural lighting with high ceilings with a fireplace. This particular model has the master bedroom downstairs. In addition, there is a bonus room downstairs that could be a bedroom that has direct access to the guest bathroom which is perfect for guests or in laws. Upstairs, has the other bedrooms, & a very large loft that could easily be used as a 5th bedroom. Your kitchen has upgraded touches with newer counters & decorative back splash. Just off of the kitchen, offers an enclosed sun room that can offer additional space for your entertaining. Step out to your backyard that does feature a covered patio & you can retreat for relaxation with your above ground spa. This home is walking distance to the school & is ready for a new family. Hurry on this one!!!
Key facts
- 6,534 sq ft lot
- 3 garage spots
- Built 2002
Property features AI
Finance
- Other: Single-family property (1 unit); No ADU; No common walls
- HOA & community: Suburban community
Exterior
- Parking: Attached garage with 3 garage spaces; RV access/parking; Total of 3 parking spaces
- Utilities: Public sewer; District/public water
- Home design: House; Two stories; Entry on level 1
- Construction: Concrete slab foundation; Built year recorded in public records
- Exterior features: Patio; Sprinkler system with front sprinklers; Corner lot; Property has a view; No pool
Interior
- Kitchen: Breakfast counter / bar
- Bedrooms: All bedrooms are upstairs
- Flooring: Carpet; Laminate
- Bathrooms: Two full bathrooms; One half bathroom
- Heating & cooling: Central cooling
- Interior features: Two-story layout with all bedrooms located upstairs; Front entry; Above-ground spa; Main level has one bathroom
- Laundry & utility: Indoor laundry area; Washer hookup available
Neighborhood map
What this means for you Summary
Snapshot
- This is a 5-bed/3.0-bath single-family listed at $420k.
Deal economics
- At list price, monthly cash flow is $-227 ($-3k/yr) — negative.
- To cash-flow at today's rent, offer at most $380k (9.5% below list).
- To meet the 1% rule (rent ≥ 1% of price), the offer needs to be $338k (19.6% below list).
- Recommended offer: $338k (19.6% below list) — sets the bar for 1% rule.
- Cap rate 5.6% vs local median 4.3% in Rosamond — top-decile yield for the area; either an underpriced asset or a hidden risk that comps aren't pricing in. Stress-test before assuming the spread holds.
Location & tenants
- Location reads 49/100 on livability (#1,178 in CA) — a working-class tenant base; expect higher turnover. Strengths: housing A+; Watch: crime F, amenities F, commute F.
- Southern Kern Unified (town): math 25% / reading 25% proficiency, ranked #387 of 517 in CA (top 75%) — low school quality limits family demand, transient renter base, plan for 1-2y turnover; 67% free/reduced lunch — lower-income household profile, screen leases tightly.
- Zoned schools: Westpark Elementary (940 students, 78% FRL); Tropico Middle (math 24% / reading 24%, grade F, #277 of 498 statewide, top 73%, 782 students, 80% FRL); Rosamond High Early College Campus (913 students, 83% FRL).
- Market conditions: 463 active listings in the ZIP; 10 comparable units currently listed for rent nearby; rentals leasing fast (median 6d on market — plan ~1-2 weeks tenant-placement turnaround); solid renter incomes; 3,244 units permitted in Kern County in 2024 (73 in 5+ unit buildings).
- At $3,376/mo this rent would consume 52% of the median local household income ($77k/yr) (locally 425% of renters already pay >50% of income on rent) — very limited rent-growth headroom before tenants either downsize or default.
Forward outlook
- In year one you build about $13k of equity ($3k loan paydown + $10k appreciation (2.4% local appreciation)).
- Kern County population projected at +17% by 2050 — long-run rental-demand tailwind backs the buy-and-hold thesis.
- By year 3, paydown + projected appreciation supports a ~$33k cash-out refi (75% LTV) — recoverable capital for the next deal without selling this one.
Negotiation context
- Only 2 days on market — expect competitive offers; lowballing is unlikely to land.
- 3 sale attempts since 12y ago with the ask held roughly flat each time — persistent listings suggest the price (not the market) is what's stuck; bring a comps-based counter.
- Current owner paid $342k; 23% above their basis — modest negotiation headroom, anchor on the comps not their cost.
Risks & watch-outs
- Climate carrying-cost: moderate wildfire risk; extreme-heat days projected 4→12/yr by 2055 (HVAC capex compounding) — expect insurance premiums to compound above CPI over the hold.
Questions for the listing agent
- What do current leases actually rent for vs. the listed asking? Can we see a recent rent roll and the last 12 months of T-12 income?
- Is there a deadline driving the sale (1031 exchange, divorce, estate, relocation)? That informs how much negotiation room exists.
- Schools are F-rated, which usually means shorter tenancies and higher turnover. Who's the typical renter profile here, and what's been the actual vacancy rate?
- Crime grade is F in this area — have there been break-ins, vandalism, or insurance claims at this property in the last 3 years? What carrier currently insures it and at what premium?
- The area grade is low — what's the realistic commute time and amenity access for the typical tenant pool here? Any planned neighborhood developments (good or bad) we should know about?
- What's the average days-on-market for RENTAL listings here right now (not sales)? A rising rental-DOM trend means longer vacancies and softer asking-rent achievability than the comps imply.
- What's the recent tenant-quality profile in this submarket — average credit score on applications, eviction rate, late-payment / NSF rate, and stable-employment percentage? A property-management company in the area should have these aggregated.
- How much new for-sale + rental construction is in the pipeline within 1–3 miles? Heavy new supply typically softens prices + rents 12–24 months out; constrained supply supports both.
Investment metrics
- 1% rule
- 0.80% ✗
- Cap rate
- 5.65%
- Cash-on-cash
- -2.31%
- DSCR
- 0.90
- GRM
- 10.4
CMA / ARV
- ARV (on-the-fly)
- $515,746
- Comps found
- 12
Show comp detail 12 sales within ~0.75 mi
| Address | Dist | Beds/Ba | Sqft | Sold | Price | $/sf | Match |
|---|---|---|---|---|---|---|---|
| 3454 Garnet | 0.38mi | 5/3.0 | 2,669 (+2%) | 1mo | $515,000 | $193 | 78 |
| 2274 Dwight Ct | 0.36mi | 5/3.0 | 2,521 (-4%) | 0mo | $500,000 | $198 | 77 |
| 3408 Gemstone | 0.23mi | 5/3.0 | 2,459 (-6%) | 4mo | $485,000 | $197 | 75 |
| 2136 Westpark Dr | 0.28mi | 5/2.5 | 2,478 (-5%) | 3mo | $475,000 | $192 | 74 |
| 2016 Via Vida Feliz Ave | 0.46mi | 4/3.0 (-1) | 2,583 (-1%) | 1mo | $507,000 | $196 | 71 |
| 3013 Via Bella Rosa | 0.44mi | 4/3.0 (-1) | 2,583 (-1%) | 5mo | $495,000 | $192 | 68 |
| 3024 Erica | 0.52mi | 5/3.0 | 2,521 (-4%) | 4mo | $490,000 | $194 | 66 |
| 3445 Stella Ave | 0.75mi | 5/3.0 | 2,588 (-1%) | 4mo | $529,990 | $205 | 60 |
| 2903 La Calle Sabio Ave | 0.70mi | 4/2.5 (-1) | 2,583 (-1%) | 2mo | $490,000 | $190 | 56 |
| 3383 Andrew Ave | 0.54mi | 4/2.5 (-1) | 2,288 (-13%) | 1mo | $460,000 | $201 | 46 |
| 3619 Mount Whitney Ave | 0.62mi | 4/2.5 (-1) | 2,286 (-13%) | 3mo | $485,000 | $212 | 40 |
| 3621 Mt San Gorgonia Ave | 0.67mi | 4/2.5 (-1) | 2,286 (-13%) | 4mo | $474,000 | $207 | 38 |
Match score weights: distance 35% · size 25% · config 20% · recency 20%. Top-matched comps best support the ARV.
Projected returns pro-forma
2.4% appreciation · 3.0% rent growth · sell at horizon
- IRR
- 3.6%
- Equity multiple
- 1.20×
- Total profit
- $23,138
- Equity at exit
- $174,942
- IRR
- 7.1%
- Equity multiple
- 2.02×
- Total profit
- $119,381
- Equity at exit
- $259,253
Cash invested: $117,600 (down + closing). Projections, not guarantees.
Landlord ↔ Tenant lean methodology
- Overall (STATE)
- 18 Strongly Tenant-Friendly
- State California
- 18 Strongly Tenant-Friendly · D+13
- County
- — inherits STATE
- City
- — inherits STATE
ZIP-level market 93560
- Home prices YoY
- 0.6%
- Active inventory
- 463
- Price-to-rent
- 10.4×
Monthly cashflow live
- Estimated rent
- $3,376 high interval (Pro) →
- Mortgage (P&I)
- −$2,203
- Tax from tax record
- −$516 /mo · $6,189/yr
- Insurance
- −$175
- HOA
- −$0
- Vacancy / Maint / Mgmt
- −$709
- Net cashflow
- $-227
Break-even live
Sensitivity live
| Price | -10% $11 | -5% $-108 | +0% $-227 | +5% $-345 | +10% $-464 |
|---|---|---|---|---|---|
| Rent | -10% $-493 | -5% $-360 | +0% $-227 | +5% $-93 | +10% $40 |
| Rate | -1.0pp $-15 | -0.5pp $-120 | base $-227 | +0.5pp $-335 | +1.0pp $-446 |
UW: 25.0% down · 7.5% · 30yr · 1.5% tax · 5.0% vac · 8.0% maint · 8.0% mgmt
Financing live
Cash to close
- Down payment
- $105,000
- Closing costs
- $12,600
- Reserves months
- —
- Total cash needed
- —
Loan-product check · same deal, 3 products live
Conventional
25% down · 7.5% · 30yr
- Down + closing
- —
- Monthly P&I
- —
- Monthly cashflow
- —
- DSCR
- —
- Eligible?
- —
Personal DTI + credit; lowest rate.
DSCR
20% down · 8.5% · 30yr
- Down + closing
- —
- Monthly P&I
- —
- Monthly cashflow
- —
- DSCR
- —
- Eligible?
- —
No personal income docs; deal must DSCR.
Hard money
10% down · 12.0% · 12mo
- Down + closing
- —
- Monthly P&I
- —
- Monthly cashflow
- —
- DSCR
- —
- Eligible?
- —
Short-term bridge; refi at stabilization.
Rent comps 10 comps
| Address | Beds | Baths | Sqft | Rent | $/sqft | DOM | Units | Dist |
|---|---|---|---|---|---|---|---|---|
| 3124 Via Bella Rosa Ave Rosamond, CA | 4.0 | 2.0 | 1809 | $3,200 | $1.77 | 45d | 1 | 0.29mi |
| 3141 Patti Rose Ave Rosamond, CA | 4.0 | 3.5 | 2788 | $3,300 | $1.18 | 0d | 1 | 0.32mi |
| 3017 Via Bella Rosa Ave Rosamond, CA | 4.0 | 2.0 | 1820 | $2,800 | $1.54 | 45d | 1 | 0.41mi |
| 3075 Summer Breeze Ave Rosamond, CA | 4.0 | 3.0 | 2873 | $2,975 | $1.04 | 0d | 1 | 0.42mi |
| 3926 Westbrook Ave Rosamond, CA | 4.0 | 3.0 | 2500 | $3,300 | $1.32 | 4d | 1 | 0.51mi |
| 3809 Park Vista Ct Rosamond, CA | 4.0 | 2.0 | 2034 | $3,400 | $1.67 | 45d | 1 | 0.53mi |
| 3016 Erica Ave Rosamond, CA | 5.0 | 3.0 | 2521 | $3,600 | $1.43 | 0d | 1 | 0.54mi |
| 3542 Half Dome Ave Rosamond, CA | 4.0 | 2.5 | 2583 | $3,200 | $1.24 | 5d | 1 | 0.56mi |
| 2917 La Calle Audaz Ave Rosamond, CA | 4.0 | 2.5 | 2583 | $2,900 | $1.12 | 0d | 1 | 0.66mi |
| 2421 Arboretum Ave Rosamond, CA | 4.0 | 2.5 | 2637 | $2,950 | $1.12 | 18d | 1 | 1.11mi |
Listing history 3 events
-
2026-06-18days on market $420,000 Active 2 DOM
-
2026-06-17remarks 432-char remark
-
2026-06-17$420,000 Active 1 DOM
ⓘ Source: listings_history table (triggers on properties + properties_extension) + one-shot
backfill from property_details.listing_events for pre-trigger history.
Tax reassessment forecast CA · Resets to sale price
- Current annual tax
- $6,189 · $516/mo
- Projected year-2 tax
- $6,189 · $516/mo
- Expected delta
- $0/yr ($0/mo · 0.0%)
ⓘ Screening estimate from a state-policy table — verify with the county assessor before closing.
Climate risk First Street
- Flood 2/10 Low FEMA zone X (shaded) · 3% chance over 30 yrs
- Wildfire 5/10 Major
- Heat 7/10 Severe 4 d/yr ≥100°F today · 12 d/yr by 30 yrs out
- Wind 1/10 Low
- Air quality 7/10 Severe 14 unhealthy d/yr today · 18 by 30 yrs out
Nearby sold comps map
Loading sold comps map…
Walkable amenities ~0.75 mi
Loading nearby amenities…
Taxation est. · year 1
- Rental income
- $40,507
- − Mortgage interest
- −$23,527
- − Property taxes
- −$6,189
- − Insurance
- −$2,100
- − Repairs & maintenance
- −$3,241
- − Management
- −$3,241
- − Depreciation
- −$12,218
- Taxable loss
- −$10,007
- Est. tax savings @ 24.0%
- +$2,402
- After-tax cash flow
- $-317/yr
For passive investors: Depreciation is non-cash, so a rental often shows a tax loss while cash-flowing — sheltering income. Rental losses are passive: they offset passive income freely, and up to $25,000/yr can offset ordinary (W-2) income if you actively participate and your MAGI is under $100k (phasing out to $0 by $150k); unused losses carry forward. On sale, claimed depreciation is recaptured at up to 25%, and gains may owe capital-gains tax (a 1031 exchange can defer both). Figures are a year-1 estimate at your 24.0% rate — not tax advice; consult a CPA.
Schools (NCES district)
- District
- Southern Kern Unified
- NCES district ID
- 0637620
- Math proficiency
- 25% ▲ 7.00%
- Reading proficiency
- 25% ▼ -8.00%
- Median HH income
- $54,523
- Composite
- 22.5/100
- National rank
- #8093
- State rank
- #387 of 517 in CA
Livability — Rosamond
- Score
- 49/100
- State rank
- #1178
- US rank
- #25952
Category grades
Schools grade is shown separately in the Schools card above.
Census & demographics
- Census place
- Rosamond, CA
- County
- Kern County · 710,371 people
- City population
- 22,119
- Metro
- Bakersfield, CA
- Population (ZIP)
- 22,119
- Household income
- $77,431
- Rent vs Own
- Severe rent burden
- 425.0
Population outlook (Kern County) Hauer SSP2
- Today (2025)
- 947,286 people
- By 2030
- 978,984 · +3.3%
- By 2040
- 1,045,018 · +10.3%
- By 2050
- 1,105,232 · +16.7%
- By 2075
- 1,229,538 · +29.8%
- By 2100
- 1,238,059 · +30.7%
Race, ethnicity, and origin ACS 2023
- Neighborhood character
- Diverse neighborhood (Simpson 0.68)
- Race & ethnicity
- Hispanic / Latino 45% White 32% Two or more races 17% Black 13% Asian 3% Native American 1%
- Hispanic origin (detail)
- Mexican 35%
- Common ancestry
- Portuguese 2% Italian 2% Lithuanian 1%
- Foreign-born
- 13% · Canada
- Languages at home
- 68% English-only · Spanish 28% Other Indo-European 2% Other Asian/Pacific 1%
Political lean MEDSL · Kern
- 2024 margin
- Strong R (+21.1) · D 38.2% · R 59.3% · Other 2.5%
- 2008→2024 swing
- -3.3pp toward R · 2008: -17.8pp · 2024: -21.1pp
- All cycles
- 2024: R+21.1 2020: R+10.2 2016: R+15.0 2012: R+20.9 2008: R+17.8
Not yet ingested
- Civics
- —
Market trends
- HPI YoY
- ▲ 2.40%
- Current HPI
- 403.7206
- Rent YoY
- —
- Metro
- Bakersfield, CA
- State GDP YoY
- ▲ 3.21%
- F500 in state
- 116
Industry mix (Fortune 500 HQ in CA)
| Industry | F500 HQs | Revenue |
|---|---|---|
| Technology | 27 | $1,492B |
|
||
| Financial Services | 3 | $174B |
|
||
| Retail | 3 | $44B |
|
||
| Insurance | 3 | $26B |
|
||
| Media / Entertainment | 2 | $115B |
|
||
| Pharmaceuticals / Biotech | 2 | $62B |
|
||
Price history
+77.2% since first listed8 events — show timeline
- 2026-06-16 Listed $420,000 CRMLS
- 2019-11-05 Sold (Public Records) $342,500 Public Records
- 2019-11-05 Sold (MLS) $342,500 AVMLS
- 2019-09-16 Pending — AVMLS
- 2019-09-07 Listed $339,900 AVMLS
- 2014-10-29 Sold (Public Records) $237,000 Public Records
- 2014-10-29 Sold (MLS) $237,000 AVMLS
- 2014-09-09 Listed $237,000 AVMLS
Property tax history
+6.1%/yrLatest (2025): $6,189 · +26.1% YoY. Source: county tax records.
Cash-flow waterfall
monthlySold comps — $/sqft
last 12 mo · ≤1 miLoading sold comps…