 Fourplex
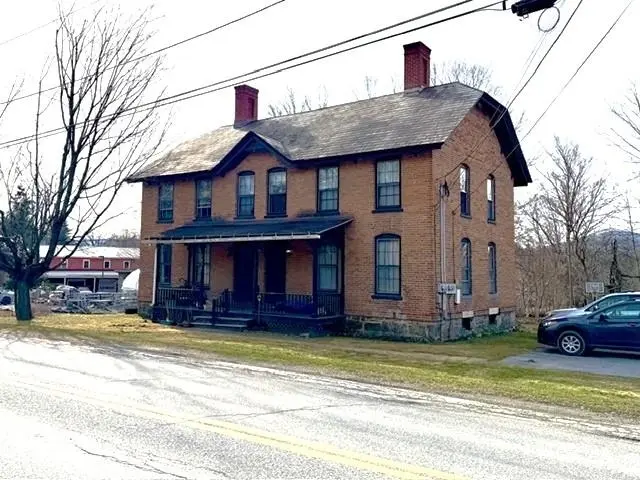
1931 Vermont Route 67E · South Shaftsbury, VT
Flood risk 1/10 · Minimal
- FEMA flood zone
- X (unshaded)
- Chance of flooding over 30 yrs
- 0.0%
- Est. flood insurance / yr
- $507 – $1,088
Fire risk 2/10 · Minimal
- Est. fire insurance / yr
- $480 – $892
Heat risk 2/10 · Minimal
- Hot days now (above 91°F)
- 7 days/yr
- Hot days in 30 yrs
- 16 days/yr
Wind risk 3/10 · Minor
- Chance of severe wind over 30 yrs
- 8.0%
Air-quality risk 2/10 · Minimal
- Unhealthy air days now
- 0 days/yr
- Unhealthy air days in 30 yrs
- 1 days/yr
Risk factors via First Street. Map © Google.
Why this score? — see what drove the C grade
The composite is a weighted blend of 9 inputs, each scored 0–100. Each bar is that input's sub-score; the figure is the points it added to the 100-point composite (weight × sub-score).
- Cash flow +20.5/30.0
- ARV discount +7.5/15.0
- DSCR +6.5/10.0
- 1% rule +5.4/10.0
- Appreciation +5.0/10.0
- Schools +5.0/10.0
- Condition / age +3.8/5.0
- Livability +3.0/5.0
- Rent growth +2.5/5.0
$825,000
🖨 Deal sheet 📄 Offer letter ✓ Due diligence
Multi-family units
County records classify this as Multi-Family (5+ Unit). Listing-text estimate: 4 units. estimate disagrees with records
5+ unit building — per-unit beds/baths from public records are typically unavailable; the breakdown below (if shown) is an estimate from the listing text.
Listing remarks
Rare investment opportunity in one of the area’s most desirable neighborhoods! This unique offering includes two historic buildings set on a spacious 1-acre lot, featuring a total of 8 well-maintained units—comprised of (4) two-bedroom apartments and (4) one-bedroom apartments. Each building offers shared covered front porches, perfect for enjoying the charm of this pleasant street setting. The four first-floor units each feature private back decks overlooking a beautiful, expansive backyard, adding to tenant appeal. With 12 off-street parking spaces, convenience is key. Ideally located within walking distance to the Village of North Bennington, residents can easily enjoy local
Key facts
- Private back decks
- Off street parking
- Spacious lot
Tags
Property features AI
Finance
- Financial info: Total of 8 rental units with annual leases
Exterior
- Parking: Paved driveway parking
- Utilities: Public sewer; Public water; 100 amp electric service
- Home design: Multi-family building; Existing structure; Built in 1867
- Construction: Brick exterior; Slate roof; Built in 1867
- Exterior features: Paved driveway; Sidewalks; Neighborhood setting
Interior
- Kitchen: Electric ranges in units; Refrigerators included
- Bedrooms: Four 1-bedroom units; Four 2-bedroom units
- Flooring: Combination of carpet, hardwood, laminate, and tile
- Bathrooms: Eight full bathrooms (one per unit)
- Heating & cooling: Oil-fired heating; Baseboard heating; Hot water heating; No central air conditioning
- Interior features: Unfinished walkout basement; Heat included in units; Decks and porches on several units
- Laundry & utility: Water heaters in units (electric); Washer/dryer details vary by unit
Neighborhood map
What this means for you Summary
Snapshot
- This is a 4 × 3-bed/2.0-bath units multifamily listed at $825k. Condition is rated good.
Deal economics
- At list price, monthly cash flow is $1k ($13k/yr) — positive. Per door: $272/mo.
- The deal already cash-flows at list — no discount required.
- Meets the 1% rule at list price ($9k rent vs $825k).
- Recommended offer: $776k (6.0% below list) — sets the bar for market timing.
Location & tenants
- Location reads 59/100 on livability (#100 in VT) — a working-class tenant base; expect higher turnover. Strengths: housing A+, crime B; Watch: cost of living C-, health & safety D, schools F.
- Market conditions: 19 active listings in the ZIP; 59 units permitted in Bennington County in 2024 (0 in 5+ unit buildings).
Forward outlook
- In year one you build about $6k of equity ($6k loan paydown + $405 appreciation (0.1% local appreciation)).
- Bennington County population projected at -23% by 2050 — secular population decline; favor cash flow + early exit over multi-decade hold.
- At projected returns (0.1% appreciation + 3.0% rent growth), your $231k cash investment doubles in ~9 years — after that, you're playing with house money.
- By year 7, paydown + projected appreciation supports a ~$53k cash-out refi (75% LTV) — recoverable capital for the next deal without selling this one.
Negotiation context
- It's been on market 79 days — a 6% lower offer ($776k) is reasonable based on typical stale-listing flexibility.
Risks & watch-outs
- Watch-outs: built in 1867 — expect roof / HVAC / electrical / plumbing capex.
Questions for the listing agent
- It's been on market 79 days. Have you received any prior offers? Is the seller open to a 6% concession, seller financing, or rate buy-down credit?
- Can we see the unit-by-unit rent roll, current vacancy, and any below-market leases? What's the average tenancy length?
- What capital expenditures (roof, boiler, parking lot, exteriors) have been made in the last 5 years, and what's planned in the next 2?
- Built in 1867 — when were the roof, HVAC, electrical panel, plumbing, and water heater last replaced?
- Why hasn't it sold? Are there any deal-killer items the seller is aware of (foundation, flood, title, zoning, code violations)?
- Is there a deadline driving the sale (1031 exchange, divorce, estate, relocation)? That informs how much negotiation room exists.
- Schools are F-rated, which usually means shorter tenancies and higher turnover. Who's the typical renter profile here, and what's been the actual vacancy rate?
- What's the average days-on-market for RENTAL listings here right now (not sales)? A rising rental-DOM trend means longer vacancies and softer asking-rent achievability than the comps imply.
- What's the recent tenant-quality profile in this submarket — average credit score on applications, eviction rate, late-payment / NSF rate, and stable-employment percentage? A property-management company in the area should have these aggregated.
- How much new apartment / multifamily construction is in the pipeline within 1–3 miles? Heavy new supply (>2% of stock underway) typically softens rents 12–24 months out; light construction supports rent growth.
Investment metrics
- 1% rule
- 1.04% ✓
- Cap rate
- 7.88%
- Cash-on-cash
- 5.65%
- DSCR
- 1.25
- GRM
- 8.0
CMA / ARV
No comps found within radius.
Projected returns pro-forma
0.05% appreciation · 3.0% rent growth · sell at horizon
- IRR
- 4.3%
- Equity multiple
- 1.20×
- Total profit
- $47,189
- Equity at exit
- $241,582
- IRR
- 9.5%
- Equity multiple
- 2.04×
- Total profit
- $241,225
- Equity at exit
- $292,016
Cash invested: $231,000 (down + closing). Projections, not guarantees.
Landlord ↔ Tenant lean methodology
- Overall (STATE)
- 41 Moderately Tenant-Leaning
- State Vermont
- 41 Moderately Tenant-Leaning · D+15
- County
- — inherits STATE
- City
- — inherits STATE
ZIP-level market 05262
- Home prices YoY
- 0.0%
- Active inventory
- 19
- Price-to-rent
- 32.0×
Monthly cashflow live
- Estimated rent
- $8,594 medium interval (Pro) →
- Mortgage (P&I)
- −$4,326
- Tax est. 1.5%
- −$1,031 /mo · $12,375/yr
- Insurance
- −$344
- HOA
- −$0
- Vacancy / Maint / Mgmt
- −$1,805
- Net cashflow
- $1,088
Break-even live
4-unit breakdown (identical units grouped — click to expand)
| Units | Beds | Baths | Est. rent |
|---|---|---|---|
| 4× units | 3 | 2 | $8,592 |
| #1 | 3 | 2 | $2,148 |
| #2 | 3 | 2 | $2,148 |
| #3 | 3 | 2 | $2,148 |
| #4 | 3 | 2 | $2,148 |
| Total (4 units) | $8,594 | ||
UW: 25.0% down · 7.5% · 30yr · 1.5% tax · 5.0% vac · 8.0% maint · 8.0% mgmt
Financing live
Cash to close
- Down payment
- $206,250
- Closing costs
- $24,750
- Reserves months
- —
- Total cash needed
- —
Loan-product check · same deal, 3 products live
Conventional
25% down · 7.5% · 30yr
- Down + closing
- —
- Monthly P&I
- —
- Monthly cashflow
- —
- DSCR
- —
- Eligible?
- —
Personal DTI + credit; lowest rate.
DSCR
20% down · 8.5% · 30yr
- Down + closing
- —
- Monthly P&I
- —
- Monthly cashflow
- —
- DSCR
- —
- Eligible?
- —
No personal income docs; deal must DSCR.
Hard money
10% down · 12.0% · 12mo
- Down + closing
- —
- Monthly P&I
- —
- Monthly cashflow
- —
- DSCR
- —
- Eligible?
- —
Short-term bridge; refi at stabilization.
Listing history 17 events
-
2026-06-19days on market $825,000 Active 79 DOM
-
2026-06-18days on market $825,000 Active 78 DOM
-
2026-06-17days on market $825,000 Active 77 DOM
-
2026-06-16days on market $825,000 Active 76 DOM
-
2026-06-15days on market $825,000 Active 75 DOM
-
2026-06-14days on market $825,000 Active 73 DOM
-
2026-06-12days on market $825,000 Active 72 DOM
-
2026-06-09days on market $825,000 Active 69 DOM
-
2026-06-08pricedays on market $825,000 Active 68 DOM
-
2026-06-07days on market $865,000 Active 67 DOM
-
2026-06-07days on market $865,000 Active 66 DOM
-
2026-06-04days on market $865,000 Active 63 DOM
-
2026-06-02days on market $865,000 Active 62 DOM
-
2026-06-01days on market $865,000 Active 61 DOM
-
2026-05-31days on market $865,000 Active 60 DOM
-
2026-05-31days on market $865,000 Active 59 DOM
-
2026-04-01$865,000 Active
ⓘ Source: listings_history table (triggers on properties + properties_extension) + one-shot
backfill from property_details.listing_events for pre-trigger history.
Climate risk First Street
- Flood 1/10 Low FEMA zone X (unshaded) · 0% chance over 30 yrs
- Wildfire 2/10 Low
- Heat 2/10 Low 7 d/yr ≥91°F today · 16 d/yr by 30 yrs out
- Wind 3/10 Moderate 8% chance of damaging wind over 30 yrs
- Air quality 2/10 Low 0 unhealthy d/yr today · 1 by 30 yrs out
Nearby sold comps map
Loading sold comps map…
Walkable amenities ~0.75 mi
Loading nearby amenities…
Taxation est. · year 1
- Rental income
- $103,128
- − Mortgage interest
- −$46,213
- − Property taxes
- −$12,375
- − Insurance
- −$4,125
- − Repairs & maintenance
- −$8,250
- − Management
- −$8,250
- − Depreciation
- −$24,000
- Taxable loss
- −$85
- Est. tax savings @ 24.0%
- +$20
- After-tax cash flow
- $13,075/yr
For passive investors: Depreciation is non-cash, so a rental often shows a tax loss while cash-flowing — sheltering income. Rental losses are passive: they offset passive income freely, and up to $25,000/yr can offset ordinary (W-2) income if you actively participate and your MAGI is under $100k (phasing out to $0 by $150k); unused losses carry forward. On sale, claimed depreciation is recaptured at up to 25%, and gains may owe capital-gains tax (a 1031 exchange can defer both). Figures are a year-1 estimate at your 24.0% rate — not tax advice; consult a CPA.
Condition & rehab AI · 13 photos
The property is in good condition with no major repairs needed. Painting the exterior and landscaping improvements would significantly increase its value for both resale and rental.
Value-add opportunities
- Both Painting the exterior walls and roof — Painting the exterior walls and roof can enhance the curb appeal and increase the property's value for both resale and rental.
- Both Landscaping improvements — Landscaping improvements can enhance the curb appeal and increase the property's value for both resale and rental.
Renovation cost estimate screening
Value-add ROI direction
- Both Painting the exterior walls and roof — Painting the exterior walls and roof can enhance the curb appeal and increase the property's value for both resale and rental. ↑
- Both Landscaping improvements — Landscaping improvements can enhance the curb appeal and increase the property's value for both resale and rental. ↑
ⓘ Cost ranges are severity-bucket heuristics (US national rule-of-thumb). Get contractor quotes + a written scope before underwriting a rehab budget.
Schools (NCES district)
No district data.
Livability — South Shaftsbury
- Score
- 59/100
- State rank
- #100
- US rank
- #20376
Category grades
Schools grade is shown separately in the Schools card above.
Census & demographics
- Population (ZIP)
- 1,979
Population outlook (Bennington County) Hauer SSP2
- Today (2025)
- 34,407 people
- By 2030
- 32,975 · -4.2%
- By 2040
- 29,711 · -13.6%
- By 2050
- 26,638 · -22.6%
- By 2075
- 21,318 · -38.0%
- By 2100
- 16,086 · -53.2%
Race, ethnicity, and origin ACS 2023
- Neighborhood character
- Predominantly White (95%)
- Race & ethnicity
- White 95% Two or more races 5%
- Common ancestry
- Lithuanian 21% Scottish 2% Iranian 2%
Political lean MEDSL · Bennington
- 2024 margin
- Strong D (+22.5) · D 60.0% · R 37.5% · Other 2.6%
- 2008→2024 swing
- -10.9pp toward R · 2008: 33.4pp · 2024: 22.5pp
- All cycles
- 2024: D+22.5 2020: D+27.3 2016: D+22.1 2012: D+33.3 2008: D+33.4
Not yet ingested
- Civics
- —
Market trends
- HPI YoY
- ▬ 0.05%
- Current HPI
- 344.1934
- Rent YoY
- —
- Metro
- —
- State GDP YoY
- —
- F500 in state
- 0
Price history
1 event — show timeline
- 2026-04-01 Listed $865,000 PrimeMLS
Cash-flow waterfall
monthlySold comps — $/sqft
last 12 mo · ≤1 miLoading sold comps…