 🏢 Co-op
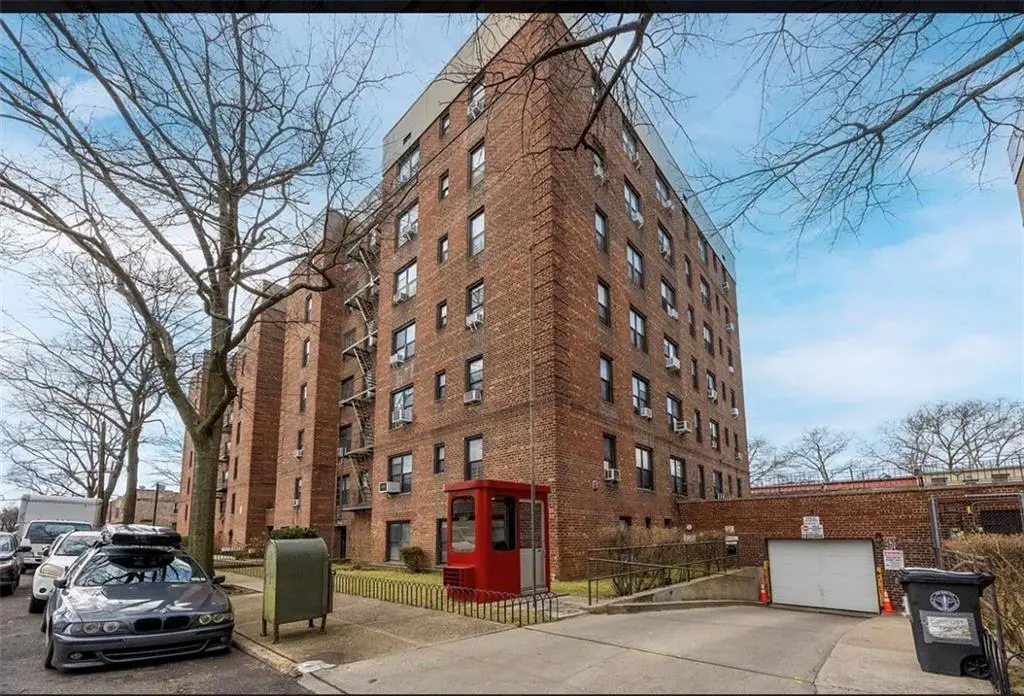
40 E 43rd St Unit 3E · New York, NY
Flood risk 4/10 · Minor
- FEMA flood zone
- X (unshaded)
- Chance of flooding over 30 yrs
- 0.2%
- Est. flood insurance / yr
- $507 – $1,088
Fire risk 1/10 · Minimal
- Est. fire insurance / yr
- $691 – $1,283
Heat risk 6/10 · Moderate
- Hot days now (above 99°F)
- 7 days/yr
- Hot days in 30 yrs
- 15 days/yr
Wind risk 6/10 · Moderate
- Chance of severe wind over 30 yrs
- 64.0%
Air-quality risk 5/10 · Moderate
- Unhealthy air days now
- 6 days/yr
- Unhealthy air days in 30 yrs
- 8 days/yr
Risk factors via First Street. Map © Google.
Why this score? — see what drove the B- grade
The composite is a weighted blend of 9 inputs, each scored 0–100. Each bar is that input's sub-score; the figure is the points it added to the 100-point composite (weight × sub-score).
- Cash flow +24.8/30.0
- DSCR +8.1/10.0
- ARV discount +7.5/15.0
- 1% rule +6.4/10.0
- Appreciation +5.0/10.0
- Schools +5.0/10.0
- Livability +3.8/5.0
- Rent growth +2.5/5.0
- Condition / age +2.5/5.0
$299,000
🖨 Deal sheet 📄 Offer letter ✓ Due diligence
Listing remarks
Welcome to 40 East 43rd Street. A spacious 2 BR Co-Op in a well connected location with convenient access to transportation, shopping, dining and everyday essentials. This is an elevator building that is well maintained and owners have access to the laundry area. The apartment is in its original condition! Co-Op ownership can offer a strong sense of community, lower purchase prices compared to similar Condos and offer lower monthly carrying costs. A smart opportunity for buyers looking for value, space and long term stability. Call us now to schedule your private viewing before it's gone!
Key facts
- Laundry area
- Elevator building
- Built 1956
Tags
Property features AI
Finance
- Other: Building has approximately 120 units; Co-op shares listed as 100%
- Financial info: Exchange considered, bank mortgage or cash financing accepted; Typical down payment requirement around 20%; Flip tax of 1% (percentage)
- HOA & community: Maintenance/common fee of $996; Managed by Metro Management; Pets are not allowed; Handicap access available
Exterior
- Parking: Street parking
- Security: Intercom door; Secure lobby; Security patrol
- Utilities: Electric service available; Gas service available; Heat available; Septic; Sewer; Water
- Home design: Detached building; Residential property; Located on the 3rd floor of the building
- Construction: Detached building
- Exterior features: Secure lobby; Intercom door; Security patrol; Storage rooms; Resident superintendent
Interior
- Kitchen: Eat-in kitchen; Refrigerator; Stove
- Bedrooms: Two bedrooms on the first floor; Master bedroom on the first floor
- Flooring: Hardwood floors; Vinyl floors; Tile floors; Linoleum floors
- Bathrooms: One full bathroom on the first floor
- Heating & cooling: Baseboard heat; Gas hot water; No air conditioning units
- Interior features: Elevator; Laundry area; Refrigerator; Stove
- Laundry & utility: Card-operated laundry (building); Laundry area in unit
Neighborhood map
What this means for you Summary
Snapshot
- This is a 2-bed/1.0-bath condo listed at $299k.
Deal economics
- At list price, monthly cash flow is $635 ($8k/yr) — positive.
- The deal already cash-flows at list — no discount required.
- Meets the 1% rule at list price ($3k rent vs $299k).
- Recommended offer: $295k (1.5% below list) — sets the bar for market timing.
- Cap rate 8.8% vs local median 2.6% in New York — top-decile yield for the area; either an underpriced asset or a hidden risk that comps aren't pricing in. Stress-test before assuming the spread holds.
Location & tenants
- Location reads 75/100 on livability (#268 in NY, #4,188 nationally) — a middle-class / working-renter tenant base. Strengths: amenities A+, commute A+, health & safety A; Watch: crime F, cost of living F.
- Market conditions: 5 comparable units currently listed for rent nearby; rentals at typical pace (median 25d on market — plan ~3-4 weeks tenant-placement turnaround); 10,063 units permitted in Kings County in 2024 (9,789 in 5+ unit buildings).
Forward outlook
- In year one you build about $11k of equity ($2k loan paydown + $9k appreciation (3.0% local appreciation)).
- Kings County population projected at +13% by 2050 — modest demand growth; plan on rents tracking national, not racing it.
- At projected returns (3.0% appreciation + 3.0% rent growth), your $84k cash investment doubles in ~5 years — after that, you're playing with house money.
- By year 4, paydown + projected appreciation supports a ~$37k cash-out refi (75% LTV) — recoverable capital for the next deal without selling this one.
Negotiation context
- It's been on market 29 days — a 2% lower offer ($295k) is reasonable based on typical stale-listing flexibility.
- 2 sale attempts since 6y ago with the ask held roughly flat each time — persistent listings suggest the price (not the market) is what's stuck; bring a comps-based counter.
Risks & watch-outs
- Watch-outs: built in 1956 — expect roof / HVAC / electrical / plumbing capex.
- Climate carrying-cost: major wind risk, 64% chance of damaging wind over 30y; extreme-heat days projected 7→15/yr by 2055 (HVAC capex compounding) — expect insurance premiums to compound above CPI over the hold.
Questions for the listing agent
- Built in 1956 — when were the roof, HVAC, electrical panel, plumbing, and water heater last replaced?
- Any open or pending special assessments — roof, HVAC, plumbing, elevator, façade? What's the per-unit balance and payoff schedule, and is the seller paying it off at close or rolling it to the buyer?
- Is there a deadline driving the sale (1031 exchange, divorce, estate, relocation)? That informs how much negotiation room exists.
- Schools are B-rated — typically a magnet for longer-tenancy family renters. What's the average tenant stay here, and is there a school-zone premium baked into asking?
- Crime grade is F in this area — have there been break-ins, vandalism, or insurance claims at this property in the last 3 years? What carrier currently insures it and at what premium?
- What's the average days-on-market for RENTAL listings here right now (not sales)? A rising rental-DOM trend means longer vacancies and softer asking-rent achievability than the comps imply.
- What's the recent tenant-quality profile in this submarket — average credit score on applications, eviction rate, late-payment / NSF rate, and stable-employment percentage? A property-management company in the area should have these aggregated.
- How much new apartment / multifamily construction is in the pipeline within 1–3 miles? Heavy new supply (>2% of stock underway) typically softens rents 12–24 months out; light construction supports rent growth.
Investment metrics
- 1% rule
- 1.14% ✓
- Cap rate
- 8.84%
- Cash-on-cash
- 9.11%
- DSCR
- 1.41
- GRM
- 7.3
CMA / ARV
No comps found within radius.
Projected returns pro-forma
3.0% appreciation · 3.0% rent growth · sell at horizon
- IRR
- 16.0%
- Equity multiple
- 1.91×
- Total profit
- $76,544
- Equity at exit
- $134,443
- IRR
- 17.6%
- Equity multiple
- 3.58×
- Total profit
- $215,886
- Equity at exit
- $207,193
Cash invested: $83,720 (down + closing). Projections, not guarantees.
Monthly cashflow live
- Estimated rent
- $3,420 high interval (Pro) →
- Mortgage (P&I)
- −$1,568
- Tax est. 1.5%
- −$374 /mo · $4,485/yr
- Insurance
- −$125
- HOA
- −$0
- Vacancy / Maint / Mgmt
- −$718
- Net cashflow
- $635
Break-even live
UW: 25.0% down · 7.5% · 30yr · 1.5% tax · 5.0% vac · 8.0% maint · 8.0% mgmt
Financing live
Cash to close
- Down payment
- $74,750
- Closing costs
- $8,970
- Reserves months
- —
- Total cash needed
- —
Loan-product check · same deal, 3 products live
Conventional
25% down · 7.5% · 30yr
- Down + closing
- —
- Monthly P&I
- —
- Monthly cashflow
- —
- DSCR
- —
- Eligible?
- —
Personal DTI + credit; lowest rate.
DSCR
20% down · 8.5% · 30yr
- Down + closing
- —
- Monthly P&I
- —
- Monthly cashflow
- —
- DSCR
- —
- Eligible?
- —
No personal income docs; deal must DSCR.
Hard money
10% down · 12.0% · 12mo
- Down + closing
- —
- Monthly P&I
- —
- Monthly cashflow
- —
- DSCR
- —
- Eligible?
- —
Short-term bridge; refi at stabilization.
Rent comps 5 comps
| Address | Beds | Baths | Sqft | Rent | $/sqft | DOM | Units | Dist |
|---|---|---|---|---|---|---|---|---|
| 361 Winthrop St Brooklyn, NY | 3.0 | 4.0 | 500 | $1,510 | $3.02 | 5d | 1 | 0.54mi |
| 1266 Park Pl Unit 1A Brooklyn, NY | 2.0 | 1.5 | 886 | $3,250 | $3.67 | 24d | 1 | 1.21mi |
| 955 Sterling Pl #1936 Brooklyn, NY | 1.0 | 1.0 | 540 | $3,170 | $5.87 | 20d | 1 | 1.29mi |
| 955 Sterling Pl Unit 415 Brooklyn, NY | 2.0 | 1.0 | 680 | $5,150 | $7.57 | 24d | 1 | 1.30mi |
| 762 Park Pl Unit 3B Brooklyn, NY | 3.0 | 2.0 | 1114 | $5,400 | $4.85 | 24d | 1 | 1.47mi |
HOA detail condo
- Monthly dues
- $0 · $0/yr
- Assessments
- None detected in remarks — confirm with the listing agent.
Listing history 17 events
-
2026-06-18days on market $299,000 Active 29 DOM
-
2026-06-17days on market $299,000 Active 28 DOM
-
2026-06-16days on market $299,000 Active 27 DOM
-
2026-06-15days on market $299,000 Active 26 DOM
-
2026-06-13days on market $299,000 Active 24 DOM
-
2026-06-10days on market $299,000 Active 20 DOM
-
2026-06-08days on market $299,000 Active 19 DOM
-
2026-06-08days on market $299,000 Active 18 DOM
-
2026-06-04days on market $299,000 Active 15 DOM
-
2026-06-03days on market $299,000 Active 14 DOM
-
2026-06-02days on market $299,000 Active 13 DOM
-
2026-06-01days on market $299,000 Active 12 DOM
-
2026-05-31days on market $299,000 Active 11 DOM
-
2026-05-19$299,000 Active
-
2021-03-19historical
-
2020-09-10price $246,000
-
2020-02-21$286,000 New
ⓘ Source: listings_history table (triggers on properties + properties_extension) + one-shot
backfill from property_details.listing_events for pre-trigger history.
Climate risk First Street
- Flood 4/10 Moderate FEMA zone X (unshaded) · 20% chance over 30 yrs
- Wildfire 1/10 Low
- Heat 6/10 Major 7 d/yr ≥99°F today · 15 d/yr by 30 yrs out
- Wind 6/10 Major 64% chance of damaging wind over 30 yrs
- Air quality 5/10 Major 6 unhealthy d/yr today · 8 by 30 yrs out
Nearby sold comps map
Loading sold comps map…
Walkable amenities ~0.75 mi
Loading nearby amenities…
Taxation est. · year 1
- Rental income
- $41,040
- − Mortgage interest
- −$16,749
- − Property taxes
- −$4,485
- − Insurance
- −$1,495
- − Repairs & maintenance
- −$3,283
- − Management
- −$3,283
- − Depreciation
- −$8,698
- Taxable income
- $3,047
- Est. tax owed @ 24.0%
- −$731
- After-tax cash flow
- $6,895/yr
For passive investors: Depreciation is non-cash, so a rental often shows a tax loss while cash-flowing — sheltering income. Rental losses are passive: they offset passive income freely, and up to $25,000/yr can offset ordinary (W-2) income if you actively participate and your MAGI is under $100k (phasing out to $0 by $150k); unused losses carry forward. On sale, claimed depreciation is recaptured at up to 25%, and gains may owe capital-gains tax (a 1031 exchange can defer both). Figures are a year-1 estimate at your 24.0% rate — not tax advice; consult a CPA.
Schools (NCES district)
No district data.
Livability — New York
- Score
- 75/100
- State rank
- #268
- US rank
- #4188
Category grades
Schools grade is shown separately in the Schools card above.
Census & demographics
- Census place
- New York, NY
Population outlook (Kings County) Hauer SSP2
- Today (2025)
- 2,847,441 people
- By 2030
- 2,937,006 · +3.1%
- By 2040
- 3,095,491 · +8.7%
- By 2050
- 3,228,968 · +13.4%
- By 2075
- 3,321,723 · +16.7%
- By 2100
- 3,111,387 · +9.3%
Not yet ingested
- Political lean
- —
- Race & ethnicity
- —
- Common origin
- —
- Civics
- —
Market trends
- HPI YoY
- —
- Current HPI
- —
- Rent YoY
- —
- Metro
- —
- State GDP YoY
- ▲ 2.60%
- F500 in state
- 92
Industry mix (Fortune 500 HQ in NY)
| Industry | F500 HQs | Revenue |
|---|---|---|
| Financial Services | 10 | $950B |
|
||
| Consumer Goods | 9 | $162B |
|
||
| Insurance | 4 | $225B |
|
||
| Telecommunications | 2 | $144B |
|
||
| Pharmaceuticals | 2 | $112B |
|
||
| Media / Entertainment | 2 | $69B |
|
||
Price history
+4.5% since first listed4 events — show timeline
- 2026-05-19 Listed $299,000 BNYMLS
- 2021-03-19 Listing Removed — OneKey® MLS as Distributed by MLS Grid
- 2020-09-10 Price Changed $246,000 OneKey® MLS as Distributed by MLS Grid
- 2020-02-21 Listed $286,000 OneKey® MLS as Distributed by MLS Grid
Cash-flow waterfall
monthlySold comps — $/sqft
last 12 mo · ≤1 miLoading sold comps…