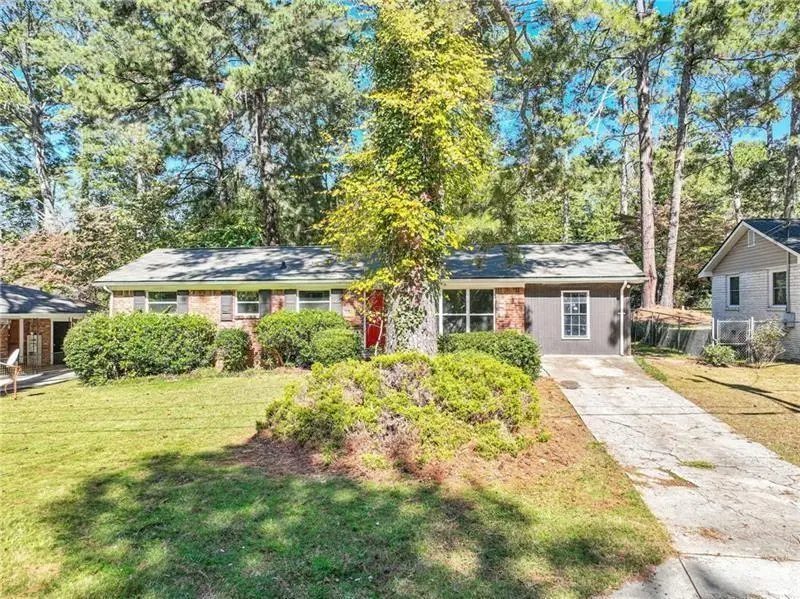
4639 Tell Rd SW · Atlanta, GA
Flood risk 1/10 · Minimal
- FEMA flood zone
- X (unshaded)
- Chance of flooding over 30 yrs
- 0.0%
- Est. flood insurance / yr
- $473 – $860
Fire risk 3/10 · Minor
- Est. fire insurance / yr
- $963 – $1,789
Heat risk 5/10 · Moderate
- Hot days now (above 103°F)
- 7 days/yr
- Hot days in 30 yrs
- 17 days/yr
Wind risk 5/10 · Moderate
- Chance of severe wind over 30 yrs
- 25.0%
Air-quality risk 3/10 · Minor
- Unhealthy air days now
- 3 days/yr
- Unhealthy air days in 30 yrs
- 3 days/yr
Risk factors via First Street. Map © Google.
Why this score? — see what drove the D grade
The composite is a weighted blend of 9 inputs, each scored 0–100. Each bar is that input's sub-score; the figure is the points it added to the 100-point composite (weight × sub-score).
- Cash flow +12.0/30.0
- ARV discount +10.6/15.0
- Livability +4.2/5.0
- DSCR +3.6/10.0
- 1% rule +3.2/10.0
- Rent growth +3.2/5.0
- Schools +2.7/10.0
- Condition / age +2.5/5.0
- Appreciation +0.0/10.0
$215,000
🖨 Deal sheet 📄 Offer letter ✓ Due diligence
Listing remarks MLS
Welcome to this beautifully renovated 4-bedroom, 2-bathroom home offering the perfect blend of comfort, space, and style. Nestled in a quiet Atlanta neighborhood, this charming four-sided brick residence features a bright, open floor plan filled with natural light. The updated kitchen is perfect for everyday living and entertaining, while the expansive private backyard offers the ideal setting for weekend gatherings or relaxing evenings under the stars. With fresh curb appeal and timeless character, this home is truly move-in ready. Conveniently located near shopping, schools, and major highways, you'll enjoy easy access to everything Atlanta has to offer. Don't miss your opportunity to own in one of Atlanta's established neighborhoods-schedule your tour today!
Key facts
- Easy commute
- Fresh curb appeal
- Updated kitchen
Tags
Property features AI
Exterior
- Utilities: Public water; Septic sewer; Other electric
- Home design: One-level home; Resale property
- Construction: Brick 4 sides construction; Other roof
- Exterior features: Fenced yard; Patio
Interior
- Kitchen: Solid surface countertops; Dishwasher; Gas cooktop; Gas oven; Refrigerator
- Bedrooms: Four main-level bedrooms; Primary suite on the main level
- Flooring: Other flooring
- Bathrooms: Two full bathrooms; Primary bathroom with shower (no tub)
- Heating & cooling: Central heating; Other cooling
- Interior features: No shared/common walls; Other interior features
- Laundry & utility: Other laundry features
Neighborhood map
What this means for you Summary
Snapshot
- This is a 3-bed/1.5-bath single-family listed at $215k.
Deal economics
- At list price, monthly cash flow is $-50 ($-604/yr) — negative.
- To cash-flow at today's rent, offer at most $206k (4.1% below list).
- To meet the 1% rule (rent ≥ 1% of price), the offer needs to be $175k (18.4% below list).
- Recommended offer: $175k (18.4% below list) — sets the bar for 1% rule.
- Cap rate 6.0% vs local median 3.1% in Atlanta — top-decile yield for the area; either an underpriced asset or a hidden risk that comps aren't pricing in. Stress-test before assuming the spread holds.
Location & tenants
- Location reads 83/100 on livability (#6 in GA, #919 nationally) — a professional / high-income tenant draw. Strengths: amenities A+, commute A+, housing A+; Watch: schools C-, cost of living C-.
- Atlanta Public Schools (urban): math 28% / reading 35% proficiency, ranked #80 of 174 in GA (top 46%) — families likely to look elsewhere, expect single-tenant / working-renter base with shorter leases; 71% free/reduced lunch — lower-income household profile, screen leases tightly.
- Market conditions: Rents rising (+2.6%/yr); 483 active listings in the ZIP; 12 comparable units currently listed for rent nearby; rentals at typical pace (median 22d on market — plan ~3-4 weeks tenant-placement turnaround); 11,565 units permitted in Fulton County in 2024 (8,159 in 5+ unit buildings).
- This rent runs 34% of the median local income ($63k/yr) — at the standard rent-burdened threshold; future hikes will face affordability resistance.
Forward outlook
- Local home prices are declining (-3.0%/yr); year-one equity from $1k of loan paydown is wiped out by about $6k of value loss. Plan a longer hold.
- Fulton County population projected at +38% by 2050 — long-run rental-demand tailwind backs the buy-and-hold thesis.
Negotiation context
- It's been on market 44 days — a 3% lower offer ($209k) is reasonable based on typical stale-listing flexibility.
- 19 sale attempts since 6y ago with the ask held roughly flat each time — persistent listings suggest the price (not the market) is what's stuck; bring a comps-based counter.
Risks & watch-outs
- Climate carrying-cost: moderate wind risk, 25% chance of damaging wind over 30y; extreme-heat days projected 7→17/yr by 2055 (HVAC capex compounding) — expect insurance premiums to compound above CPI over the hold.
Questions for the listing agent
- What do current leases actually rent for vs. the listed asking? Can we see a recent rent roll and the last 12 months of T-12 income?
- It's been on market 44 days. Have you received any prior offers? Is the seller open to a 18% concession, seller financing, or rate buy-down credit?
- Built in 1965 — when were the roof, HVAC, electrical panel, plumbing, and water heater last replaced?
- Is there a deadline driving the sale (1031 exchange, divorce, estate, relocation)? That informs how much negotiation room exists.
- The area grade is low — what's the realistic commute time and amenity access for the typical tenant pool here? Any planned neighborhood developments (good or bad) we should know about?
- What's the average days-on-market for RENTAL listings here right now (not sales)? A rising rental-DOM trend means longer vacancies and softer asking-rent achievability than the comps imply.
- What's the recent tenant-quality profile in this submarket — average credit score on applications, eviction rate, late-payment / NSF rate, and stable-employment percentage? A property-management company in the area should have these aggregated.
- How much new for-sale + rental construction is in the pipeline within 1–3 miles? Heavy new supply typically softens prices + rents 12–24 months out; constrained supply supports both.
Investment metrics
- 1% rule
- 0.82% ✗
- Cap rate
- 6.01%
- Cash-on-cash
- -1.00%
- DSCR
- 0.96
- GRM
- 10.2
CMA / ARV
- ARV (median comp)
- $231,020
- List price
- $215,000
- Delta
- -6.93%
- Verdict
- FAIR
- Comps
- 20 within 1.0 mi
Show comp detail 12 sales within ~0.75 mi
| Address | Dist | Beds/Ba | Sqft | Sold | Price | $/sf | Match |
|---|---|---|---|---|---|---|---|
| 4415 Greenleaf Cir SW | 0.08mi | 3/2.0 | 1,500 (+3%) | 22mo | $318,000 | $212 | 70 |
| 2494 Fairway Cir SW | 0.43mi | 3/2.0 | 1,368 (-6%) | 0mo | $234,999 | $172 | 68 |
| 4572 Sahara Dr SW | 0.34mi | 3/2.0 | 1,328 (-8%) | 9mo | $220,000 | $166 | 60 |
| 4728 Apache Trl SW | 0.37mi | 3/1.5 | 1,269 (-12%) | 5mo | $185,000 | $146 | 58 |
| 4748 Carson Pass SW | 0.45mi | 3/1.5 | 1,269 (-12%) | 7mo | $195,000 | $154 | 52 |
| 4628 Tucson Trl SW | 0.63mi | 3/2.0 | 1,568 (+8%) | 4mo | $185,000 | $118 | 52 |
| 2392 Ozark Trl SW | 0.67mi | 3/2.5 | 1,356 (-6%) | 3mo | $170,000 | $125 | 52 |
| 4732 Carson Pass SW | 0.43mi | 4/1.5 (+1) | 1,269 (-12%) | 4mo | $192,000 | $151 | 51 |
| 4485 Pamela Ln SW | 0.36mi | 4/3.0 (+1) | 1,430 (-1%) | 23mo | $310,000 | $217 | 51 |
| 4554 Saint Andrews Dr | 0.43mi | 4/2.0 (+1) | 1,560 (+8%) | 14mo | $180,000 | $115 | 49 |
| 2521 County Line Rd SW | 0.48mi | 4/2.0 (+1) | 1,368 (-6%) | 22mo | $269,999 | $197 | 43 |
| 2236 Fairway Cir SW | 0.49mi | 4/2.0 (+1) | 1,600 (+10%) | 20mo | $330,000 | $206 | 36 |
Match score weights: distance 35% · size 25% · config 20% · recency 20%. Top-matched comps best support the ARV.
Projected returns pro-forma
-3.0% appreciation · 2.63% rent growth · sell at horizon
- IRR
- -18.4%
- Equity multiple
- 0.36×
- Total profit
- $-38,699
- Equity at exit
- $32,057
- IRR
- -11.4%
- Equity multiple
- 0.33×
- Total profit
- $-40,492
- Equity at exit
- $18,589
Cash invested: $60,200 (down + closing). Projections, not guarantees.
Landlord ↔ Tenant lean methodology
- Overall (STATE)
- 90 Strongly Landlord-Friendly
- State Georgia
- 90 Strongly Landlord-Friendly · R+3
- County
- — inherits STATE
- City
- — inherits STATE
ZIP-level market 30331
- Home prices YoY
- -34.2%
- Rents YoY
- 2.6%
- Active inventory
- 483
- Price-to-rent
- 10.2×
Monthly cashflow live
- Estimated rent
- $1,755 high interval (Pro) →
- Mortgage (P&I)
- −$1,127
- Tax from tax record
- −$220 /mo · $2,635/yr
- Insurance
- −$90
- HOA
- −$0
- Vacancy / Maint / Mgmt
- −$369
- Net cashflow
- $-50
Break-even live
UW: 25.0% down · 7.5% · 30yr · 1.5% tax · 5.0% vac · 8.0% maint · 8.0% mgmt
Financing live
Cash to close
- Down payment
- $53,750
- Closing costs
- $6,450
- Reserves months
- —
- Total cash needed
- —
Loan-product check · same deal, 3 products live
Conventional
25% down · 7.5% · 30yr
- Down + closing
- —
- Monthly P&I
- —
- Monthly cashflow
- —
- DSCR
- —
- Eligible?
- —
Personal DTI + credit; lowest rate.
DSCR
20% down · 8.5% · 30yr
- Down + closing
- —
- Monthly P&I
- —
- Monthly cashflow
- —
- DSCR
- —
- Eligible?
- —
No personal income docs; deal must DSCR.
Hard money
10% down · 12.0% · 12mo
- Down + closing
- —
- Monthly P&I
- —
- Monthly cashflow
- —
- DSCR
- —
- Eligible?
- —
Short-term bridge; refi at stabilization.
Rent comps 12 comps
| Address | Beds | Baths | Sqft | Rent | $/sqft | DOM | Units | Dist |
|---|---|---|---|---|---|---|---|---|
| 4596 Sahara Dr SW Atlanta, GA | 4.0 | 1.5 | 1375 | $1,500 | $1.09 | 4d | 1 | 0.32mi |
| 4596 Sahara Dr SW Atlanta, GA | 4.0 | 1.5 | 1475 | $1,200 | $0.81 | 24d | 1 | 0.32mi |
| 4545 Sahara Dr SW Atlanta, GA | 3.0 | 2.0 | 1075 | $1,665 | $1.55 | 5d | 1 | 0.39mi |
| 4515 Doral Dr SW Atlanta, GA | 3.0 | 1.5 | 1184 | $1,700 | $1.44 | 15d | 1 | 0.54mi |
| 2356 County Line Rd SW Atlanta, GA | 3.0 | 1.0 | 1360 | $1,695 | $1.25 | 24d | 1 | 0.78mi |
| 4687 Camp Creek Pkwy SW Atlanta, GA | 1.0–3.0 | 1.0–2.0 | 1235 | $1,958 | $1.59 | 1d | 18 | 0.99mi |
| 4058 Blanton Ave SW Atlanta, GA | 4.0 | 2.0 | 1476 | $1,750 | $1.19 | 17d | 1 | 1.26mi |
| 2243 Butner Rd Unit NA Atlanta, GA | 4.0 | 2.5 | 1518 | $2,350 | $1.55 | 24d | 1 | 1.28mi |
| 4211 Campbellton Rd SW Atlanta, GA | 3.0 | 2.0 | 1384 | $2,050 | $1.48 | 22d | 1 | 1.31mi |
| 2211 Butner Rd SW Atlanta, GA | 4.0 | 2.0 | 1336 | $1,875 | $1.40 | 24d | 1 | 1.34mi |
| 2111 Kimberly Rd SW Atlanta, GA | 2.0 | 1.0 | 996 | $1,600 | $1.61 | 8d | 1 | 1.42mi |
| 4037 Braxton Pl SW Unit 4037 Atlanta, GA | 4.0 | 3.0 | 1397 | $2,100 | $1.50 | 24d | 1 | 1.48mi |
Listing history 50 events
-
2026-06-18days on market $215,000 Active 44 DOM
-
2026-06-17days on market $215,000 Active 43 DOM
-
2026-06-16days on market $215,000 Active 42 DOM
-
2026-06-15days on market $215,000 Active 41 DOM
-
2026-06-13days on market $215,000 Active 39 DOM
-
2026-06-13days on market $215,000 Active 38 DOM
-
2026-06-09days on market $215,000 Active 35 DOM
-
2026-06-08days on market $215,000 Active 34 DOM
-
2026-06-07days on market $215,000 Active 33 DOM
-
2026-06-04days on market $215,000 Active 30 DOM
-
2026-06-03days on market $215,000 Active 29 DOM
-
2026-06-02days on market $215,000 Active 28 DOM
-
2026-06-01days on market $215,000 Active 27 DOM
-
2026-05-31days on market $215,000 Active 26 DOM
-
2026-05-05$215,000 New 771-char remark
Show marketing remark (771 chars)
Welcome to this beautifully renovated 4-bedroom, 2-bathroom home offering the perfect blend of comfort, space, and style. Nestled in a quiet Atlanta neighborhood, this charming four-sided brick residence features a bright, open floor plan filled with natural light. The updated kitchen is perfect for everyday living and entertaining, while the expansive private backyard offers the ideal setting for weekend gatherings or relaxing evenings under the stars. With fresh curb appeal and timeless character, this home is truly move-in ready. Conveniently located near shopping, schools, and major highways, you'll enjoy easy access to everything Atlanta has to offer. Don't miss your opportunity to own in one of Atlanta's established neighborhoods-schedule your tour today!
-
2026-05-05$215,000 Active 801-char remark
Show marketing remark (771 chars)
Welcome to this beautifully renovated 4-bedroom, 2-bathroom home offering the perfect blend of comfort, space, and style. Nestled in a quiet Atlanta neighborhood, this charming four-sided brick residence features a bright, open floor plan filled with natural light. The updated kitchen is perfect for everyday living and entertaining, while the expansive private backyard offers the ideal setting for weekend gatherings or relaxing evenings under the stars. With fresh curb appeal and timeless character, this home is truly move-in ready. Conveniently located near shopping, schools, and major highways, you'll enjoy easy access to everything Atlanta has to offer. Don't miss your opportunity to own in one of Atlanta's established neighborhoods-schedule your tour today!
-
2026-04-17status Back On Market
-
2026-04-17historical
-
2026-02-04status Under Contract
-
2025-08-31historical
-
2025-07-18historical Active Under Contract
-
2025-07-18historical Active Under Contract
-
2025-07-18historical $2,150
-
2025-07-16historical
-
2025-07-10price $220,000
-
2025-07-10price $220,000
-
2025-06-11price $2,150
-
2025-06-10price $230,000
-
2025-06-10price $230,000
-
2025-06-03price $239,000
-
2025-06-03price $239,000
-
2025-05-19$240,000 New
-
2025-05-19$240,000 Active
-
2025-05-14price $2,200
-
2025-05-07price $2,300
-
2025-04-19$2,450
-
2025-01-31historical
-
2025-01-31historical
-
2024-12-09status Active
-
2024-12-09status Back On Market
-
2024-12-08status Pending
-
2024-12-02historical Active Under Contract
-
2024-12-01status Pending
-
2024-11-25historical Active Under Contract
-
2024-11-25historical Active Under Contract
-
2024-11-12status Back On Market
-
2024-11-12status Active
-
2024-11-08historical Active Under Contract
-
2024-11-08historical Active Under Contract
-
2024-11-06status Back On Market
ⓘ Source: listings_history table (triggers on properties + properties_extension) + one-shot
backfill from property_details.listing_events for pre-trigger history.
Tax reassessment forecast GA · Resets to sale price
- Current annual tax
- $2,635 · $220/mo
- Projected year-2 tax
- $2,635 · $220/mo
- Expected delta
- $0/yr ($0/mo · 0.0%)
ⓘ Screening estimate from a state-policy table — verify with the county assessor before closing.
Climate risk First Street
- Flood 1/10 Low FEMA zone X (unshaded) · 0% chance over 30 yrs
- Wildfire 3/10 Moderate
- Heat 5/10 Major 7 d/yr ≥103°F today · 17 d/yr by 30 yrs out
- Wind 5/10 Major 25% chance of damaging wind over 30 yrs
- Air quality 3/10 Moderate 3 unhealthy d/yr today · 3 by 30 yrs out
Nearby sold comps map
Loading sold comps map…
Walkable amenities ~0.75 mi
Loading nearby amenities…
Taxation est. · year 1
- Rental income
- $21,057
- − Mortgage interest
- −$12,043
- − Property taxes
- −$2,635
- − Insurance
- −$1,075
- − Repairs & maintenance
- −$1,685
- − Management
- −$1,685
- − Depreciation
- −$6,255
- Taxable loss
- −$4,319
- Est. tax savings @ 24.0%
- +$1,037
- After-tax cash flow
- $433/yr
For passive investors: Depreciation is non-cash, so a rental often shows a tax loss while cash-flowing — sheltering income. Rental losses are passive: they offset passive income freely, and up to $25,000/yr can offset ordinary (W-2) income if you actively participate and your MAGI is under $100k (phasing out to $0 by $150k); unused losses carry forward. On sale, claimed depreciation is recaptured at up to 25%, and gains may owe capital-gains tax (a 1031 exchange can defer both). Figures are a year-1 estimate at your 24.0% rate — not tax advice; consult a CPA.
Schools (NCES district)
- District
- Atlanta Public Schools
- NCES district ID
- 1300120
- Math proficiency
- 28% ▼ -6.00%
- Reading proficiency
- 35% ▼ -2.00%
- Median HH income
- $48,306
- Composite
- 27.27/100
- National rank
- #7006
- State rank
- #80 of 174 in GA
Livability — Atlanta
- Score
- 83/100
- State rank
- #6
- US rank
- #919
Category grades
Schools grade is shown separately in the Schools card above.
Census & demographics
- Census place
- Atlanta, GA
- County
- Fulton County · 1,094,430 people
- City population
- 629,525
- Metro
- Atlanta-Sandy Springs-Alpharetta, GA
- Population (ZIP)
- 62,567
- Household income
- $62,623
- Rent vs Own
- Severe rent burden
- 3748.0
Population outlook (Fulton County) Hauer SSP2
- Today (2025)
- 1,203,707 people
- By 2030
- 1,299,706 · +8.0%
- By 2040
- 1,488,256 · +23.6%
- By 2050
- 1,664,580 · +38.3%
- By 2075
- 2,036,072 · +69.2%
- By 2100
- 2,222,402 · +84.6%
Race, ethnicity, and origin ACS 2023
- Neighborhood character
- Predominantly Black (94%)
- Race & ethnicity
- Black 94% Two or more races 3% Hispanic / Latino 2%
- Common ancestry
- Hispanic 1%
- Foreign-born
- 4% · Canada
- Languages at home
- 95% English-only · Spanish 1% French/Haitian/Cajun 1%
Political lean MEDSL · Fulton
- 2024 margin
- Solid D (+44.9) · D 71.9% · R 27.0% · Other 1.1%
- 2008→2024 swing
- +9.8pp toward D · 2008: 35.0pp · 2024: 44.9pp
- All cycles
- 2024: D+44.9 2020: D+46.4 2016: D+42.1 2012: D+29.6 2008: D+35.0
Not yet ingested
- Civics
- —
Market trends
- HPI YoY
- ▼ -106.38%
- Current HPI
- 204.5402
- Rent YoY
- ▲ 2.63%
- Metro
- Atlanta-Sandy Springs-Alpharetta, GA
- State GDP YoY
- ▲ 2.66%
- F500 in state
- 28
Industry mix (Fortune 500 HQ in GA)
| Industry | F500 HQs | Revenue |
|---|---|---|
| Paper / Packaging | 2 | $29B |
|
||
| Retail | 1 | $160B |
|
||
| Transportation / Logistics | 1 | $91B |
|
||
| Airlines | 1 | $62B |
|
||
| Consumer Goods | 1 | $47B |
|
||
| Utilities | 1 | $25B |
|
||
Price history
+400.0% since first listed61 events — show timeline
- 2026-05-05 Listed $215,000 FMLS
- 2026-05-05 Listed $215,000 GAMLS
- 2026-04-17 Relisted — GAMLS
- 2026-04-17 Listing Removed — GAMLS
- 2026-02-04 Pending — GAMLS
- 2025-08-31 Listing Removed — GAMLS
- 2025-07-18 Contingent — GAMLS
- 2025-07-18 Contingent — FMLS
- 2025-07-18 Rental Removed $2,150 GAMLS
- 2025-07-16 Listing Removed — FMLS
- 2025-07-10 Price Changed $220,000 GAMLS
- 2025-07-10 Price Changed $220,000 FMLS
- 2025-06-11 Price Changed $2,150 GAMLS
- 2025-06-10 Price Changed $230,000 FMLS
- 2025-06-10 Price Changed $230,000 GAMLS
- 2025-06-03 Price Changed $239,000 FMLS
- 2025-06-03 Price Changed $239,000 GAMLS
- 2025-05-19 Listed $240,000 FMLS
- 2025-05-19 Listed $240,000 GAMLS
- 2025-05-14 Price Changed $2,200 GAMLS
- 2025-05-07 Price Changed $2,300 GAMLS
- 2025-04-19 Listed for Rent $2,450 GAMLS
- 2025-01-31 Listing Removed — GAMLS
- 2025-01-31 Listing Removed — FMLS
- 2024-12-09 Relisted — FMLS
- 2024-12-09 Relisted — GAMLS
- 2024-12-08 Pending — FMLS
- 2024-12-02 Contingent — FMLS
- 2024-12-01 Pending — FMLS
- 2024-11-25 Contingent — FMLS
- 2024-11-25 Contingent — GAMLS
- 2024-11-12 Relisted — GAMLS
- 2024-11-12 Relisted — FMLS
- 2024-11-08 Contingent — GAMLS
- 2024-11-08 Contingent — FMLS
- 2024-11-06 Relisted — GAMLS
- 2024-11-06 Relisted — FMLS
- 2024-10-28 Contingent — FMLS
- 2024-10-28 Contingent — GAMLS
- 2024-10-21 Price Changed $204,900 FMLS
- 2024-10-21 Price Changed $204,900 GAMLS
- 2024-10-21 Listed $225,000 GAMLS
- 2024-10-21 Listed $225,000 FMLS
- 2023-07-05 Sold (Public Records) $211,200 Public Records
- 2023-06-26 Sold (MLS) $211,200 FMLS
- 2023-06-26 Sold (MLS) $211,200 GAMLS
- 2023-05-31 Pending — GAMLS
- 2023-05-28 Pending — FMLS
- 2023-05-20 Contingent — FMLS
- 2023-05-18 Relisted — FMLS
- 2023-05-10 Contingent — FMLS
- 2023-04-12 Listing Removed — GAMLS
- 2023-04-07 Listed $230,000 GAMLS
- 2023-04-07 Listed $230,000 FMLS
- 2023-04-07 Listed $230,000 GAMLS
- 2020-05-08 Sold (MLS) $95,000 GAMLS
- 2020-03-31 Pending — GAMLS
- 2020-03-03 Listed $100,000 GAMLS
- 1998-09-29 Sold (Public Records) $69,900 Public Records
- 1989-12-27 Sold (Public Records) $68,100 Public Records
- 1983-01-31 Sold (Public Records) $43,000 Public Records
Property tax history
+8.4%/yrLatest (2025): $2,635 · -19.7% YoY. Source: county tax records.
Cash-flow waterfall
monthlySold comps — $/sqft
last 12 mo · ≤1 miLoading sold comps…