4771 Palmetto Ter · Estero, FL
Flood risk 9/10 · Severe
- FEMA flood zone
- AE
- Chance of flooding over 30 yrs
- 0.99%
- Est. flood insurance / yr
- $1,737 – $8,500
Fire risk 3/10 · Minor
- Est. fire insurance / yr
- $947 – $1,759
Heat risk 10/10 · Severe
- Hot days now (above 107°F)
- 7 days/yr
- Hot days in 30 yrs
- 29 days/yr
Wind risk 10/10 · Severe
- Chance of severe wind over 30 yrs
- 99.0%
Air-quality risk 3/10 · Minor
- Unhealthy air days now
- 2 days/yr
- Unhealthy air days in 30 yrs
- 2 days/yr
Risk factors via First Street. Map © Google.
Why this score? — see what drove the D+ grade
The composite is a weighted blend of 9 inputs, each scored 0–100. Each bar is that input's sub-score; the figure is the points it added to the 100-point composite (weight × sub-score).
- Cash flow +23.1/30.0
- DSCR +7.4/10.0
- 1% rule +5.3/10.0
- Schools +4.1/10.0
- Livability +4.0/5.0
- Condition / age +2.5/5.0
- Rent growth +2.1/5.0
- ARV discount +0.0/15.0
- Appreciation +0.0/10.0
$529,000
🖨 Deal sheet 📄 Offer letter ✓ Due diligence
Listing remarks
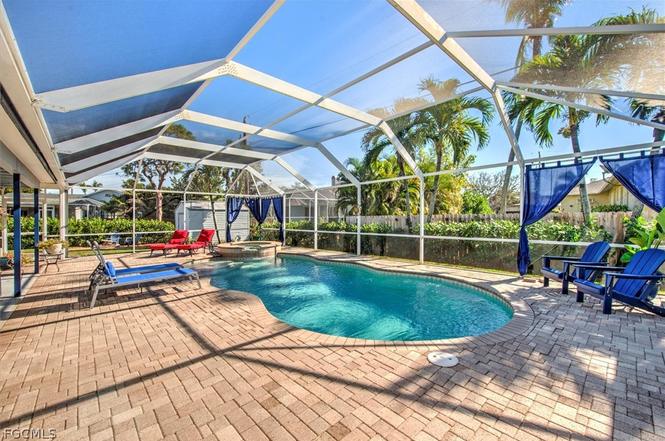
Tucked inside the hidden boating community of Estero River Heights, this beautifully updated pool home offers the laid-back Southwest Florida lifestyle so many buyers are searching for. Imagine launching your boat just around the corner and spending the day cruising the Estero River to the Gulf, exploring nearby islands, fishing the back bays, or enjoying waterfront dining — all just minutes from home. Back at home, unwind beneath mature oak trees in your private heated pool and hot tub, or open the home completely to the outdoors with three pocketing sliders and a pass-through kitchen window designed for effortless indoor-outdoor living. Whether hosting poolside gatherings, enjoying
Key facts
- Private heated pool
- Open floor plan
- Hot tub
Tags
Property features AI
Finance
- Financial info: Pets allowed
- HOA & community: Annual association fee of $300 (includes recreation facilities); Community amenities: basketball court, boat dock, boat ramp, barbecue, picnic area, playground, park; Boat facilities
Exterior
- Parking: Attached 1-car garage with garage door opener; Detached carport (1 space); 2 covered parking spaces
- Security: Smoke detector(s)
- Utilities: Well water; Septic tank; Cable available; High-speed internet available
- Home design: Single-story; Entry level: 1; Faces northwest; Resale property
- Construction: Block, concrete, and stucco construction; Tile roof; Built on a concrete foundation
- Exterior features: Fire pit; Security/high-impact doors; Automatic sprinklers; Lanai; Porch; Screened porch
Interior
- Kitchen: Dishwasher; Disposal; Icemaker; Microwave; Range; Self-cleaning oven; Refrigerator; Refrigerator with ice maker; Water purifier
- Bedrooms: Main level primary bedroom; Bedroom on main level
- Flooring: Vinyl
- Bathrooms: 2 full bathrooms
- Heating & cooling: Central heating (electric, heat pump); Central air; Ceiling fan(s)
- Interior features: Breakfast bar; Built-in features; Living/dining room; Kitchen island; Pantry; Main level primary bedroom; Bedroom on main level; Walk-in closet(s); Shower only with separate shower; Window treatments; Workshop
- Laundry & utility: Washer; Dryer; Inside laundry; Laundry tub; Water softener
Neighborhood map
What this means for you Summary
Snapshot
- This is a 3-bed/2.0-bath single-family listed at $529k.
Deal economics
- At list price, monthly cash flow is $519 ($6k/yr) — positive.
- The deal already cash-flows at list — no discount required.
- Meets the 1% rule at list price ($5k rent vs $529k).
- Recommended offer: $481k (9.0% below list) — sets the bar for market timing.
- Cap rate 8.4% vs local median 3.4% in Estero — top-decile yield for the area; either an underpriced asset or a hidden risk that comps aren't pricing in. Stress-test before assuming the spread holds.
Location & tenants
- Location reads 79/100 on livability (#149 in FL, #2,242 nationally) — a middle-class / working-renter tenant base. Strengths: crime A+, employment A+, housing A+; Watch: amenities F, commute F, cost of living D-.
- Lee (suburban): math 47% / reading 50% proficiency, ranked #42 of 73 in FL (top 58%) — families likely to look elsewhere, expect single-tenant / working-renter base with shorter leases.
- Market conditions: Rents soft (-1.4%/yr); 668 active listings in the ZIP; 12 comparable units currently listed for rent nearby; rentals at typical pace (median 24d on market — plan ~3-4 weeks tenant-placement turnaround); solid renter incomes; 15,411 units permitted in Lee County in 2024 (4,686 in 5+ unit buildings).
- At $5,468/mo this rent would consume 64% of the median local household income ($103k/yr) (locally 606% of renters already pay >50% of income on rent) — very limited rent-growth headroom before tenants either downsize or default.
Forward outlook
- Local home prices are declining (-3.0%/yr); year-one equity from $4k of loan paydown is wiped out by about $16k of value loss. Plan a longer hold.
- Lee County population projected at +44% by 2050 — long-run rental-demand tailwind backs the buy-and-hold thesis.
Negotiation context
- It's been on market 99 days — a 9% lower offer ($481k) is reasonable based on typical stale-listing flexibility.
- 6 sale attempts with the ask held roughly flat each time — persistent listings suggest the price (not the market) is what's stuck; bring a comps-based counter.
- Current owner paid $350k; list at $529k implies a 51% gain — meaningful room to come down on a strong offer.
Risks & watch-outs
- Watch-outs: flood insurance adds $427/mo.
- Climate carrying-cost: in FEMA flood zone AE (mandatory federal flood insurance); severe wind risk, 99% chance of damaging wind over 30y; extreme-heat days projected 7→29/yr by 2055 (HVAC capex compounding) — expect insurance premiums to compound above CPI over the hold.
Questions for the listing agent
- It's been on market 99 days. Have you received any prior offers? Is the seller open to a 9% concession, seller financing, or rate buy-down credit?
- Built in 1974 — when were the roof, HVAC, electrical panel, plumbing, and water heater last replaced?
- What's the actual annual flood-insurance premium (NFIP or private), and is the property in a SFHA with mandatory coverage?
- What does the HOA fee cover, when was the last increase, and are there any pending special assessments or reserve-fund shortfalls?
- Why hasn't it sold? Are there any deal-killer items the seller is aware of (foundation, flood, title, zoning, code violations)?
- Is there a deadline driving the sale (1031 exchange, divorce, estate, relocation)? That informs how much negotiation room exists.
- Schools are A-rated — typically a magnet for longer-tenancy family renters. What's the average tenant stay here, and is there a school-zone premium baked into asking?
- The area grade is low — what's the realistic commute time and amenity access for the typical tenant pool here? Any planned neighborhood developments (good or bad) we should know about?
- What's the average days-on-market for RENTAL listings here right now (not sales)? A rising rental-DOM trend means longer vacancies and softer asking-rent achievability than the comps imply.
- What's the recent tenant-quality profile in this submarket — average credit score on applications, eviction rate, late-payment / NSF rate, and stable-employment percentage? A property-management company in the area should have these aggregated.
- How much new for-sale + rental construction is in the pipeline within 1–3 miles? Heavy new supply typically softens prices + rents 12–24 months out; constrained supply supports both.
Investment metrics
- 1% rule
- 1.03% ✓
- Cap rate
- 8.44%
- Cash-on-cash
- 7.66%
- DSCR
- 1.34
- GRM
- 8.1
CMA / ARV
- ARV (on-the-fly)
- $420,993
- Comps found
- 1
Show comp detail 1 sale within ~0.75 mi
| Address | Dist | Beds/Ba | Sqft | Sold | Price | $/sf | Match |
|---|---|---|---|---|---|---|---|
| 4937 Royal Palm Dr | 0.17mi | 2/2.0 (-1) | 1,530 (-5%) | 1mo | $399,000 | $261 | 77 |
Match score weights: distance 35% · size 25% · config 20% · recency 20%. Top-matched comps best support the ARV.
Projected returns pro-forma
-3.0% appreciation · 0.0% rent growth · sell at horizon
- IRR
- -13.3%
- Equity multiple
- 0.54×
- Total profit
- $-68,535
- Equity at exit
- $78,876
- IRR
- -10.1%
- Equity multiple
- 0.47×
- Total profit
- $-78,370
- Equity at exit
- $45,738
Cash invested: $148,120 (down + closing). Projections, not guarantees.
Landlord ↔ Tenant lean methodology
- Overall (STATE)
- 87 Strongly Landlord-Friendly
- State Florida
- 87 Strongly Landlord-Friendly · R+3
- County
- — inherits STATE
- City
- — inherits STATE
ZIP-level market 33928
- Rents YoY
- -1.4%
- Active inventory
- 668
- Price-to-rent
- 8.1×
Monthly cashflow live
- Estimated rent
- $5,468 high interval (Pro) →
- Mortgage (P&I)
- −$2,774
- Tax from tax record
- −$355 /mo · $4,261/yr
- Insurance
- −$220
- Flood insurance flood zone
- −$427 /mo · $5,118/yr
- HOA
- −$25
- Vacancy / Maint / Mgmt
- −$1,148
- Net cashflow
- $519
Break-even live
UW: 25.0% down · 7.5% · 30yr · 1.5% tax · 5.0% vac · 8.0% maint · 8.0% mgmt
Financing live
Cash to close
- Down payment
- $132,250
- Closing costs
- $15,870
- Reserves months
- —
- Total cash needed
- —
Loan-product check · same deal, 3 products live
Conventional
25% down · 7.5% · 30yr
- Down + closing
- —
- Monthly P&I
- —
- Monthly cashflow
- —
- DSCR
- —
- Eligible?
- —
Personal DTI + credit; lowest rate.
DSCR
20% down · 8.5% · 30yr
- Down + closing
- —
- Monthly P&I
- —
- Monthly cashflow
- —
- DSCR
- —
- Eligible?
- —
No personal income docs; deal must DSCR.
Hard money
10% down · 12.0% · 12mo
- Down + closing
- —
- Monthly P&I
- —
- Monthly cashflow
- —
- DSCR
- —
- Eligible?
- —
Short-term bridge; refi at stabilization.
Rent comps 12 comps
| Address | Beds | Baths | Sqft | Rent | $/sqft | DOM | Units | Dist |
|---|---|---|---|---|---|---|---|---|
| 5000 Royal Shores Dr #101 Estero, FL | 3.0 | 3.0 | 2060 | $10,000 | $4.85 | 23d | 1 | 0.46mi |
| 19500 Marsh Point Run #201 Estero, FL | 3.0 | 2.0 | 2044 | $5,000 | $2.45 | 23d | 1 | 0.48mi |
| 4640 Turnberry Lake Dr #403 Estero, FL | 2.0 | 2.0 | 1207 | $5,500 | $4.56 | 23d | 1 | 0.84mi |
| 4761 W Bay Blvd #703 Estero, FL | 3.0 | 3.0 | 2150 | $9,000 | $4.19 | 23d | 1 | 0.86mi |
| 4761 W Bay Blvd Unit 1545976P Estero, FL | 3.0 | 3.0 | 1743 | $4,994 | $2.87 | 14d | 1 | 0.86mi |
| 20151 Ian Ct #201 Estero, FL | 2.0 | 2.0 | 1429 | $3,000 | $2.10 | 23d | 1 | 0.87mi |
| 4751 W Bay Blvd #402 Estero, FL | 3.0 | 3.0 | 1608 | $7,500 | $4.66 | 15d | 1 | 0.90mi |
| 4751 W Bay Blvd #402 Estero, FL | 3.0 | 3.0 | 1608 | $7,500 | $4.66 | 23d | 1 | 0.90mi |
| 3783 Pino Vista Way #201 Estero, FL | 3.0 | 2.0 | 1523 | $3,300 | $2.17 | 23d | 1 | 1.00mi |
| 3702 Pino Vista Way #3 Estero, FL | 3.0 | 2.0 | 1610 | $2,300 | $1.43 | 3d | 1 | 1.14mi |
| 3610 Lansing Loop #103 Estero, FL | 3.0 | 2.5 | 1917 | $2,800 | $1.46 | 3d | 1 | 1.32mi |
| 3535 Cherry Blossom Ct #102 Estero, FL | 3.0 | 2.5 | 1917 | $2,900 | $1.51 | 23d | 1 | 1.47mi |
HOA detail
- Monthly dues
- $25 · $300/yr
- Likely covers
- waterpool
Listing history 29 events
-
2026-06-16statusdays on market $529,000 Pending 99 DOM
-
2026-06-15days on market $529,000 Active 98 DOM
-
2026-06-13days on market $529,000 Active 96 DOM
-
2026-06-10days on market $529,000 Active 93 DOM
-
2026-06-09days on market $529,000 Active 92 DOM
-
2026-06-07days on market $529,000 Active 90 DOM
-
2026-06-02days on market $529,000 Active 85 DOM
-
2026-06-01days on market $529,000 Active 84 DOM
-
2026-06-01days on market $529,000 Active 83 DOM
-
2026-05-14price $529,000
-
2026-04-26status Active
-
2026-04-24historical
-
2026-03-29status Active
-
2026-03-27historical
-
2026-03-05$539,000 Active
-
2025-09-17historical
-
2025-08-13status Active
-
2025-08-09historical
-
2025-07-18$549,500 Active
-
2025-06-16historical
-
2025-05-15price $549,500
-
2025-05-12price $569,900
-
2025-04-27price $574,900
-
2025-03-25price $599,900
-
2025-03-03price $624,000
-
2025-02-18price $639,000
-
2025-01-31$639,789 Active
-
2021-04-09soldstatus $350,000
-
1997-12-01soldstatus $95,000
ⓘ Source: listings_history table (triggers on properties + properties_extension) + one-shot
backfill from property_details.listing_events for pre-trigger history.
Tax reassessment forecast FL · Resets to sale price
- Current annual tax
- $4,261 · $355/mo
- Projected year-2 tax
- $4,391 · $366/mo
- Expected delta
- +$130/yr (+$11/mo · 3.0%)
ⓘ Screening estimate from a state-policy table — verify with the county assessor before closing.
Climate risk First Street
- Flood 9/10 Extreme FEMA zone AE · 99% chance over 30 yrs
- Wildfire 3/10 Moderate
- Heat 10/10 Extreme 7 d/yr ≥107°F today · 29 d/yr by 30 yrs out
- Wind 10/10 Extreme 99% chance of damaging wind over 30 yrs
- Air quality 3/10 Moderate 2 unhealthy d/yr today · 2 by 30 yrs out
Nearby sold comps map
Loading sold comps map…
Walkable amenities ~0.75 mi
Loading nearby amenities…
Taxation est. · year 1
- Rental income
- $65,619
- − Mortgage interest
- −$29,632
- − Property taxes
- −$4,261
- − Insurance
- −$7,764
- − Repairs & maintenance
- −$5,250
- − Management
- −$5,250
- − HOA
- −$300
- − Depreciation
- −$15,389
- Taxable loss
- −$2,226
- Est. tax savings @ 24.0%
- +$534
- After-tax cash flow
- $6,759/yr
For passive investors: Depreciation is non-cash, so a rental often shows a tax loss while cash-flowing — sheltering income. Rental losses are passive: they offset passive income freely, and up to $25,000/yr can offset ordinary (W-2) income if you actively participate and your MAGI is under $100k (phasing out to $0 by $150k); unused losses carry forward. On sale, claimed depreciation is recaptured at up to 25%, and gains may owe capital-gains tax (a 1031 exchange can defer both). Figures are a year-1 estimate at your 24.0% rate — not tax advice; consult a CPA.
Schools (NCES district)
- District
- Lee
- NCES district ID
- 1201080
- Math proficiency
- 47% ▼ -11.00%
- Reading proficiency
- 50% ▼ -4.00%
- Median HH income
- $49,518
- Composite
- 41.49/100
- National rank
- #3458
- State rank
- #42 of 73 in FL
Livability — Estero
- Score
- 79/100
- State rank
- #149
- US rank
- #2242
Category grades
Schools grade is shown separately in the Schools card above.
Census & demographics
- Census place
- Estero, FL
- County
- Lee County · 788,662 people
- City population
- 31,926
- Metro
- Cape Coral-Fort Myers, FL
- Population (ZIP)
- 31,926
- Household income
- $102,624
- Rent vs Own
- Severe rent burden
- 606.0
Population outlook (Lee County) Hauer SSP2
- Today (2025)
- 871,946 people
- By 2030
- 955,468 · +9.6%
- By 2040
- 1,113,587 · +27.7%
- By 2050
- 1,256,891 · +44.1%
- By 2075
- 1,560,270 · +78.9%
- By 2100
- 1,726,848 · +98.0%
Race, ethnicity, and origin ACS 2023
- Neighborhood character
- Predominantly White (85%)
- Race & ethnicity
- White 85% Hispanic / Latino 8% Two or more races 7% Asian 3% Black 1%
- Hispanic origin (detail)
- Mexican 2% Puerto Rican 2% Cuban 1%
- Common ancestry
- Romanian 5% Lithuanian 3% Slovak 2%
- Foreign-born
- 11% · Canada, China, Jamaica
- Languages at home
- 90% English-only · Spanish 5% Other Indo-European 1% French/Haitian/Cajun 1%
Political lean MEDSL · Lee
- 2024 margin
- Strong R (+28.4) · D 35.5% · R 63.9%
- 2008→2024 swing
- -18.0pp toward R · 2008: -10.4pp · 2024: -28.4pp
- All cycles
- 2024: R+28.4 2020: R+19.2 2016: R+20.4 2012: R+16.6 2008: R+10.4
Not yet ingested
- Civics
- —
Market trends
- HPI YoY
- ▼ -109.49%
- Current HPI
- 197.5913
- Rent YoY
- ▼ -1.42%
- Metro
- Cape Coral-Fort Myers, FL
- State GDP YoY
- ▲ 3.28%
- F500 in state
- 36
Industry mix (Fortune 500 HQ in FL)
| Industry | F500 HQs | Revenue |
|---|---|---|
| Industrial Technology | 2 | $29B |
|
||
| Insurance | 2 | $17B |
|
||
| Retail | 1 | $60B |
|
||
| Technology Distribution | 1 | $58B |
|
||
| Homebuilding | 1 | $35B |
|
||
| Technology Manufacturing | 1 | $35B |
|
||
Price history
+456.8% since first listed20 events — show timeline
- 2026-05-14 Price Changed $529,000 FORTMLS
- 2026-04-26 Relisted — FORTMLS
- 2026-04-24 Listing Removed — FORTMLS
- 2026-03-29 Relisted — FORTMLS
- 2026-03-27 Listing Removed — FORTMLS
- 2026-03-05 Listed $539,000 FORTMLS
- 2025-09-17 Listing Removed — FORTMLS
- 2025-08-13 Relisted — FORTMLS
- 2025-08-09 Listing Removed — FORTMLS
- 2025-07-18 Listed $549,500 FORTMLS
- 2025-06-16 Listing Removed — FORTMLS
- 2025-05-15 Price Changed $549,500 FORTMLS
- 2025-05-12 Price Changed $569,900 FORTMLS
- 2025-04-27 Price Changed $574,900 FORTMLS
- 2025-03-25 Price Changed $599,900 FORTMLS
- 2025-03-03 Price Changed $624,000 FORTMLS
- 2025-02-18 Price Changed $639,000 FORTMLS
- 2025-01-31 Listed $639,789 FORTMLS
- 2021-04-09 Sold (Public Records) $350,000 Public Records
- 1997-12-01 Sold (Public Records) $95,000 Public Records
Property tax history
+10.8%/yrLatest (2025): $4,261 · +3.9% YoY. Source: county tax records.
Cash-flow waterfall
monthlySold comps — $/sqft
last 12 mo · ≤1 miLoading sold comps…