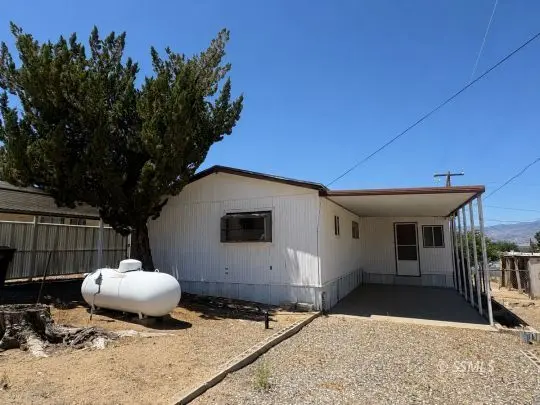
5371 Piute Mountain Rd · Weldon, CA
Flood risk 1/10 · Minimal
- FEMA flood zone
- X (unshaded)
- Chance of flooding over 30 yrs
- 0.0%
- Est. flood insurance / yr
- $507 – $1,088
Fire risk 8/10 · Major
- Est. fire insurance / yr
- $659 – $1,223
Heat risk 7/10 · Major
- Hot days now (above 99°F)
- 6 days/yr
- Hot days in 30 yrs
- 17 days/yr
Wind risk 1/10 · Minimal
- Chance of severe wind over 30 yrs
- —
Air-quality risk 9/10 · Severe
- Unhealthy air days now
- 18 days/yr
- Unhealthy air days in 30 yrs
- 22 days/yr
Risk factors via First Street. Map © Google.
Why this score? — see what drove the C+ grade
The composite is a weighted blend of 9 inputs, each scored 0–100. Each bar is that input's sub-score; the figure is the points it added to the 100-point composite (weight × sub-score).
- Cash flow +23.3/30.0
- Appreciation +9.3/10.0
- DSCR +7.5/10.0
- ARV discount +7.5/15.0
- 1% rule +5.5/10.0
- Schools +2.9/10.0
- Rent growth +2.5/5.0
- Condition / age +2.5/5.0
- Livability +2.4/5.0
$95,000
🖨 Deal sheet (PDF) 📄 Offer letter ✓ Due diligence
Listing remarks
Welcome to quiet country living in Weldon! This 3 bedroom, 2 bathroom single wide manufactured home is priced to sell and offers incredible potential for a primary residence, vacation getaway, or investment opportunity. Cash only sale. The home features wheelchair accessibility, a spacious primary bedroom with a walk-in closet, and a functional layout with plenty of natural light throughout. The property is fully fenced with plenty of parking for boats, RVs, and additional vehicles. Enjoy peaceful surroundings and beautiful mountain desert scenery in this quiet location. When the lake is full, you can even enjoy lake views from the backyard! Outside, you'll find covered parking and room to
Key facts
- Outdoor recreation
- Fully fenced
- Covered parking
Tags
Property features AI
Finance
- Other: Zoning: E(.5)MH
- Financial info: No financial details provided
- HOA & community: HOA information not specified
Exterior
- Parking: Parking details not specified
- Security: No specific security features listed
- Utilities: Cable available; Propane; Septic tank
- Home design: Manufactured single-wide residential home; One story; Accessible entrance; Facing direction not specified
- Construction: Shingle roof; Slab foundation; Construction year not specified
- Exterior features: Exterior lighting; Covered patio; Fenced yard; Shed(s); RV/Boat storage; Landscaped lot; Has a view
Interior
- Kitchen: Dishwasher; Disposal; Gas oven; Gas range; Refrigerator
- Bedrooms: Bedrooms not specified
- Flooring: Carpet; Vinyl
- Bathrooms: 2 full bathrooms
- Heating & cooling: Central air; Wall unit(s)
- Interior features: Central vacuum; Walk-in closet(s); High-speed internet; Window coverings
- Laundry & utility: Washer and dryer included
Neighborhood map
What this means for you Summary
Snapshot
- This is a 2-bed/1.0-bath manufactured listed at $95k.
Deal economics
- At list price, monthly cash flow is $174 ($2k/yr) — positive.
- The deal already cash-flows at list — no discount required.
- Meets the 1% rule at list price ($993 rent vs $95k).
- Recommended offer: $94k (1.5% below list) — sets the bar for market timing.
- Cap rate 8.5% vs local median 5.0% in Weldon — top-decile yield for the area; either an underpriced asset or a hidden risk that comps aren't pricing in. Stress-test before assuming the spread holds.
Location & tenants
- Location reads 48/100 on livability (#1,218 in CA) — a working-class tenant base; expect higher turnover. Strengths: cost of living A-, housing B+; Watch: amenities F, commute F, employment F.
- South Fork Union (rural): math 25% / reading 40% proficiency, ranked #1,016 of 1,400 in CA (top 73%) — families likely to look elsewhere, expect single-tenant / working-renter base with shorter leases; 67% free/reduced lunch — lower-income household profile, screen leases tightly.
- Zoned schools: South Fork Elementary (344 students, 71% FRL) — zoned schools at 71% FRL track the district average.
- Market conditions: 41 active listings in the ZIP; 3,244 units permitted in Kern County in 2024 (73 in 5+ unit buildings).
Forward outlook
- In year one you build about $9k of equity ($657 loan paydown + $8k appreciation (8.7% local appreciation)).
- Kern County population projected at +17% by 2050 — long-run rental-demand tailwind backs the buy-and-hold thesis.
- At projected returns (8.7% appreciation + 3.0% rent growth), your $27k cash investment doubles in ~3 years — after that, you're playing with house money.
- By year 4, paydown + projected appreciation supports a ~$31k cash-out refi (75% LTV) — recoverable capital for the next deal without selling this one.
Negotiation context
- It's been on market 25 days — a 2% lower offer ($94k) is reasonable based on typical stale-listing flexibility.
- Current owner paid $10k; list at $95k implies a 850% gain — meaningful room to come down on a strong offer.
Risks & watch-outs
- Climate carrying-cost: severe wildfire risk; extreme-heat days projected 6→17/yr by 2055 (HVAC capex compounding) — expect insurance premiums to compound above CPI over the hold.
Questions for the listing agent
- Built in 1969 — when were the roof, HVAC, electrical panel, plumbing, and water heater last replaced?
- Is there a deadline driving the sale (1031 exchange, divorce, estate, relocation)? That informs how much negotiation room exists.
- Schools are F-rated, which usually means shorter tenancies and higher turnover. Who's the typical renter profile here, and what's been the actual vacancy rate?
- What's the average days-on-market for RENTAL listings here right now (not sales)? A rising rental-DOM trend means longer vacancies and softer asking-rent achievability than the comps imply.
- What's the recent tenant-quality profile in this submarket — average credit score on applications, eviction rate, late-payment / NSF rate, and stable-employment percentage? A property-management company in the area should have these aggregated.
- How much new for-sale + rental construction is in the pipeline within 1–3 miles? Heavy new supply typically softens prices + rents 12–24 months out; constrained supply supports both.
Investment metrics
- 1% rule
- 1.05% ✓
- Cap rate
- 8.49%
- Cash-on-cash
- 7.85%
- DSCR
- 1.35
- GRM
- 8.0
CMA / ARV
- ARV (on-the-fly)
- $50,000
- Comps found
- 3
Show comp detail 3 sales within ~0.75 mi
| Address | Dist | Beds/Ba | Sqft | Sold | Price | $/sf | Match |
|---|---|---|---|---|---|---|---|
| 5664 Piute Mountain Rd | 0.29mi | 2/1.0 | 900 (-10%) | 2mo | $58,800 | $65 | 68 |
| 5696 Isabel Dr | 0.34mi | 2/1.0 | 924 (-8%) | 9mo | $46,500 | $50 | 64 |
| 5651 Hooper Rd | 0.30mi | 1/1.0 (-1) | 1,128 (+13%) | 11mo | $34,000 | $30 | 50 |
Match score weights: distance 35% · size 25% · config 20% · recency 20%. Top-matched comps best support the ARV.
Projected returns pro-forma
8.65% appreciation · 3.0% rent growth · sell at horizon
- IRR
- 27.3%
- Equity multiple
- 3.04×
- Total profit
- $54,203
- Equity at exit
- $76,427
- IRR
- 24.3%
- Equity multiple
- 6.61×
- Total profit
- $149,328
- Equity at exit
- $155,954
Cash invested: $26,600 (down + closing). Projections, not guarantees.
Landlord ↔ Tenant lean methodology
- Overall (STATE)
- 18 Strongly Tenant-Friendly
- State California
- 18 Strongly Tenant-Friendly · D+13
- County
- — inherits STATE
- City
- — inherits STATE
ZIP-level market 93283
- Home prices YoY
- 1.9%
- Active inventory
- 41
- Price-to-rent
- 8.0×
Monthly cashflow live
- Estimated rent
- $993 medium interval (Pro) →
- Mortgage (P&I)
- −$498
- Tax from tax record
- −$73 /mo · $871/yr
- Insurance
- −$40
- HOA
- −$0
- Vacancy / Maint / Mgmt
- −$209
- Net cashflow
- $174
Break-even live
Sensitivity live
| Price | -10% $228 | -5% $201 | +0% $174 | +5% $147 | +10% $120 |
|---|---|---|---|---|---|
| Rent | -10% $96 | -5% $135 | +0% $174 | +5% $213 | +10% $252 |
| Rate | -1.0pp $222 | -0.5pp $198 | base $174 | +0.5pp $149 | +1.0pp $124 |
UW: 25.0% down · 7.5% · 30yr · 1.5% tax · 5.0% vac · 8.0% maint · 8.0% mgmt
Financing live
Cash to close
- Down payment
- $23,750
- Closing costs
- $2,850
- Reserves months
- —
- Total cash needed
- —
Loan-product check · same deal, 3 products live
Conventional
25% down · 7.5% · 30yr
- Down + closing
- —
- Monthly P&I
- —
- Monthly cashflow
- —
- DSCR
- —
- Eligible?
- —
Personal DTI + credit; lowest rate.
DSCR
20% down · 8.5% · 30yr
- Down + closing
- —
- Monthly P&I
- —
- Monthly cashflow
- —
- DSCR
- —
- Eligible?
- —
No personal income docs; deal must DSCR.
Hard money
10% down · 12.0% · 12mo
- Down + closing
- —
- Monthly P&I
- —
- Monthly cashflow
- —
- DSCR
- —
- Eligible?
- —
Short-term bridge; refi at stabilization.
Listing history 19 events
-
2026-06-19days on market $95,000 Active 25 DOM
-
2026-06-18days on market $95,000 Active 24 DOM
-
2026-06-17days on market $95,000 Active 23 DOM
-
2026-06-16days on market $95,000 Active 22 DOM
-
2026-06-15days on market $95,000 Active 21 DOM
-
2026-06-14days on market $95,000 Active 19 DOM
-
2026-06-12days on market $95,000 Active 18 DOM
-
2026-06-10days on market $95,000 Active 16 DOM
-
2026-06-09days on market $95,000 Active 15 DOM
-
2026-06-08days on market $95,000 Active 14 DOM
-
2026-06-07days on market $95,000 Active 13 DOM
-
2026-06-05days on market $95,000 Active 11 DOM
-
2026-06-05days on market $95,000 Active 10 DOM
-
2026-06-03days on market $95,000 Active 9 DOM
-
2026-06-02days on market $95,000 Active 8 DOM
-
2026-06-01days on market $95,000 Active 7 DOM
-
2026-05-31days on market $95,000 Active 6 DOM
-
2026-05-21$95,000 Active
-
2004-10-08soldstatus $10,000
ⓘ Source: listings_history table (triggers on properties + properties_extension) + one-shot
backfill from property_details.listing_events for pre-trigger history.
Tax reassessment forecast CA · Resets to sale price
- Current annual tax
- $871 · $73/mo
- Projected year-2 tax
- $871 · $73/mo
- Expected delta
- $0/yr ($0/mo · 0.0%)
ⓘ Screening estimate from a state-policy table — verify with the county assessor before closing.
Climate risk First Street
- Flood 1/10 Low FEMA zone X (unshaded) · 0% chance over 30 yrs
- Wildfire 8/10 Severe
- Heat 7/10 Severe 6 d/yr ≥99°F today · 17 d/yr by 30 yrs out
- Wind 1/10 Low
- Air quality 9/10 Extreme 18 unhealthy d/yr today · 22 by 30 yrs out
Nearby sold comps map
Loading sold comps map…
Walkable amenities ~0.75 mi
Loading nearby amenities…
Taxation est. · year 1
- Rental income
- $11,915
- − Mortgage interest
- −$5,321
- − Property taxes
- −$871
- − Insurance
- −$475
- − Repairs & maintenance
- −$953
- − Management
- −$953
- − Depreciation
- −$2,764
- Taxable income
- $577
- Est. tax owed @ 24.0%
- −$139
- After-tax cash flow
- $1,950/yr
For passive investors: Depreciation is non-cash, so a rental often shows a tax loss while cash-flowing — sheltering income. Rental losses are passive: they offset passive income freely, and up to $25,000/yr can offset ordinary (W-2) income if you actively participate and your MAGI is under $100k (phasing out to $0 by $150k); unused losses carry forward. On sale, claimed depreciation is recaptured at up to 25%, and gains may owe capital-gains tax (a 1031 exchange can defer both). Figures are a year-1 estimate at your 24.0% rate — not tax advice; consult a CPA.
Schools (NCES district)
- District
- South Fork Union
- NCES district ID
- 0637470
- Math proficiency
- 25% ▲ 5.00%
- Reading proficiency
- 40% ▲ 5.00%
- Median HH income
- $32,532
- Composite
- 29.31/100
- National rank
- #11836
- State rank
- #1016 of 1400 in CA
Livability — Weldon
- Score
- 48/100
- State rank
- #1218
- US rank
- #26156
Category grades
Schools grade is shown separately in the Schools card above.
Census & demographics
- Census place
- Weldon, CA
- Population (ZIP)
- 2,129
Population outlook (Kern County) Hauer SSP2
- Today (2025)
- 947,286 people
- By 2030
- 978,984 · +3.3%
- By 2040
- 1,045,018 · +10.3%
- By 2050
- 1,105,232 · +16.7%
- By 2075
- 1,229,538 · +29.8%
- By 2100
- 1,238,059 · +30.7%
Race, ethnicity, and origin ACS 2023
- Neighborhood character
- Predominantly White (86%)
- Race & ethnicity
- White 86% Hispanic / Latino 11% Two or more races 7% Native American 2%
- Hispanic origin (detail)
- Mexican 7%
- Common ancestry
- Lithuanian 13% Iranian 1%
- Foreign-born
- 17% · Canada
- Languages at home
- 93% English-only · Spanish 7%
Political lean MEDSL · Kern
- 2024 margin
- Strong R (+21.1) · D 38.2% · R 59.3% · Other 2.5%
- 2008→2024 swing
- -3.3pp toward R · 2008: -17.8pp · 2024: -21.1pp
- All cycles
- 2024: R+21.1 2020: R+10.2 2016: R+15.0 2012: R+20.9 2008: R+17.8
Not yet ingested
- Civics
- —
Market trends
- HPI YoY
- ▲ 8.65%
- Current HPI
- 468.8712
- Rent YoY
- —
- Metro
- —
- State GDP YoY
- ▲ 3.21%
- F500 in state
- 116
Industry mix (Fortune 500 HQ in CA)
| Industry | F500 HQs | Revenue |
|---|---|---|
| Technology | 27 | $1,492B |
|
||
| Financial Services | 3 | $174B |
|
||
| Retail | 3 | $44B |
|
||
| Insurance | 3 | $26B |
|
||
| Media / Entertainment | 2 | $115B |
|
||
| Pharmaceuticals / Biotech | 2 | $62B |
|
||
Price history
+850.0% since first listed2 events — show timeline
- 2026-05-21 Listed $95,000 SSMLS
- 2004-10-08 Sold (Public Records) $10,000 Public Records
Property tax history
+9.3%/yrLatest (2025): $871 · +2.0% YoY. Source: county tax records.
Cash-flow waterfall
monthlySold comps — $/sqft
last 12 mo · ≤1 miLoading sold comps…