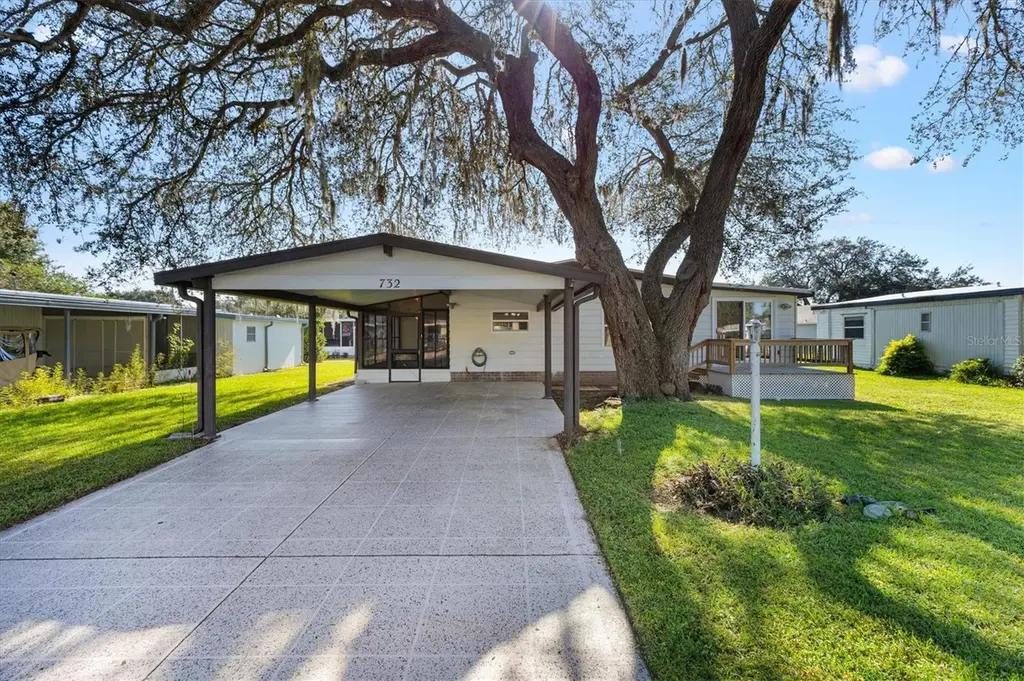
732 Royal Palm Ave · Lady Lake, FL
Flood risk 1/10 · Minimal
- FEMA flood zone
- X (unshaded)
- Chance of flooding over 30 yrs
- 0.0%
- Est. flood insurance / yr
- $507 – $1,088
Fire risk 4/10 · Minor
- Est. fire insurance / yr
- $947 – $1,759
Heat risk 9/10 · Severe
- Hot days now (above 109°F)
- 7 days/yr
- Hot days in 30 yrs
- 21 days/yr
Wind risk 9/10 · Severe
- Chance of severe wind over 30 yrs
- 99.0%
Air-quality risk 3/10 · Minor
- Unhealthy air days now
- 2 days/yr
- Unhealthy air days in 30 yrs
- 4 days/yr
Risk factors via First Street. Map © Google.
Why this score? — see what drove the D grade
The composite is a weighted blend of 9 inputs, each scored 0–100. Each bar is that input's sub-score; the figure is the points it added to the 100-point composite (weight × sub-score).
- Cash flow +12.8/30.0
- ARV discount +7.5/15.0
- 1% rule +4.5/10.0
- Schools +4.2/10.0
- DSCR +3.8/10.0
- Rent growth +3.5/5.0
- Livability +3.5/5.0
- Condition / age +2.5/5.0
- Appreciation +0.0/10.0
$219,900
🖨 Deal sheet (PDF) 📄 Offer letter ✓ Due diligence
Listing remarks
TURNKEY • 3 BEDROOMS • NO BOND • GREAT LOCATION This 3-bedroom, turnkey home with NO BOND delivers the perfect mix of value, comfort, and convenience in The Villages—ready for immediate enjoyment. Ideally located just a short golf cart ride to Spanish Springs Town Square, Orange Blossom Hills Golf & Country Club, and UF Health The Villages Hospital, plus shopping, dining, and everyday essentials. Inside, you’ll find a freshly remodeled and painted living/dining area with durable laminate flooring and an open, inviting feel. The kitchen features NEW appliances and a pantry, offering both style and function. Step outside and enjoy a spacious deck and oversi
Key facts
- 5,400 sq ft lot
- 2 parking spots
- Built 1984
Property features AI
Finance
- Other: Total acreage: less than 1/4 acre; Lot size approximately 0.12 acres; Living area reported as 1,100 (public records); building area reported as 1,500; Floor number: 1; Unit is on one level; Home warranty: No
- Financial info: Lease restrictions apply; Furnished
- HOA & community: Community has street lights; Senior community; Pets allowed with breed restrictions; CDD present; Association fee requirement: None; Total monthly community fees reported
Exterior
- Parking: Carport with 2 spaces
- Utilities: Public water; Public sewer; Electricity available and connected; Cable available and connected; High-speed internet / broadband available; Phone available; Fire hydrant nearby; Underground utilities
- Home design: Manufactured double-wide home; One story; Faces northwest; Completed condition; Located in The Villages community
- Construction: Vinyl siding; Shingle roof; Block foundation; Built by The Villages
- Exterior features: Deck; Front porch; Exterior lighting; Sliding doors; Irrigation equipment; Asphalt road access
Interior
- Kitchen: Dishwasher; Range; Microwave; Refrigerator; Solid surface counters
- Bedrooms: 3 bedrooms
- Flooring: Laminate
- Bathrooms: 2 full bathrooms
- Heating & cooling: Electric heating; Central air conditioning
- Interior features: Ceiling fans; Living room / dining room combo; Open floorplan; Solid surface counters; Vaulted ceilings
- Laundry & utility: Laundry room; Outside laundry access; Washer; Dryer
Neighborhood map
What this means for you Summary
Snapshot
- This is a 3-bed/2.0-bath manufactured listed at $220k.
Deal economics
- At list price, monthly cash flow is $-21 ($-247/yr) — negative.
- To cash-flow at today's rent, offer at most $216k (1.7% below list).
- To meet the 1% rule (rent ≥ 1% of price), the offer needs to be $209k (5.0% below list).
- Recommended offer: $209k (5.0% below list) — sets the bar for 1% rule.
- Cap rate 6.2% vs local median 4.1% in Lady Lake — top-decile yield for the area; either an underpriced asset or a hidden risk that comps aren't pricing in. Stress-test before assuming the spread holds.
Location & tenants
- Location reads 69/100 on livability (#457 in FL) — a middle-class / working-renter tenant base. Strengths: cost of living A+, housing A+, health & safety A-; Watch: employment D, amenities F, commute F.
- Lake (suburban): math 49% / reading 50% proficiency, ranked #37 of 73 in FL (top 51%) — families likely to look elsewhere, expect single-tenant / working-renter base with shorter leases.
- Zoned schools: The Villages Elementary of Lady Lake School (math 63% / reading 61%, grade B, #608 of 2,144 statewide, top 29%, 761 students, 61% FRL); Carver Middle School (math 41% / reading 41%, grade F, #353 of 571 statewide, top 63%, 837 students, 65% FRL); Leesburg High School (math 24% / reading 32%, grade F, #464 of 667 statewide, top 70%, 1,641 students, 58% FRL).
- Market conditions: Rents rising fast (+4.0%/yr); 586 active listings in the ZIP; 22 comparable units currently listed for rent nearby; rentals at typical pace (median 26d on market — plan ~3-4 weeks tenant-placement turnaround); 4,799 units permitted in Lake County in 2024 (814 in 5+ unit buildings).
- This rent runs 43% of the median local income ($59k/yr) — at the standard rent-burdened threshold; future hikes will face affordability resistance.
Forward outlook
- Local home prices are declining (-3.0%/yr); year-one equity from $2k of loan paydown is wiped out by about $7k of value loss. Plan a longer hold.
- Lake County population projected at +37% by 2050 — long-run rental-demand tailwind backs the buy-and-hold thesis.
Negotiation context
- It's been on market 52 days — a 3% lower offer ($213k) is reasonable based on typical stale-listing flexibility.
- 2 sale attempts with the ask held roughly flat each time — persistent listings suggest the price (not the market) is what's stuck; bring a comps-based counter.
- Current owner paid $126k; list at $220k implies a 75% gain — meaningful room to come down on a strong offer.
Risks & watch-outs
- Climate carrying-cost: severe wind risk, 99% chance of damaging wind over 30y; extreme-heat days projected 7→21/yr by 2055 (HVAC capex compounding) — expect insurance premiums to compound above CPI over the hold.
Questions for the listing agent
- What do current leases actually rent for vs. the listed asking? Can we see a recent rent roll and the last 12 months of T-12 income?
- It's been on market 52 days. Have you received any prior offers? Is the seller open to a 5% concession, seller financing, or rate buy-down credit?
- What does the HOA fee cover, when was the last increase, and are there any pending special assessments or reserve-fund shortfalls?
- Is there a deadline driving the sale (1031 exchange, divorce, estate, relocation)? That informs how much negotiation room exists.
- Schools are B-rated — typically a magnet for longer-tenancy family renters. What's the average tenant stay here, and is there a school-zone premium baked into asking?
- The area grade is low — what's the realistic commute time and amenity access for the typical tenant pool here? Any planned neighborhood developments (good or bad) we should know about?
- What's the average days-on-market for RENTAL listings here right now (not sales)? A rising rental-DOM trend means longer vacancies and softer asking-rent achievability than the comps imply.
- What's the recent tenant-quality profile in this submarket — average credit score on applications, eviction rate, late-payment / NSF rate, and stable-employment percentage? A property-management company in the area should have these aggregated.
- How much new for-sale + rental construction is in the pipeline within 1–3 miles? Heavy new supply typically softens prices + rents 12–24 months out; constrained supply supports both.
Investment metrics
- 1% rule
- 0.95% ✗
- Cap rate
- 6.18%
- Cash-on-cash
- -0.40%
- DSCR
- 0.98
- GRM
- 8.8
CMA / ARV
- ARV (on-the-fly)
- $143,000
- Comps found
- 7
Show comp detail 7 sales within ~0.75 mi
| Address | Dist | Beds/Ba | Sqft | Sold | Price | $/sf | Match |
|---|---|---|---|---|---|---|---|
| 717 Truman Ave | 0.07mi | 2/2.0 (-1) | 1,152 (+5%) | 10mo | $150,000 | $130 | 76 |
| 524 Bonita Dr | 0.32mi | 2/2.0 (-1) | 1,144 (+4%) | 3mo | $176,000 | $154 | 71 |
| 713 Sharon Dr | 0.19mi | 2/2.0 (-1) | 1,008 (-8%) | 5mo | $197,000 | $195 | 68 |
| 1005 Matthew Ave | 0.36mi | 2/2.0 (-1) | 1,144 (+4%) | 12mo | $165,000 | $144 | 61 |
| 1012 Parker Pl | 0.65mi | 2/2.0 (-1) | 1,144 (+4%) | 10mo | $130,000 | $114 | 50 |
| 1004 Ann Ave | 0.44mi | 2/2.0 (-1) | 1,248 (+14%) | 6mo | $80,000 | $64 | 47 |
| 813 Saint Andrews Blvd | 0.69mi | 2/2.0 (-1) | 1,191 (+8%) | 6mo | $152,000 | $128 | 44 |
Match score weights: distance 35% · size 25% · config 20% · recency 20%. Top-matched comps best support the ARV.
Projected returns pro-forma
-3.0% appreciation · 4.03% rent growth · sell at horizon
- IRR
- -15.6%
- Equity multiple
- 0.44×
- Total profit
- $-34,630
- Equity at exit
- $32,788
- IRR
- -5.3%
- Equity multiple
- 0.64×
- Total profit
- $-22,167
- Equity at exit
- $19,013
Cash invested: $61,572 (down + closing). Projections, not guarantees.
Landlord ↔ Tenant lean methodology
- Overall (STATE)
- 87 Strongly Landlord-Friendly
- State Florida
- 87 Strongly Landlord-Friendly · R+3
- County
- — inherits STATE
- City
- — inherits STATE
ZIP-level market 32159
- Home prices YoY
- -16.0%
- Rents YoY
- 4.0%
- Active inventory
- 586
- Price-to-rent
- 8.8×
Monthly cashflow live
- Estimated rent
- $2,090 high interval (Pro) →
- Mortgage (P&I)
- −$1,153
- Tax from tax record
- −$223 /mo · $2,672/yr
- Insurance
- −$92
- HOA
- −$204
- Vacancy / Maint / Mgmt
- −$439
- Net cashflow
- $-21
Break-even live
Sensitivity live
| Price | -10% $104 | -5% $42 | +0% $-21 | +5% $-83 | +10% $-145 |
|---|---|---|---|---|---|
| Rent | -10% $-186 | -5% $-103 | +0% $-21 | +5% $62 | +10% $145 |
| Rate | -1.0pp $90 | -0.5pp $35 | base $-21 | +0.5pp $-78 | +1.0pp $-136 |
UW: 25.0% down · 7.5% · 30yr · 1.5% tax · 5.0% vac · 8.0% maint · 8.0% mgmt
Financing live
Cash to close
- Down payment
- $54,975
- Closing costs
- $6,597
- Reserves months
- —
- Total cash needed
- —
Loan-product check · same deal, 3 products live
Conventional
25% down · 7.5% · 30yr
- Down + closing
- —
- Monthly P&I
- —
- Monthly cashflow
- —
- DSCR
- —
- Eligible?
- —
Personal DTI + credit; lowest rate.
DSCR
20% down · 8.5% · 30yr
- Down + closing
- —
- Monthly P&I
- —
- Monthly cashflow
- —
- DSCR
- —
- Eligible?
- —
No personal income docs; deal must DSCR.
Hard money
10% down · 12.0% · 12mo
- Down + closing
- —
- Monthly P&I
- —
- Monthly cashflow
- —
- DSCR
- —
- Eligible?
- —
Short-term bridge; refi at stabilization.
Rent comps 22 comps
| Address | Beds | Baths | Sqft | Rent | $/sqft | DOM | Units | Dist |
|---|---|---|---|---|---|---|---|---|
| 1214 Dustin Dr Lady Lake, FL | 2.0 | 2.0 | 1040 | $1,400 | $1.35 | 25d | 1 | 0.15mi |
| 1222 Palmetto Dr Lady Lake, FL | 2.0 | 2.0 | 1248 | $1,700 | $1.36 | 25d | 1 | 0.45mi |
| 739 Heathrow Ave Lady Lake, FL | 2.0 | 2.0 | 1040 | $2,250 | $2.16 | 4d | 1 | 0.48mi |
| 1540 Hillcrest Dr Lady Lake, FL | 2.0 | 2.0 | 1200 | $1,600 | $1.33 | 25d | 1 | 0.66mi |
| 508 Tarrson Blvd Unit 1525263P Lady Lake, FL | 2.0 | 2.0 | 1011 | $1,262 | $1.25 | 14d | 1 | 0.66mi |
| 932 Chula Ct Lady Lake, FL | 2.0 | 2.0 | 1346 | $3,000 | $2.23 | 5d | 1 | 0.79mi |
| 943 Mendoza Blvd Lady Lake, FL | 2.0 | 2.0 | 1268 | $5,800 | $4.57 | 25d | 1 | 0.81mi |
| 1430 W Schwartz Blvd Lady Lake, FL | 2.0 | 2.0 | 1377 | $2,500 | $1.82 | 25d | 1 | 0.84mi |
| 1715 Pebble Beach Ln Lady Lake, FL | 2.0 | 2.0 | 1040 | $3,500 | $3.37 | 25d | 1 | 0.86mi |
| 715 Hudson Ln Lady Lake, FL | 3.0 | 2.0 | 1392 | $2,700 | $1.94 | 25d | 1 | 0.90mi |
| 1532 W Schwartz Blvd Lady Lake, FL | 2.0 | 2.0 | 1092 | $2,950 | $2.70 | 25d | 1 | 0.98mi |
| 1304 Santa Rosa Ct Lady Lake, FL | 2.0 | 2.0 | 1286 | $4,500 | $3.50 | 23d | 1 | 1.02mi |
| 909 Orchid St Lady Lake, FL | 2.0 | 1.0 | 936 | $1,600 | $1.71 | 25d | 1 | 1.05mi |
| 716 Dominguez Dr Lady Lake, FL | 2.0 | 2.0 | 1094 | $2,450 | $2.24 | 23d | 1 | 1.14mi |
| 1824 Marion County Rd Weirsdale, FL | 2.0 | 2.0 | 1064 | $1,500 | $1.41 | 25d | 1 | 1.16mi |
| 628 Dominguez Dr Lady Lake, FL | 2.0 | 2.0 | 1214 | $2,245 | $1.85 | 23d | 1 | 1.20mi |
| 1524 Martinez Dr Lady Lake, FL | 2.0 | 2.0 | 1199 | $2,095 | $1.75 | 23d | 1 | 1.29mi |
| 13740 Lead LN The Villages, FL | 1.0–3.0 | 1.0–2.0 | 1029 | $2,150 | $2.09 | 23d | 38 | 1.35mi |
| 13765 NE 136th Loop Lady Lake, FL | 1.0–3.0 | 1.0–2.0 | 1078 | $1,991 | $1.85 | 23d | 36 | 1.39mi |
| 1330 La Jolla Cir The Villages, FL | 2.0 | 2.0 | 1214 | $3,000 | $2.47 | 23d | 1 | 1.40mi |
| 323 Chula Vista Ave Lady Lake, FL | 2.0 | 2.0 | 1486 | $2,700 | $1.82 | 25d | 1 | 1.44mi |
| 613 Enconto St Unit 1525268P The Villages, FL | 2.0 | 2.0 | 1097 | $1,788 | $1.63 | 23d | 1 | 1.44mi |
HOA detail
- Monthly dues
- $204 · $2,448/yr
Listing history 21 events
-
2026-06-21days on market $219,900 Active 52 DOM
-
2026-06-18days on market $219,900 Active 49 DOM
-
2026-06-17days on market $219,900 Active 48 DOM
-
2026-06-16days on market $219,900 Active 47 DOM
-
2026-06-15days on market $219,900 Active 46 DOM
-
2026-06-13days on market $219,900 Active 44 DOM
-
2026-06-09days on market $219,900 Active 40 DOM
-
2026-06-08days on market $219,900 Active 39 DOM
-
2026-06-07days on market $219,900 Active 38 DOM
-
2026-06-04days on market $219,900 Active 35 DOM
-
2026-06-03days on market $219,900 Active 34 DOM
-
2026-06-02days on market $219,900 Active 33 DOM
-
2026-06-01days on market $219,900 Active 32 DOM
-
2026-05-31days on market $219,900 Active 31 DOM
-
2026-04-30$219,900 Active
-
2025-10-24$2,100
-
2019-10-31soldstatus $126,000
-
2015-11-19soldstatus $115,000
-
2008-11-25soldstatus $97,700
-
1998-07-21soldstatus $63,000
-
1995-11-28soldstatus $55,800
ⓘ Source: listings_history table (triggers on properties + properties_extension) + one-shot
backfill from property_details.listing_events for pre-trigger history.
Tax reassessment forecast FL · Resets to sale price
- Current annual tax
- $2,672 · $223/mo
- Projected year-2 tax
- $2,672 · $223/mo
- Expected delta
- $0/yr ($0/mo · 0.0%)
ⓘ Screening estimate from a state-policy table — verify with the county assessor before closing.
Climate risk First Street
- Flood 1/10 Low FEMA zone X (unshaded) · 0% chance over 30 yrs
- Wildfire 4/10 Moderate
- Heat 9/10 Extreme 7 d/yr ≥109°F today · 21 d/yr by 30 yrs out
- Wind 9/10 Extreme 99% chance of damaging wind over 30 yrs
- Air quality 3/10 Moderate 2 unhealthy d/yr today · 4 by 30 yrs out
Nearby sold comps map
Loading sold comps map…
Walkable amenities ~0.75 mi
Loading nearby amenities…
Taxation est. · year 1
- Rental income
- $25,077
- − Mortgage interest
- −$12,318
- − Property taxes
- −$2,672
- − Insurance
- −$1,100
- − Repairs & maintenance
- −$2,006
- − Management
- −$2,006
- − HOA
- −$2,448
- − Depreciation
- −$6,397
- Taxable loss
- −$3,870
- Est. tax savings @ 24.0%
- +$929
- After-tax cash flow
- $682/yr
For passive investors: Depreciation is non-cash, so a rental often shows a tax loss while cash-flowing — sheltering income. Rental losses are passive: they offset passive income freely, and up to $25,000/yr can offset ordinary (W-2) income if you actively participate and your MAGI is under $100k (phasing out to $0 by $150k); unused losses carry forward. On sale, claimed depreciation is recaptured at up to 25%, and gains may owe capital-gains tax (a 1031 exchange can defer both). Figures are a year-1 estimate at your 24.0% rate — not tax advice; consult a CPA.
Schools (NCES district)
- District
- Lake
- NCES district ID
- 1201050
- Math proficiency
- 49% ▼ -7.00%
- Reading proficiency
- 50% ▼ -4.00%
- Median HH income
- $46,632
- Composite
- 42.05/100
- National rank
- #3327
- State rank
- #37 of 73 in FL
Livability — Lady Lake
- Score
- 69/100
- State rank
- #457
- US rank
- #8302
Category grades
Schools grade is shown separately in the Schools card above.
Census & demographics
- County
- Lake County · 364,602 people
- City population
- 32,107
- Metro
- Orlando-Kissimmee-Sanford, FL
- Population (ZIP)
- 32,107
- Household income
- $58,518
- Rent vs Own
- Severe rent burden
- 1047.0
Population outlook (Lake County) Hauer SSP2
- Today (2025)
- 386,640 people
- By 2030
- 417,107 · +7.9%
- By 2040
- 476,676 · +23.3%
- By 2050
- 531,296 · +37.4%
- By 2075
- 648,303 · +67.7%
- By 2100
- 698,530 · +80.7%
Race, ethnicity, and origin ACS 2023
- Neighborhood character
- Predominantly White (86%)
- Race & ethnicity
- White 86% Hispanic / Latino 6% Two or more races 5% Black 4% Asian 1%
- Hispanic origin (detail)
- Puerto Rican 3%
- Common ancestry
- Romanian 4% Lithuanian 3% Slovak 3%
- Foreign-born
- 5% · Canada, Jamaica
- Languages at home
- 93% English-only · Spanish 4% German/W. Germanic 1% Other Indo-European 1%
Political lean MEDSL · Lake
- 2024 margin
- Strong R (+24.7) · D 37.3% · R 62.0%
- 2008→2024 swing
- -11.2pp toward R · 2008: -13.5pp · 2024: -24.7pp
- All cycles
- 2024: R+24.7 2020: R+20.0 2016: R+23.1 2012: R+17.1 2008: R+13.5
Not yet ingested
- Civics
- —
Market trends
- HPI YoY
- ▼ -45.24%
- Current HPI
- 237.6208
- Rent YoY
- ▲ 4.03%
- Metro
- Orlando-Kissimmee-Sanford, FL
- State GDP YoY
- ▲ 3.28%
- F500 in state
- 36
Industry mix (Fortune 500 HQ in FL)
| Industry | F500 HQs | Revenue |
|---|---|---|
| Industrial Technology | 2 | $29B |
|
||
| Insurance | 2 | $17B |
|
||
| Retail | 1 | $60B |
|
||
| Technology Distribution | 1 | $58B |
|
||
| Homebuilding | 1 | $35B |
|
||
| Technology Manufacturing | 1 | $35B |
|
||
Price history
+294.1% since first listed7 events — show timeline
- 2026-04-30 Listed $219,900 Stellar MLS as Distributed by MLS Grid
- 2025-10-24 Listed for Rent $2,100 STELLARMLS
- 2019-10-31 Sold (Public Records) $126,000 Public Records
- 2015-11-19 Sold (Public Records) $115,000 Public Records
- 2008-11-25 Sold (Public Records) $97,700 Public Records
- 1998-07-21 Sold (Public Records) $63,000 Public Records
- 1995-11-28 Sold (Public Records) $55,800 Public Records
Property tax history
+14.1%/yrLatest (2025): $2,672 · +10.0% YoY. Source: county tax records.
Cash-flow waterfall
monthlySold comps — $/sqft
last 12 mo · ≤1 miLoading sold comps…