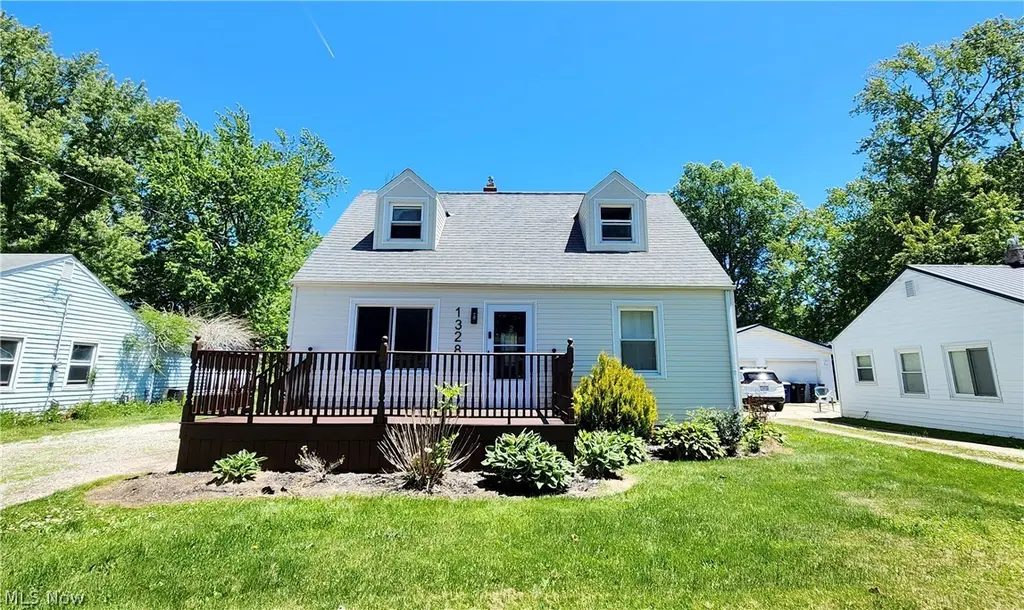
1328 Myrtle Ave · Ashtabula, OH
Flood risk 1/10 · Minimal
- FEMA flood zone
- X (unshaded)
- Chance of flooding over 30 yrs
- 0.0%
- Est. flood insurance / yr
- $507 – $1,088
Fire risk 1/10 · Minimal
- Est. fire insurance / yr
- $713 – $1,323
Heat risk 2/10 · Minimal
- Hot days now (above 93°F)
- 7 days/yr
- Hot days in 30 yrs
- 17 days/yr
Wind risk 1/10 · Minimal
- Chance of severe wind over 30 yrs
- —
Air-quality risk 3/10 · Minor
- Unhealthy air days now
- 2 days/yr
- Unhealthy air days in 30 yrs
- 5 days/yr
Risk factors via First Street. Map © Google.
Why this score? — see what drove the B- grade
The composite is a weighted blend of 9 inputs, each scored 0–100. Each bar is that input's sub-score; the figure is the points it added to the 100-point composite (weight × sub-score).
- Cash flow +30.0/30.0
- 1% rule +10.0/10.0
- DSCR +10.0/10.0
- ARV discount +5.8/15.0
- Livability +3.6/5.0
- Rent growth +2.5/5.0
- Condition / age +2.5/5.0
- Schools +2.4/10.0
- Appreciation +0.0/10.0
$160,000
🖨 Deal sheet (PDF) 📄 Offer letter ✓ Due diligence
Listing remarks MLS
Attention First Time Buyers and Empty Nesters. .. This Home is for you!!! New Flooring and newly painted Rooms. .. Move right into this 3 Bedroom Cape Cod which is Move In Ready and Cute as a Button!!! Updated Kitchen and Bath. .. Large Living Room with 2 Bedrooms on the first Floor and large Room Upstairs for 3rd Bedroom. Full Basement includes new H. W. Tank, Gas F. A. Furnace lots of Storage and Shower. This Cape Cod is situated on a large, deep Lot with a Concrete pad for a Garage or Shed. Home also includes a front Deck to sit and enjoy the Summer Days. Call for a tour of this Property!
Key facts
- Concrete pad
- Large backyard
- Eat-in kitchen
Tags
Property features AI
Exterior
- Parking: No garage; Unpaved parking
- Utilities: Public water; Public sewer
- Home design: 2-story home; Faces west
- Construction: Vinyl siding; Asphalt/fiberglass roof; Built per public records
- Exterior features: Deck; Cleared lot
Interior
- Kitchen: Range
- Bedrooms: 2 main-level bedrooms
- Bathrooms: 1 full bathroom (main level)
- Heating & cooling: Forced-air gas heating; Window cooling units
- Interior features: 6 total rooms; Full basement with sump pump
- Laundry & utility: Laundry located on lower level
Neighborhood map
What this means for you Summary
Snapshot
- This is a 3-bed/1.0-bath single-family listed at $160k.
Deal economics
- At list price, monthly cash flow is $982 ($12k/yr) — positive.
- The deal already cash-flows at list — no discount required.
- Meets the 1% rule at list price ($3k rent vs $160k).
- Recommended offer: $158k (1.5% below list) — sets the bar for market timing.
- Cap rate 13.7% vs local median 8.2% in Ashtabula — top-decile yield for the area; either an underpriced asset or a hidden risk that comps aren't pricing in. Stress-test before assuming the spread holds.
Location & tenants
- Location reads 71/100 on livability (#420 in OH) — a middle-class / working-renter tenant base. Strengths: cost of living A+, health & safety A+, housing A; Watch: amenities F, commute F, employment F.
- Ashtabula Area City (town): math 24% / reading 35% proficiency, ranked #588 of 656 in OH (top 90%) — low school quality limits family demand, transient renter base, plan for 1-2y turnover; 63% free/reduced lunch — lower-income household profile, screen leases tightly.
- Zoned schools: Superior Intermediate School (math 30% / reading 31%, grade F, #1,151 of 1,584 statewide, top 73%, 436 students, 0% FRL); Lakeside Junior High School (math 24% / reading 34%, grade F, #579 of 654 statewide, top 89%, 505 students, 0% FRL); Lakeside High School (math 12% / reading 37%, grade F, #644 of 781 statewide, top 85%, 894 students, 0% FRL) — zoned schools average 0% FRL vs 63% district-wide (63 pts lower); this property's tenant base skews higher-income than the district average.
- Market conditions: 169 active listings in the ZIP; 2 comparable units currently listed for rent nearby; 155 units permitted in Ashtabula County in 2024 (0 in 5+ unit buildings).
- At $2,553/mo this rent would consume 62% of the median local household income ($50k/yr) — very limited rent-growth headroom before tenants either downsize or default.
Forward outlook
- Local home prices are declining (-3.0%/yr); year-one equity from $1k of loan paydown is wiped out by about $5k of value loss. Plan a longer hold.
- Ashtabula County population projected at -22% by 2050 — secular population decline; favor cash flow + early exit over multi-decade hold.
- At projected returns (-3.0% appreciation + 3.0% rent growth), your $45k cash investment doubles in ~5 years — after that, you're playing with house money.
Negotiation context
- It's been on market 17 days — a 2% lower offer ($158k) is reasonable based on typical stale-listing flexibility.
- 5 sale attempts since 11y ago with the ask held roughly flat each time — persistent listings suggest the price (not the market) is what's stuck; bring a comps-based counter.
Risks & watch-outs
- Watch-outs: built in 1955 — expect roof / HVAC / electrical / plumbing capex.
Questions for the listing agent
- Built in 1955 — when were the roof, HVAC, electrical panel, plumbing, and water heater last replaced?
- Is there a deadline driving the sale (1031 exchange, divorce, estate, relocation)? That informs how much negotiation room exists.
- What's the average days-on-market for RENTAL listings here right now (not sales)? A rising rental-DOM trend means longer vacancies and softer asking-rent achievability than the comps imply.
- What's the recent tenant-quality profile in this submarket — average credit score on applications, eviction rate, late-payment / NSF rate, and stable-employment percentage? A property-management company in the area should have these aggregated.
- How much new for-sale + rental construction is in the pipeline within 1–3 miles? Heavy new supply typically softens prices + rents 12–24 months out; constrained supply supports both.
Investment metrics
- 1% rule
- 1.60% ✓
- Cap rate
- 13.66%
- Cash-on-cash
- 26.31%
- DSCR
- 2.17
- GRM
- 5.2
CMA / ARV
- ARV (on-the-fly)
- $154,154
- Comps found
- 12
Show comp detail 12 sales within ~0.75 mi
| Address | Dist | Beds/Ba | Sqft | Sold | Price | $/sf | Match |
|---|---|---|---|---|---|---|---|
| 1128 Myrtle Ave | 0.11mi | 3/1.0 | 1,160 (+8%) | 2mo | $159,900 | $138 | 81 |
| 1403 Ohio Ave | 0.13mi | 2/1.0 (-1) | 1,008 (-6%) | 5mo | $140,000 | $139 | 74 |
| 1115 Myrtle Ave | 0.14mi | 3/1.5 | 1,184 (+10%) | 5mo | $68,000 | $57 | 71 |
| 612 Thayer Ave | 0.57mi | 3/1.5 | 1,104 (+2%) | 1mo | $158,000 | $143 | 67 |
| 1715 Pleasantview Ave | 0.46mi | 3/2.0 | 1,040 (-4%) | 3mo | $170,000 | $163 | 66 |
| 1421 Norwood Dr | 0.52mi | 4/1.0 (+1) | 1,142 (+6%) | 1mo | $160,000 | $140 | 60 |
| 2543 Burlingham Dr | 0.40mi | 3/2.0 | 1,150 (+7%) | 7mo | $170,000 | $148 | 60 |
| 1010 Brown Dr | 0.68mi | 3/1.0 | 1,008 (-6%) | 3mo | $150,000 | $149 | 55 |
| 710 Myrtle Ave | 0.50mi | 2/1.0 (-1) | 992 (-8%) | 5mo | $105,000 | $106 | 54 |
| 1030 Meadowlane Dr | 0.72mi | 3/2.0 | 1,056 (-2%) | 7mo | $180,000 | $170 | 53 |
| 1821 W 8th St | 0.51mi | 3/1.0 | 1,234 (+14%) | 5mo | $118,000 | $96 | 48 |
| 1627 W 6th St | 0.68mi | 2/1.0 (-1) | 938 (-13%) | 7mo | $159,900 | $170 | 36 |
Match score weights: distance 35% · size 25% · config 20% · recency 20%. Top-matched comps best support the ARV.
Projected returns pro-forma
-3.0% appreciation · 3.0% rent growth · sell at horizon
- IRR
- 20.1%
- Equity multiple
- 1.82×
- Total profit
- $36,639
- Equity at exit
- $23,857
- IRR
- 28.3%
- Equity multiple
- 3.51×
- Total profit
- $112,454
- Equity at exit
- $13,834
Cash invested: $44,800 (down + closing). Projections, not guarantees.
Landlord ↔ Tenant lean methodology
- Overall (STATE)
- 73 Landlord-Friendly
- State Ohio
- 73 Landlord-Friendly · R+6
- County
- — inherits STATE
- City
- — inherits STATE
ZIP-level market 44004
- Home prices YoY
- -30.5%
- Active inventory
- 169
- Price-to-rent
- 5.2×
Monthly cashflow live
- Estimated rent
- $2,553 medium interval (Pro) →
- Mortgage (P&I)
- −$839
- Tax from tax record
- −$129 /mo · $1,549/yr
- Insurance
- −$67
- HOA
- −$0
- Vacancy / Maint / Mgmt
- −$536
- Net cashflow
- $982
Break-even live
Sensitivity live
| Price | -10% $1,073 | -5% $1,028 | +0% $982 | +5% $937 | +10% $892 |
|---|---|---|---|---|---|
| Rent | -10% $781 | -5% $882 | +0% $982 | +5% $1,083 | +10% $1,184 |
| Rate | -1.0pp $1,063 | -0.5pp $1,023 | base $982 | +0.5pp $941 | +1.0pp $899 |
UW: 25.0% down · 7.5% · 30yr · 1.5% tax · 5.0% vac · 8.0% maint · 8.0% mgmt
Financing live
Cash to close
- Down payment
- $40,000
- Closing costs
- $4,800
- Reserves months
- —
- Total cash needed
- —
Loan-product check · same deal, 3 products live
Conventional
25% down · 7.5% · 30yr
- Down + closing
- —
- Monthly P&I
- —
- Monthly cashflow
- —
- DSCR
- —
- Eligible?
- —
Personal DTI + credit; lowest rate.
DSCR
20% down · 8.5% · 30yr
- Down + closing
- —
- Monthly P&I
- —
- Monthly cashflow
- —
- DSCR
- —
- Eligible?
- —
No personal income docs; deal must DSCR.
Hard money
10% down · 12.0% · 12mo
- Down + closing
- —
- Monthly P&I
- —
- Monthly cashflow
- —
- DSCR
- —
- Eligible?
- —
Short-term bridge; refi at stabilization.
Rent comps 2 comps
| Address | Beds | Baths | Sqft | Rent | $/sqft | DOM | Units | Dist |
|---|---|---|---|---|---|---|---|---|
| 1115 Myrtle Ave Ashtabula, OH | 3.0 | 1.5 | 1184 | $1,600 | $1.35 | 45d | 1 | 0.15mi |
| 1036 Union Ave Unit 1496086P Ashtabula, OH | 3.0 | 1.0 | 1496 | $5,341 | $3.57 | 45d | 1 | 0.35mi |
Listing history 13 events
-
2026-06-21days on market $160,000 Active 17 DOM
-
2026-06-21days on market $160,000 Active 16 DOM
-
2026-06-18days on market $160,000 Active 14 DOM
-
2026-06-17days on market $160,000 Active 13 DOM
-
2026-06-16days on market $160,000 Active 12 DOM
-
2026-06-15days on market $160,000 Active 11 DOM
-
2026-06-13days on market $160,000 Active 9 DOM
-
2026-06-12days on market $160,000 Active 8 DOM
-
2026-06-09days on market $160,000 Active 5 DOM
-
2026-06-08days on market $160,000 Active 4 DOM
-
2026-06-07days on market $160,000 Active 3 DOM
-
2026-06-07remarks 699-char remark
-
2026-06-07$160,000 Active 2 DOM
ⓘ Source: listings_history table (triggers on properties + properties_extension) + one-shot
backfill from property_details.listing_events for pre-trigger history.
Tax reassessment forecast OH · Partial reset (capped growth)
- Current annual tax
- $1,549 · $129/mo
- Projected year-2 tax
- $2,022 · $169/mo
- Expected delta
- +$474/yr (+$39/mo · 30.6%)
ⓘ Screening estimate from a state-policy table — verify with the county assessor before closing.
Climate risk First Street
- Flood 1/10 Low FEMA zone X (unshaded) · 0% chance over 30 yrs
- Wildfire 1/10 Low
- Heat 2/10 Low 7 d/yr ≥93°F today · 17 d/yr by 30 yrs out
- Wind 1/10 Low
- Air quality 3/10 Moderate 2 unhealthy d/yr today · 5 by 30 yrs out
Nearby sold comps map
Loading sold comps map…
Walkable amenities ~0.75 mi
Loading nearby amenities…
Taxation est. · year 1
- Rental income
- $30,641
- − Mortgage interest
- −$8,962
- − Property taxes
- −$1,549
- − Insurance
- −$800
- − Repairs & maintenance
- −$2,451
- − Management
- −$2,451
- − Depreciation
- −$4,655
- Taxable income
- $9,773
- Est. tax owed @ 24.0%
- −$2,345
- After-tax cash flow
- $9,444/yr
For passive investors: Depreciation is non-cash, so a rental often shows a tax loss while cash-flowing — sheltering income. Rental losses are passive: they offset passive income freely, and up to $25,000/yr can offset ordinary (W-2) income if you actively participate and your MAGI is under $100k (phasing out to $0 by $150k); unused losses carry forward. On sale, claimed depreciation is recaptured at up to 25%, and gains may owe capital-gains tax (a 1031 exchange can defer both). Figures are a year-1 estimate at your 24.0% rate — not tax advice; consult a CPA.
Schools (NCES district)
- District
- Ashtabula Area City
- NCES district ID
- 3904351
- Math proficiency
- 24% ▼ -27.00%
- Reading proficiency
- 35% ▼ -13.00%
- Median HH income
- $34,812
- Composite
- 24.3/100
- National rank
- #7712
- State rank
- #588 of 656 in OH
Livability — Ashtabula
- Score
- 71/100
- State rank
- #420
- US rank
- #6883
Category grades
Schools grade is shown separately in the Schools card above.
Census & demographics
- Census place
- Ashtabula, OH
- County
- Ashtabula · 97,617 people
- City population
- 31,076
- Metro
- Cleveland, OH
- Population (ZIP)
- 31,076
- Household income
- $49,507
- Rent vs Own
- Severe rent burden
- 14.1
Population outlook (Ashtabula County) Hauer SSP2
- Today (2025)
- 92,950 people
- By 2030
- 89,146 · -4.1%
- By 2040
- 80,715 · -13.2%
- By 2050
- 72,270 · -22.2%
- By 2075
- 55,780 · -40.0%
- By 2100
- 40,928 · -56.0%
Race, ethnicity, and origin ACS 2023
- Neighborhood character
- Predominantly White (79%)
- Race & ethnicity
- White 79% Hispanic / Latino 9% Two or more races 7% Black 6%
- Hispanic origin (detail)
- Mexican 3% Puerto Rican 5%
- Common ancestry
- Romanian 4% Iranian 2% Slovak 1%
- Foreign-born
- 3% · Canada
- Languages at home
- 94% English-only · Spanish 4%
Political lean MEDSL · Ashtabula
- 2024 margin
- Strong R (+28.4) · D 35.4% · R 63.8%
- 2008→2024 swing
- -41.9pp toward R · 2008: 13.5pp · 2024: -28.4pp
- All cycles
- 2024: R+28.4 2020: R+23.5 2016: R+19.0 2012: D+12.1 2008: D+13.5
Not yet ingested
- Civics
- —
Market trends
- HPI YoY
- ▼ -114.51%
- Current HPI
- 260.7146
- Rent YoY
- —
- Metro
- —
- State GDP YoY
- ▲ 1.98%
- F500 in state
- 48
Industry mix (Fortune 500 HQ in OH)
| Industry | F500 HQs | Revenue |
|---|---|---|
| Insurance | 3 | $145B |
|
||
| Industrial Machinery | 3 | $49B |
|
||
| Financial Services | 3 | $24B |
|
||
| Consumer Goods | 2 | $93B |
|
||
| Aerospace / Defense | 2 | $47B |
|
||
| Utilities | 2 | $33B |
|
||
Price history
+148.1% since first listed15 events — show timeline
- 2026-06-04 Listed $160,000 MLSNOW
- 2024-09-03 Sold (Public Records) $140,000 Public Records
- 2024-08-30 Pending — MLSNOW
- 2024-08-30 Sold (MLS) $140,000 MLSNOW
- 2024-08-11 Contingent — MLSNOW
- 2024-08-09 Relisted — MLSNOW
- 2024-08-03 Contingent — MLSNOW
- 2024-07-27 Relisted — MLSNOW
- 2024-07-18 Contingent — MLSNOW
- 2024-07-12 Listed $139,900 MLSNOW
- 2019-03-04 Sold (Public Records) $425,000 Public Records
- 2015-08-11 Listing Removed — MLSNOW
- 2015-07-17 Price Changed $50,900 MLSNOW
- 2015-04-17 Price Changed $57,900 MLSNOW
- 2015-03-04 Listed $64,500 MLSNOW
Property tax history
+7.9%/yrLatest (2025): $1,549 · +10.7% YoY. Source: county tax records.
Cash-flow waterfall
monthlySold comps — $/sqft
last 12 mo · ≤1 miLoading sold comps…