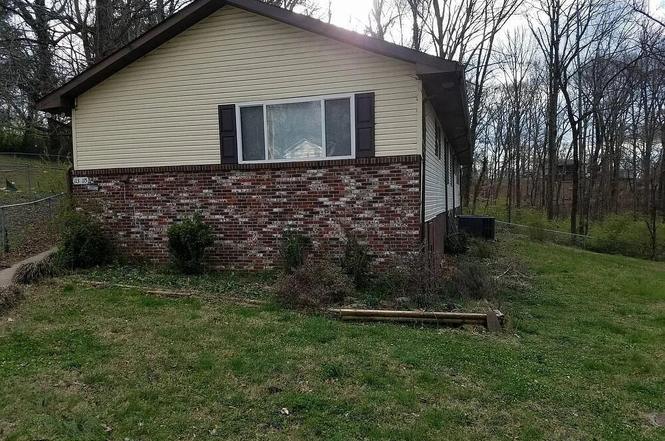
 Duplex
113/115 Walsh Ln · Oak Ridge, TN
Flood risk 1/10 · Minimal
- FEMA flood zone
- X (unshaded)
- Chance of flooding over 30 yrs
- 0.0%
- Est. flood insurance / yr
- $507 – $1,088
Fire risk 3/10 · Minor
- Est. fire insurance / yr
- $949 – $1,763
Heat risk 5/10 · Moderate
- Hot days now (above 103°F)
- 6 days/yr
- Hot days in 30 yrs
- 16 days/yr
Wind risk 2/10 · Minimal
- Chance of severe wind over 30 yrs
- 1.0%
Air-quality risk 4/10 · Minor
- Unhealthy air days now
- 4 days/yr
- Unhealthy air days in 30 yrs
- 4 days/yr
Risk factors via First Street. Map © Google.
Why this score? — see what drove the D grade
The composite is a weighted blend of 9 inputs, each scored 0–100. Each bar is that input's sub-score; the figure is the points it added to the 100-point composite (weight × sub-score).
- Cash flow +13.8/30.0
- ARV discount +7.5/15.0
- DSCR +4.2/10.0
- 1% rule +3.9/10.0
- Livability +3.9/5.0
- Rent growth +3.3/5.0
- Schools +3.1/10.0
- Condition / age +2.5/5.0
- Appreciation +0.0/10.0
$310,000
🖨 Deal sheet 📄 Offer letter ✓ Due diligence
Multi-family units
County records classify this as Multi-Family (2-4 Unit). Listing-text estimate: 2 units. confirmed
Listing remarks
This former single-family property has been professionally converted into a two-unit duplex, now addressed as 113 and 115 Walsh Lane. Each unit offers separate entrances and independent living spaces, making it ideal for dual tenancy or owner-occupancy with rental income. The functional layouts maximize square footage and tenant appeal, with comfortable living areas, practical kitchens, and well-sized bedrooms. The property provides strong flexibility for long-term rental, short-term rental (where permitted), or multi-generational housing. A smart addition to any portfolio, 113 & 115 Walsh Lane combines stability, versatility, and income potential. don't miss this amazing investment o
Key facts
- Two unit duplex
- Practical kitchens
- Separate entrances
Tags
Property features AI
Finance
- Financial info: Two total units (multifamily)
Exterior
- Parking: On-street parking
- Construction: Block and frame construction
- Exterior features: Block and frame construction
Interior
- Kitchen: Refrigerator
- Bedrooms: One unit with 3 bedrooms; One unit with 1 bedroom
- Flooring: Hardwood; Tile
- Heating & cooling: Central heating (natural gas and electric); Central cooling; Ceiling fans
- Interior features: Hardwood and tile flooring; Refrigerator included
Neighborhood map
What this means for you Summary
Snapshot
- This is a 2 × 2-bed/1.0-bath units multifamily listed at $310k.
Deal economics
- At list price, monthly cash flow is $28 ($333/yr) — positive. Per door: $14/mo.
- The deal already cash-flows at list — no discount required.
- To meet the 1% rule (rent ≥ 1% of price), the offer needs to be $275k (11.4% below list).
- Recommended offer: $275k (11.4% below list) — sets the bar for 1% rule.
- Cap rate 6.4% vs local median 3.4% in Oak Ridge — top-decile yield for the area; either an underpriced asset or a hidden risk that comps aren't pricing in. Stress-test before assuming the spread holds.
Location & tenants
- Location reads 78/100 on livability (#4 in TN, #2,605 nationally) — a middle-class / working-renter tenant base. Strengths: amenities A+, cost of living A+, housing A+; Watch: schools C-, commute F.
- Oak Ridge (suburban): math 34% / reading 37% proficiency, ranked #23 of 139 in TN (top 16%) — families likely to look elsewhere, expect single-tenant / working-renter base with shorter leases.
- Market conditions: Rents rising (+3.1%/yr); 189 active listings in the ZIP; 5 comparable units currently listed for rent nearby; rentals leasing fast (median 3d on market — plan ~1-2 weeks tenant-placement turnaround); 400 units permitted in Anderson County in 2024 (91 in 5+ unit buildings).
- At $2,747/mo this rent would consume 46% of the median local household income ($72k/yr) (locally 914% of renters already pay >50% of income on rent) — very limited rent-growth headroom before tenants either downsize or default.
Forward outlook
- Local home prices are declining (-3.0%/yr); year-one equity from $2k of loan paydown is wiped out by about $9k of value loss. Plan a longer hold.
Negotiation context
- It's been on market 110 days — a 9% lower offer ($282k) is reasonable based on typical stale-listing flexibility.
Risks & watch-outs
- Watch-outs: built in 1943 — expect roof / HVAC / electrical / plumbing capex.
- Climate carrying-cost: extreme-heat days projected 6→16/yr by 2055 (HVAC capex compounding) — expect insurance premiums to compound above CPI over the hold.
Questions for the listing agent
- It's been on market 110 days. Have you received any prior offers? Is the seller open to a 11% concession, seller financing, or rate buy-down credit?
- Can we see the unit-by-unit rent roll, current vacancy, and any below-market leases? What's the average tenancy length?
- What capital expenditures (roof, boiler, parking lot, exteriors) have been made in the last 5 years, and what's planned in the next 2?
- Built in 1943 — when were the roof, HVAC, electrical panel, plumbing, and water heater last replaced?
- Why hasn't it sold? Are there any deal-killer items the seller is aware of (foundation, flood, title, zoning, code violations)?
- Is there a deadline driving the sale (1031 exchange, divorce, estate, relocation)? That informs how much negotiation room exists.
- The area grade is low — what's the realistic commute time and amenity access for the typical tenant pool here? Any planned neighborhood developments (good or bad) we should know about?
- What's the average days-on-market for RENTAL listings here right now (not sales)? A rising rental-DOM trend means longer vacancies and softer asking-rent achievability than the comps imply.
- What's the recent tenant-quality profile in this submarket — average credit score on applications, eviction rate, late-payment / NSF rate, and stable-employment percentage? A property-management company in the area should have these aggregated.
- How much new apartment / multifamily construction is in the pipeline within 1–3 miles? Heavy new supply (>2% of stock underway) typically softens rents 12–24 months out; light construction supports rent growth.
Investment metrics
- 1% rule
- 0.89% ✗
- Cap rate
- 6.40%
- Cash-on-cash
- 0.38%
- DSCR
- 1.02
- GRM
- 9.4
CMA / ARV
No comps found within radius.
Show comp detail 4 sales within ~0.75 mi
| Address | Dist | Beds/Ba | Sqft | Sold | Price | $/sf | Match |
|---|---|---|---|---|---|---|---|
| 460 W Outer Dr | 0.45mi | 4/2.0 | 1,425 | 9mo | $340,000 | $239 | 51 |
| 178180 Hillside Rd | 0.65mi | 5/— (+1) | 1,425 | 6mo | $285,000 | $200 | 47 |
| 178 & 180 Hillside Rd | 0.66mi | 5/— (+1) | 1,425 | 6mo | $285,000 | $200 | 46 |
| 380 W Outer Dr | 0.74mi | 5/— (+1) | 2,119 | 2mo | $322,000 | $152 | 46 |
Match score weights: distance 35% · size 25% · config 20% · recency 20%. Top-matched comps best support the ARV.
Projected returns pro-forma
-3.0% appreciation · 3.11% rent growth · sell at horizon
- IRR
- -15.6%
- Equity multiple
- 0.45×
- Total profit
- $-48,118
- Equity at exit
- $46,222
- IRR
- -6.9%
- Equity multiple
- 0.56×
- Total profit
- $-38,201
- Equity at exit
- $26,803
Cash invested: $86,800 (down + closing). Projections, not guarantees.
Landlord ↔ Tenant lean methodology
- Overall (STATE)
- 87 Strongly Landlord-Friendly
- State Tennessee
- 87 Strongly Landlord-Friendly · R+13
- County
- — inherits STATE
- City
- — inherits STATE
ZIP-level market 37830
- Home prices YoY
- -33.2%
- Rents YoY
- 3.1%
- Active inventory
- 189
- Price-to-rent
- 18.8×
Monthly cashflow live
- Estimated rent
- $2,747 high interval (Pro) →
- Mortgage (P&I)
- −$1,626
- Tax est. 1.5%
- −$388 /mo · $4,650/yr
- Insurance
- −$129
- HOA
- −$0
- Vacancy / Maint / Mgmt
- −$577
- Net cashflow
- $28
Break-even live
2-unit breakdown (identical units grouped — click to expand)
| Units | Beds | Baths | Est. rent |
|---|---|---|---|
| 2× units | 2 | 1 | $2,748 |
| #1 | 2 | 1 | $1,374 |
| #2 | 2 | 1 | $1,374 |
| Total (2 units) | $2,747 | ||
UW: 25.0% down · 7.5% · 30yr · 1.5% tax · 5.0% vac · 8.0% maint · 8.0% mgmt
Financing live
Cash to close
- Down payment
- $77,500
- Closing costs
- $9,300
- Reserves months
- —
- Total cash needed
- —
Loan-product check · same deal, 3 products live
Conventional
25% down · 7.5% · 30yr
- Down + closing
- —
- Monthly P&I
- —
- Monthly cashflow
- —
- DSCR
- —
- Eligible?
- —
Personal DTI + credit; lowest rate.
DSCR
20% down · 8.5% · 30yr
- Down + closing
- —
- Monthly P&I
- —
- Monthly cashflow
- —
- DSCR
- —
- Eligible?
- —
No personal income docs; deal must DSCR.
Hard money
10% down · 12.0% · 12mo
- Down + closing
- —
- Monthly P&I
- —
- Monthly cashflow
- —
- DSCR
- —
- Eligible?
- —
Short-term bridge; refi at stabilization.
Rent comps 5 comps
| Address | Beds | Baths | Sqft | Rent | $/sqft | DOM | Units | Dist |
|---|---|---|---|---|---|---|---|---|
| 113 Wakeman Ln Oak Ridge, TN | 3.0 | 1.0 | 1100 | $1,550 | $1.41 | 2d | 1 | 0.12mi |
| 102 Wainwright Rd Oak Ridge, TN | 3.0 | 1.5 | 1250 | $1,295 | $1.04 | 2d | 1 | 0.30mi |
| 219 Highland Ave Unit 1 Oak Ridge, TN | 3.0 | 1.0 | 950 | $1,595 | $1.68 | 2d | 1 | 0.50mi |
| 156 N Illinois Ave Oak Ridge, TN | 3.0 | 2.0 | 1326 | $1,695 | $1.28 | 2d | 1 | 0.57mi |
| 289 Royce Cir Oak Ridge, TN | 2.0–3.0 | 2.0 | 1063 | $1,516 | $1.43 | 2d | 3 | 0.72mi |
Listing history 16 events
-
2026-06-18days on market $310,000 Active 110 DOM
-
2026-06-17days on market $310,000 Active 109 DOM
-
2026-06-16days on market $310,000 Active 108 DOM
-
2026-06-15days on market $310,000 Active 107 DOM
-
2026-06-14days on market $310,000 Active 105 DOM
-
2026-06-10days on market $310,000 Active 102 DOM
-
2026-06-09days on market $310,000 Active 101 DOM
-
2026-06-08days on market $310,000 Active 100 DOM
-
2026-06-07days on market $310,000 Active 99 DOM
-
2026-06-03days on market $310,000 Active 95 DOM
-
2026-06-02days on market $310,000 Active 94 DOM
-
2026-06-01days on market $310,000 Active 93 DOM
-
2026-05-31days on market $310,000 Active 92 DOM
-
2026-05-31days on market $310,000 Active 91 DOM
-
2026-05-20price $310,000
-
2026-02-27$315,000 Active
ⓘ Source: listings_history table (triggers on properties + properties_extension) + one-shot
backfill from property_details.listing_events for pre-trigger history.
Climate risk First Street
- Flood 1/10 Low FEMA zone X (unshaded) · 0% chance over 30 yrs
- Wildfire 3/10 Moderate
- Heat 5/10 Major 6 d/yr ≥103°F today · 16 d/yr by 30 yrs out
- Wind 2/10 Low 100% chance of damaging wind over 30 yrs
- Air quality 4/10 Moderate 4 unhealthy d/yr today · 4 by 30 yrs out
Nearby sold comps map
Loading sold comps map…
Walkable amenities ~0.75 mi
Loading nearby amenities…
Taxation est. · year 1
- Rental income
- $32,964
- − Mortgage interest
- −$17,365
- − Property taxes
- −$4,650
- − Insurance
- −$1,550
- − Repairs & maintenance
- −$2,637
- − Management
- −$2,637
- − Depreciation
- −$9,018
- Taxable loss
- −$4,893
- Est. tax savings @ 24.0%
- +$1,174
- After-tax cash flow
- $1,508/yr
For passive investors: Depreciation is non-cash, so a rental often shows a tax loss while cash-flowing — sheltering income. Rental losses are passive: they offset passive income freely, and up to $25,000/yr can offset ordinary (W-2) income if you actively participate and your MAGI is under $100k (phasing out to $0 by $150k); unused losses carry forward. On sale, claimed depreciation is recaptured at up to 25%, and gains may owe capital-gains tax (a 1031 exchange can defer both). Figures are a year-1 estimate at your 24.0% rate — not tax advice; consult a CPA.
Schools (NCES district)
- District
- Oak Ridge
- NCES district ID
- 4703240
- Math proficiency
- 34% ▼ -3.00%
- Reading proficiency
- 37% ▼ -4.00%
- Median HH income
- $49,949
- Composite
- 30.75/100
- National rank
- #6159
- State rank
- #23 of 139 in TN
Livability — Oak Ridge
- Score
- 78/100
- State rank
- #4
- US rank
- #2605
Category grades
Schools grade is shown separately in the Schools card above.
Census & demographics
- Census place
- Oak Ridge, TN
- County
- Anderson County · 33,038 people
- City population
- 33,038
- Metro
- Knoxville, TN
- Population (ZIP)
- 33,038
- Household income
- $72,269
- Rent vs Own
- Severe rent burden
- 914.0
Population outlook (Anderson County) Hauer SSP2
- Today (2025)
- 76,963 people
- By 2030
- 77,226 · +0.3%
- By 2040
- 76,905 · -0.1%
- By 2050
- 75,405 · -2.0%
- By 2075
- 70,858 · -7.9%
- By 2100
- 60,585 · -21.3%
Race, ethnicity, and origin ACS 2023
- Neighborhood character
- Predominantly White (80%)
- Race & ethnicity
- White 80% Two or more races 7% Hispanic / Latino 6% Black 6% Asian 3%
- Hispanic origin (detail)
- Mexican 4%
- Common ancestry
- Serbian 3% Slovak 3% Italian 3%
- Foreign-born
- 6% · Canada, China, South Korea
- Languages at home
- 91% English-only · Spanish 5% Chinese 1% German/W. Germanic 1%
Political lean MEDSL · Anderson
- 2024 margin
- Solid R (+35.7) · D 31.5% · R 67.3% · Other 1.2%
- 2008→2024 swing
- -9.5pp toward R · 2008: -26.2pp · 2024: -35.7pp
- All cycles
- 2024: R+35.7 2020: R+32.2 2016: R+34.3 2012: R+29.8 2008: R+26.2
Not yet ingested
- Civics
- —
Market trends
- HPI YoY
- ▼ -160.89%
- Current HPI
- 323.0396
- Rent YoY
- ▲ 3.11%
- Metro
- Knoxville, TN
- State GDP YoY
- ▲ 2.78%
- F500 in state
- 22
Industry mix (Fortune 500 HQ in TN)
| Industry | F500 HQs | Revenue |
|---|---|---|
| Healthcare | 3 | $91B |
|
||
| Retail | 3 | $72B |
|
||
| Transportation / Logistics | 1 | $88B |
|
||
| Paper / Packaging | 1 | $19B |
|
||
| Insurance | 1 | $13B |
|
||
| Energy | 1 | $12B |
|
||
Price history
-1.6% since first listed2 events — show timeline
- 2026-05-20 Price Changed $310,000 Knoxville MLS
- 2026-02-27 Listed $315,000 Knoxville MLS
Cash-flow waterfall
monthlySold comps — $/sqft
last 12 mo · ≤1 miLoading sold comps…