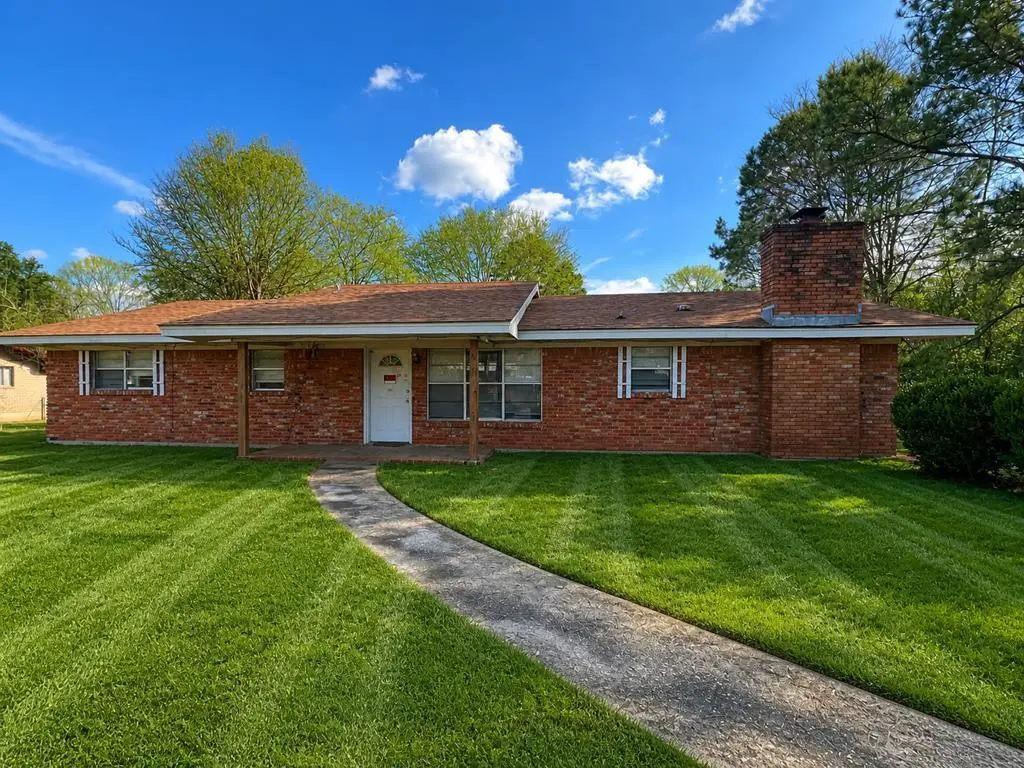
903 Highway 190 W · Jasper, TX
Flood risk 1/10 · Minimal
- FEMA flood zone
- X (unshaded)
- Chance of flooding over 30 yrs
- 0.0%
- Est. flood insurance / yr
- $507 – $1,088
Fire risk 5/10 · Moderate
- Est. fire insurance / yr
- $1,222 – $2,270
Heat risk 8/10 · Major
- Hot days now (above 111°F)
- 7 days/yr
- Hot days in 30 yrs
- 22 days/yr
Wind risk 8/10 · Major
- Chance of severe wind over 30 yrs
- 99.0%
Air-quality risk 1/10 · Minimal
- Unhealthy air days now
- 0 days/yr
- Unhealthy air days in 30 yrs
- 0 days/yr
Risk factors via First Street. Map © Google.
Why this score? — see what drove the B- grade
The composite is a weighted blend of 9 inputs, each scored 0–100. Each bar is that input's sub-score; the figure is the points it added to the 100-point composite (weight × sub-score).
- Cash flow +25.5/30.0
- ARV discount +15.0/15.0
- DSCR +8.5/10.0
- 1% rule +7.0/10.0
- Livability +2.9/5.0
- Rent growth +2.5/5.0
- Condition / age +2.5/5.0
- Schools +2.0/10.0
- Appreciation +0.0/10.0
$120,000
🖨 Deal sheet 📄 Offer letter ✓ Due diligence
Listing remarks
This solid brick home offers a fantastic opportunity to create your ideal living space. Featuring a functional floor plan with generously sized rooms, this property is filled with natural light and classic character throughout. The home includes a large living area with a cozy brick fireplace, perfect for gathering and relaxing. The kitchen offers ample cabinet space and a great layout ready for your personal touch. Multiple bedrooms provide flexibility for family, guests, or a home office. Step outside to enjoy a spacious yard shaded by mature trees—ideal for outdoor entertaining, gardening, or simply unwinding. The property also features a private driveway and plenty of room to expa
Key facts
- Spacious yard
- Large living area
- Private driveway
Tags
Property features AI
Exterior
- Parking: No garage
- Home design: Single family residence; Residential property; Located in Holmwood subdivision
- Construction: Brick construction; Slab foundation
- Exterior features: Composition roof; Shed(s)
Interior
- Flooring: Vinyl
- Bathrooms: 2 full bathrooms
- Heating & cooling: Central heating; Central air
- Interior features: Vinyl floors; Central heating and central air conditioning
Neighborhood map
What this means for you Summary
Snapshot
- This is a 3-bed/2.0-bath single-family listed at $120k.
Deal economics
- At list price, monthly cash flow is $280 ($3k/yr) — positive.
- The deal already cash-flows at list — no discount required.
- Meets the 1% rule at list price ($1k rent vs $120k).
- Recommended offer: $116k (3.0% below list) — sets the bar for market timing.
- Cap rate 9.1% vs local median 4.8% in Jasper — top-decile yield for the area; either an underpriced asset or a hidden risk that comps aren't pricing in. Stress-test before assuming the spread holds.
Location & tenants
- Location reads 58/100 on livability (#1,225 in TX) — a working-class tenant base; expect higher turnover. Strengths: cost of living A+, housing A; Watch: crime C-, schools F, amenities F.
- Jasper ISD (town): math 22% / reading 26% proficiency, ranked #734 of 826 in TX (top 89%) — low school quality limits family demand, transient renter base, plan for 1-2y turnover; 66% free/reduced lunch — lower-income household profile, screen leases tightly.
- Market conditions: 308 active listings in the ZIP; 45 units permitted in Jasper County in 2024 (0 in 5+ unit buildings).
Forward outlook
- Local home prices are declining (-3.0%/yr); year-one equity from $830 of loan paydown is wiped out by about $4k of value loss. Plan a longer hold.
- Jasper County population projected at -15% by 2050 — secular population decline; favor cash flow + early exit over multi-decade hold.
Negotiation context
- It's been on market 45 days — a 3% lower offer ($116k) is reasonable based on typical stale-listing flexibility.
- 4 sale attempts since 4y ago with the ask held roughly flat each time — persistent listings suggest the price (not the market) is what's stuck; bring a comps-based counter.
Risks & watch-outs
- Climate carrying-cost: severe wind risk, 99% chance of damaging wind over 30y; moderate wildfire risk; extreme-heat days projected 7→22/yr by 2055 (HVAC capex compounding) — expect insurance premiums to compound above CPI over the hold.
Questions for the listing agent
- It's been on market 45 days. Have you received any prior offers? Is the seller open to a 3% concession, seller financing, or rate buy-down credit?
- Is there a deadline driving the sale (1031 exchange, divorce, estate, relocation)? That informs how much negotiation room exists.
- Schools are F-rated, which usually means shorter tenancies and higher turnover. Who's the typical renter profile here, and what's been the actual vacancy rate?
- What's the average days-on-market for RENTAL listings here right now (not sales)? A rising rental-DOM trend means longer vacancies and softer asking-rent achievability than the comps imply.
- What's the recent tenant-quality profile in this submarket — average credit score on applications, eviction rate, late-payment / NSF rate, and stable-employment percentage? A property-management company in the area should have these aggregated.
- How much new for-sale + rental construction is in the pipeline within 1–3 miles? Heavy new supply typically softens prices + rents 12–24 months out; constrained supply supports both.
Investment metrics
- 1% rule
- 1.20% ✓
- Cap rate
- 9.09%
- Cash-on-cash
- 10.00%
- DSCR
- 1.45
- GRM
- 7.0
CMA / ARV
- ARV (median comp)
- $166,445
- List price
- $120,000
- Delta
- -27.90%
- Verdict
- UNDERPRICED
- Comps
- 2 within 1.0 mi
Projected returns pro-forma
-3.0% appreciation · 3.0% rent growth · sell at horizon
- IRR
- -1.2%
- Equity multiple
- 0.95×
- Total profit
- $-1,568
- Equity at exit
- $17,892
- IRR
- 8.5%
- Equity multiple
- 1.65×
- Total profit
- $21,758
- Equity at exit
- $10,375
Cash invested: $33,600 (down + closing). Projections, not guarantees.
Landlord ↔ Tenant lean methodology
- Overall (STATE)
- 87 Strongly Landlord-Friendly
- State Texas
- 87 Strongly Landlord-Friendly · R+5
- County
- — inherits STATE
- City
- — inherits STATE
ZIP-level market 75951
- Active inventory
- 308
- Price-to-rent
- 7.0×
Monthly cashflow live
- Estimated rent
- $1,436 medium interval (Pro) →
- Mortgage (P&I)
- −$629
- Tax from tax record
- −$175 /mo · $2,105/yr
- Insurance
- −$50
- HOA
- −$0
- Vacancy / Maint / Mgmt
- −$302
- Net cashflow
- $280
Break-even live
UW: 25.0% down · 7.5% · 30yr · 1.5% tax · 5.0% vac · 8.0% maint · 8.0% mgmt
Financing live
Cash to close
- Down payment
- $30,000
- Closing costs
- $3,600
- Reserves months
- —
- Total cash needed
- —
Loan-product check · same deal, 3 products live
Conventional
25% down · 7.5% · 30yr
- Down + closing
- —
- Monthly P&I
- —
- Monthly cashflow
- —
- DSCR
- —
- Eligible?
- —
Personal DTI + credit; lowest rate.
DSCR
20% down · 8.5% · 30yr
- Down + closing
- —
- Monthly P&I
- —
- Monthly cashflow
- —
- DSCR
- —
- Eligible?
- —
No personal income docs; deal must DSCR.
Hard money
10% down · 12.0% · 12mo
- Down + closing
- —
- Monthly P&I
- —
- Monthly cashflow
- —
- DSCR
- —
- Eligible?
- —
Short-term bridge; refi at stabilization.
Listing history 28 events
-
2026-06-18days on market $120,000 Active 45 DOM
-
2026-06-17days on market $120,000 Active 44 DOM
-
2026-06-16days on market $120,000 Active 43 DOM
-
2026-06-15days on market $120,000 Active 42 DOM
-
2026-06-14days on market $120,000 Active 40 DOM
-
2026-06-13days on market $120,000 Active 39 DOM
-
2026-06-10days on market $120,000 Active 37 DOM
-
2026-06-09days on market $120,000 Active 36 DOM
-
2026-06-08days on market $120,000 Active 35 DOM
-
2026-06-07days on market $120,000 Active 34 DOM
-
2026-06-05days on market $120,000 Active 31 DOM
-
2026-06-03days on market $120,000 Active 30 DOM
-
2026-06-02days on market $120,000 Active 29 DOM
-
2026-06-01days on market $120,000 Active 28 DOM
-
2026-05-31days on market $120,000 Active 27 DOM
-
2026-05-31days on market $120,000 Active 26 DOM
-
2026-04-01$120,000 Active 906-char remark
-
2026-03-16historical
-
2026-01-05status Active
-
2025-07-02historical
-
2025-01-28$184,530 Active
-
2025-01-06historical
-
2024-10-07soldstatus
-
2023-01-31historical
-
2023-01-29price $141,000
-
2022-12-27price $158,500
-
2022-12-16soldstatus
-
2022-10-11$168,550 Active
ⓘ Source: listings_history table (triggers on properties + properties_extension) + one-shot
backfill from property_details.listing_events for pre-trigger history.
Tax reassessment forecast TX · Resets to sale price
- Current annual tax
- $2,105 · $175/mo
- Projected year-2 tax
- $2,196 · $183/mo
- Expected delta
- +$91/yr (+$8/mo · 4.3%)
ⓘ Screening estimate from a state-policy table — verify with the county assessor before closing.
Climate risk First Street
- Flood 1/10 Low FEMA zone X (unshaded) · 0% chance over 30 yrs
- Wildfire 5/10 Major
- Heat 8/10 Severe 7 d/yr ≥111°F today · 22 d/yr by 30 yrs out
- Wind 8/10 Severe 99% chance of damaging wind over 30 yrs
- Air quality 1/10 Low 0 unhealthy d/yr today · 0 by 30 yrs out
Nearby sold comps map
Loading sold comps map…
Walkable amenities ~0.75 mi
Loading nearby amenities…
Taxation est. · year 1
- Rental income
- $17,238
- − Mortgage interest
- −$6,722
- − Property taxes
- −$2,105
- − Insurance
- −$600
- − Repairs & maintenance
- −$1,379
- − Management
- −$1,379
- − Depreciation
- −$3,491
- Taxable income
- $1,562
- Est. tax owed @ 24.0%
- −$375
- After-tax cash flow
- $2,986/yr
For passive investors: Depreciation is non-cash, so a rental often shows a tax loss while cash-flowing — sheltering income. Rental losses are passive: they offset passive income freely, and up to $25,000/yr can offset ordinary (W-2) income if you actively participate and your MAGI is under $100k (phasing out to $0 by $150k); unused losses carry forward. On sale, claimed depreciation is recaptured at up to 25%, and gains may owe capital-gains tax (a 1031 exchange can defer both). Figures are a year-1 estimate at your 24.0% rate — not tax advice; consult a CPA.
Schools (NCES district)
- District
- Jasper ISD
- NCES district ID
- 4824630
- Math proficiency
- 22% ▼ -12.00%
- Reading proficiency
- 26% ▼ -8.00%
- Median HH income
- $36,286
- Composite
- 19.91/100
- National rank
- #8684
- State rank
- #734 of 826 in TX
Livability — Jasper
- Score
- 58/100
- State rank
- #1225
- US rank
- #21385
Category grades
Schools grade is shown separately in the Schools card above.
Census & demographics
- Population (ZIP)
- 15,267
Population outlook (Jasper County) Hauer SSP2
- Today (2025)
- 33,986 people
- By 2030
- 32,965 · -3.0%
- By 2040
- 30,908 · -9.1%
- By 2050
- 28,893 · -15.0%
- By 2075
- 24,828 · -26.9%
- By 2100
- 19,987 · -41.2%
Race, ethnicity, and origin ACS 2023
- Neighborhood character
- Diverse neighborhood (Simpson 0.56)
- Race & ethnicity
- White 60% Black 28% Two or more races 7% Hispanic / Latino 6%
- Hispanic origin (detail)
- Mexican 6%
- Common ancestry
- Lithuanian 1% Slovak 1% Iranian 1%
- Foreign-born
- 3% · Canada
- Languages at home
- 93% English-only · Spanish 5% Tagalog/Filipino 1%
Political lean MEDSL · Jasper
- 2024 margin
- Solid R (+66.6) · D 16.5% · R 83.1%
- 2008→2024 swing
- -24.6pp toward R · 2008: -42.0pp · 2024: -66.6pp
- All cycles
- 2024: R+66.6 2020: R+61.4 2016: R+59.9 2012: R+48.4 2008: R+42.0
Not yet ingested
- Civics
- —
Market trends
- HPI YoY
- ▼ -83.56%
- Current HPI
- 136.7972
- Rent YoY
- —
- Metro
- —
- State GDP YoY
- ▲ 3.95%
- F500 in state
- 110
Industry mix (Fortune 500 HQ in TX)
| Industry | F500 HQs | Revenue |
|---|---|---|
| Energy | 16 | $1,198B |
|
||
| Technology | 5 | $198B |
|
||
| Engineering / Construction | 4 | $72B |
|
||
| Energy Services | 3 | $60B |
|
||
| Utilities | 3 | $41B |
|
||
| Healthcare | 2 | $330B |
|
||
Price history
-28.8% since first listed12 events — show timeline
- 2026-04-01 Listed $120,000 Deep East Texas MLS
- 2026-03-16 Listing Removed — HARMLS
- 2026-01-05 Relisted — HARMLS
- 2025-07-02 Listing Removed — HARMLS
- 2025-01-28 Listed $184,530 HARMLS
- 2025-01-06 Coming Soon — HARMLS
- 2024-10-07 Sold (Public Records) — Public Records
- 2023-01-31 Listing Removed — HARMLS
- 2023-01-29 Price Changed $141,000 HARMLS
- 2022-12-27 Price Changed $158,500 HARMLS
- 2022-12-16 Sold (Public Records) — Public Records
- 2022-10-11 Listed $168,550 HARMLS
Property tax history
+1.0%/yrLatest (2025): $2,105 · -0.3% YoY. Source: county tax records.
Cash-flow waterfall
monthlySold comps — $/sqft
last 12 mo · ≤1 miLoading sold comps…