266 Layton Rd · Pine Plains, NY
Flood risk 8/10 · Major
- FEMA flood zone
- X (unshaded)
- Chance of flooding over 30 yrs
- 0.99%
- Est. flood insurance / yr
- $473 – $860
Fire risk 5/10 · Moderate
- Est. fire insurance / yr
- $691 – $1,283
Heat risk 3/10 · Minor
- Hot days now (above 95°F)
- 7 days/yr
- Hot days in 30 yrs
- 15 days/yr
Wind risk 4/10 · Minor
- Chance of severe wind over 30 yrs
- 14.0%
Air-quality risk 3/10 · Minor
- Unhealthy air days now
- 2 days/yr
- Unhealthy air days in 30 yrs
- 3 days/yr
Risk factors via First Street. Map © Google.
Why this score? — see what drove the D grade
The composite is a weighted blend of 9 inputs, each scored 0–100. Each bar is that input's sub-score; the figure is the points it added to the 100-point composite (weight × sub-score).
- Appreciation +10.0/10.0
- Cash flow +8.1/30.0
- ARV discount +5.8/15.0
- Schools +4.8/10.0
- Livability +3.2/5.0
- Rent growth +2.5/5.0
- Condition / age +2.5/5.0
- 1% rule +2.1/10.0
- DSCR +2.1/10.0
$459,000
🖨 Deal sheet (PDF) 📄 Offer letter ✓ Due diligence
Listing remarks
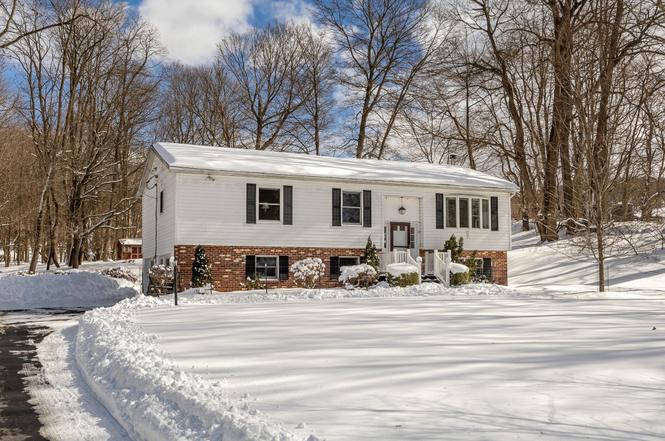
This well maintained 3 bedroom, 2 1/2 bath home is located on 1.4 acres on a peaceful, rural road in the Town of Stanford NY. The main floor includes a living room, dining area and kitchen. Raised ceilings in the living and dining space create a feeling of natural light and openness. Also located on this floor is a primary bedroom with bath as well as two additional bedrooms and another full bath. Sliding glass doors open to a deck overlooking a large outdoor area with ample space for entertaining and relaxation. The peaceful outdoor area features a double-tiered pond with a pump-fed waterfall and a cozy fire pit. A meandering stream runs along the rear of the property. The lower level offe
Key facts
- Cozy wood stove
- Meandering stream
- Spacious back yard
Tags
Property features AI
Exterior
- Parking: Detached garage with garage door opener; Two garage spaces
- Utilities: Septic tank; Cable available; Electric service by Central Hudson; Generator
- Home design: Single family residence
- Construction: Vinyl siding; Blown-in insulation; Block foundation
- Exterior features: Rain gutters; Shed(s); Back yard; Front yard; Cleared and landscaped grounds; Level parcel with part wooded and rolling slope areas; Stone/brick wall
Interior
- Kitchen: Dishwasher; Electric oven; Electric range; Microwave; Refrigerator
- Bedrooms: Includes a first-floor bedroom
- Flooring: Carpet; Ceramic tile; Laminate
- Bathrooms: Two full bathrooms; One half bathroom
- Heating & cooling: Baseboard heating; Oil heating; Wall/window air conditioning units
- Interior features: First-floor bedroom and full bath; Cathedral ceilings; Ceiling fans; Chandelier; Primary bathroom; Storm doors; Blinds; Double-pane windows; Deck
- Laundry & utility: Washer and dryer included; Washer hookup; Electric dryer hookup; Laundry room; Oil water heater
Neighborhood map
What this means for you Summary
Snapshot
- This is a 3-bed/2.5-bath single-family listed at $459k.
Deal economics
- At list price, monthly cash flow is $-505 ($-6k/yr) — negative.
- To cash-flow at today's rent, offer at most $370k (19.4% below list).
- To meet the 1% rule (rent ≥ 1% of price), the offer needs to be $325k (29.2% below list).
- Recommended offer: $325k (29.2% below list) — sets the bar for 1% rule.
- Cap rate 5.1% vs local median 2.6% in Pine Plains — top-decile yield for the area; either an underpriced asset or a hidden risk that comps aren't pricing in. Stress-test before assuming the spread holds.
Location & tenants
- Location reads 64/100 on livability (#746 in NY) — a middle-class / working-renter tenant base. Strengths: crime A+, housing A+, employment B+; Watch: cost of living D+, amenities F, commute F.
- Pine Plains Central School District (rural): math 55% / reading 50% proficiency, ranked #372 of 755 in NY (top 49%) — acceptable for families but not a draw, mixed tenant base, ~2y average lease.
- Zoned schools: Cold Spring Early Learning Center (165 students, 12% FRL); Stissing Mountain Junior/Senior High School (math 92% / reading 75%, grade A, #409 of 1,100 statewide, top 39%, 460 students, 36% FRL) — zoned schools at 24% FRL track the district average.
- Zoned-school proficiency averages 84% at this address vs 52% district-wide (+31 pts) — the actual schools serving this property are materially stronger than the Pine Plains Central School District average implies; a family-tenant draw the district grade alone would hide.
- Market conditions: 12 active listings in the ZIP; 620 units permitted in Dutchess County in 2024 (242 in 5+ unit buildings).
Forward outlook
- In year one you build about $49k of equity ($3k loan paydown + $46k appreciation (10.0% local appreciation)).
- Dutchess County population projected at -11% by 2050 — secular population decline; favor cash flow + early exit over multi-decade hold.
- By year 2, paydown + projected appreciation supports a ~$79k cash-out refi (75% LTV) — recoverable capital for the next deal without selling this one.
Negotiation context
- It's been on market 49 days — a 3% lower offer ($445k) is reasonable based on typical stale-listing flexibility.
- Current owner paid $287k; list at $459k implies a 60% gain — meaningful room to come down on a strong offer.
Risks & watch-outs
- Watch-outs: flood insurance adds $56/mo.
- Climate carrying-cost: severe flood risk; moderate wildfire risk — expect insurance premiums to compound above CPI over the hold.
Questions for the listing agent
- What do current leases actually rent for vs. the listed asking? Can we see a recent rent roll and the last 12 months of T-12 income?
- It's been on market 49 days. Have you received any prior offers? Is the seller open to a 29% concession, seller financing, or rate buy-down credit?
- What's the actual annual flood-insurance premium (NFIP or private), and is the property in a SFHA with mandatory coverage?
- Is there a deadline driving the sale (1031 exchange, divorce, estate, relocation)? That informs how much negotiation room exists.
- The area grade is low — what's the realistic commute time and amenity access for the typical tenant pool here? Any planned neighborhood developments (good or bad) we should know about?
- What's the average days-on-market for RENTAL listings here right now (not sales)? A rising rental-DOM trend means longer vacancies and softer asking-rent achievability than the comps imply.
- What's the recent tenant-quality profile in this submarket — average credit score on applications, eviction rate, late-payment / NSF rate, and stable-employment percentage? A property-management company in the area should have these aggregated.
- How much new for-sale + rental construction is in the pipeline within 1–3 miles? Heavy new supply typically softens prices + rents 12–24 months out; constrained supply supports both.
Investment metrics
- 1% rule
- 0.71% ✗
- Cap rate
- 5.12%
- Cash-on-cash
- -4.20%
- DSCR
- 0.81
- GRM
- 11.8
CMA / ARV
- ARV (on-the-fly)
- $442,656
- Comps found
- 2
Show comp detail 2 sales within ~0.75 mi
| Address | Dist | Beds/Ba | Sqft | Sold | Price | $/sf | Match |
|---|---|---|---|---|---|---|---|
| 266 Layton Rd | 0.00mi | 3/2.5 | 1,908 (0%) | 1mo | $442,500 | $232 | 100 |
| 229 Layton Rd | 0.18mi | 3/3.0 | 1,986 (+4%) | 22mo | $425,000 | $214 | 64 |
Match score weights: distance 35% · size 25% · config 20% · recency 20%. Top-matched comps best support the ARV.
Projected returns pro-forma
10.0% appreciation · 3.0% rent growth · sell at horizon
- IRR
- 20.9%
- Equity multiple
- 2.69×
- Total profit
- $217,802
- Equity at exit
- $413,504
- IRR
- 19.0%
- Equity multiple
- 6.19×
- Total profit
- $666,667
- Equity at exit
- $891,736
Cash invested: $128,520 (down + closing). Projections, not guarantees.
Landlord ↔ Tenant lean methodology
- Overall (STATE)
- 15 Strongly Tenant-Friendly
- State New York
- 15 Strongly Tenant-Friendly · D+10
- County
- — inherits STATE
- City
- — inherits STATE
ZIP-level market 12581
- Home prices YoY
- 8.7%
- Active inventory
- 12
- Price-to-rent
- 11.8×
Monthly cashflow live
- Estimated rent
- $3,251 medium interval (Pro) →
- Mortgage (P&I)
- −$2,407
- Tax from tax record
- −$420 /mo · $5,036/yr
- Insurance
- −$191
- Flood insurance flood zone
- −$56 /mo · $666/yr
- HOA
- −$0
- Vacancy / Maint / Mgmt
- −$683
- Net cashflow
- $-505
Break-even live
Sensitivity live
| Price | -10% $-245 | -5% $-375 | +0% $-505 | +5% $-635 | +10% $-765 |
|---|---|---|---|---|---|
| Rent | -10% $-762 | -5% $-634 | +0% $-505 | +5% $-377 | +10% $-248 |
| Rate | -1.0pp $-274 | -0.5pp $-388 | base $-505 | +0.5pp $-624 | +1.0pp $-745 |
UW: 25.0% down · 7.5% · 30yr · 1.5% tax · 5.0% vac · 8.0% maint · 8.0% mgmt
Financing live
Cash to close
- Down payment
- $114,750
- Closing costs
- $13,770
- Reserves months
- —
- Total cash needed
- —
Loan-product check · same deal, 3 products live
Conventional
25% down · 7.5% · 30yr
- Down + closing
- —
- Monthly P&I
- —
- Monthly cashflow
- —
- DSCR
- —
- Eligible?
- —
Personal DTI + credit; lowest rate.
DSCR
20% down · 8.5% · 30yr
- Down + closing
- —
- Monthly P&I
- —
- Monthly cashflow
- —
- DSCR
- —
- Eligible?
- —
No personal income docs; deal must DSCR.
Hard money
10% down · 12.0% · 12mo
- Down + closing
- —
- Monthly P&I
- —
- Monthly cashflow
- —
- DSCR
- —
- Eligible?
- —
Short-term bridge; refi at stabilization.
Listing history 4 events
-
2026-04-17status Pending
-
2026-02-27$459,000 Active
-
2004-09-17soldstatus $287,000
-
1996-08-19soldstatus $123,750
ⓘ Source: listings_history table (triggers on properties + properties_extension) + one-shot
backfill from property_details.listing_events for pre-trigger history.
Tax reassessment forecast NY · Partial reset (capped growth)
- Current annual tax
- $5,036 · $420/mo
- Projected year-2 tax
- $6,397 · $533/mo
- Expected delta
- +$1,360/yr (+$113/mo · 27.0%)
ⓘ Screening estimate from a state-policy table — verify with the county assessor before closing.
Climate risk First Street
- Flood 8/10 Severe FEMA zone X (unshaded) · 99% chance over 30 yrs
- Wildfire 5/10 Major
- Heat 3/10 Moderate 7 d/yr ≥95°F today · 15 d/yr by 30 yrs out
- Wind 4/10 Moderate 14% chance of damaging wind over 30 yrs
- Air quality 3/10 Moderate 2 unhealthy d/yr today · 3 by 30 yrs out
Nearby sold comps map
Loading sold comps map…
Walkable amenities ~0.75 mi
Loading nearby amenities…
Taxation est. · year 1
- Rental income
- $39,014
- − Mortgage interest
- −$25,711
- − Property taxes
- −$5,036
- − Insurance
- −$2,962
- − Repairs & maintenance
- −$3,121
- − Management
- −$3,121
- − Depreciation
- −$13,353
- Taxable loss
- −$14,290
- Est. tax savings @ 24.0%
- +$3,430
- After-tax cash flow
- $-2,632/yr
For passive investors: Depreciation is non-cash, so a rental often shows a tax loss while cash-flowing — sheltering income. Rental losses are passive: they offset passive income freely, and up to $25,000/yr can offset ordinary (W-2) income if you actively participate and your MAGI is under $100k (phasing out to $0 by $150k); unused losses carry forward. On sale, claimed depreciation is recaptured at up to 25%, and gains may owe capital-gains tax (a 1031 exchange can defer both). Figures are a year-1 estimate at your 24.0% rate — not tax advice; consult a CPA.
Schools (NCES district)
- District
- Pine Plains Central School District
- NCES district ID
- 3623040
- Math proficiency
- 55% ▬ 0.00%
- Reading proficiency
- 50% ▲ 1.00%
- Median HH income
- $66,189
- Composite
- 48.33/100
- National rank
- #4688
- State rank
- #372 of 755 in NY
Livability — Pine Plains
- Score
- 64/100
- State rank
- #746
- US rank
- #14240
Category grades
Schools grade is shown separately in the Schools card above.
Census & demographics
- City population
- 2,498
- Population (ZIP)
- 1,928
Population outlook (Dutchess County) Hauer SSP2
- Today (2025)
- 291,768 people
- By 2030
- 287,131 · -1.6%
- By 2040
- 274,881 · -5.8%
- By 2050
- 259,971 · -10.9%
- By 2075
- 235,366 · -19.3%
- By 2100
- 208,786 · -28.4%
Race, ethnicity, and origin ACS 2023
- Neighborhood character
- Predominantly White (81%)
- Race & ethnicity
- White 81% Hispanic / Latino 11% Two or more races 5% Asian 3%
- Hispanic origin (detail)
- Mexican 3% Puerto Rican 8%
- Common ancestry
- Romanian 4% Iranian 3% Lithuanian 3%
- Foreign-born
- 6% · Canada, China
- Languages at home
- 83% English-only · Spanish 10% Chinese 2% German/W. Germanic 1%
Political lean MEDSL · Dutchess
- 2024 margin
- Lean D (+5.4) · D 52.7% · R 47.3%
- 2008→2024 swing
- -3.2pp toward R · 2008: 8.6pp · 2024: 5.4pp
- All cycles
- 2024: D+5.4 2020: D+9.6 2016: R+1.1 2012: D+6.6 2008: D+8.6
Not yet ingested
- Civics
- —
Market trends
- HPI YoY
- ▲ 21.70%
- Current HPI
- 270.6533
- Rent YoY
- —
- Metro
- —
- State GDP YoY
- ▲ 2.60%
- F500 in state
- 92
Industry mix (Fortune 500 HQ in NY)
| Industry | F500 HQs | Revenue |
|---|---|---|
| Financial Services | 10 | $950B |
|
||
| Consumer Goods | 9 | $162B |
|
||
| Insurance | 4 | $225B |
|
||
| Telecommunications | 2 | $144B |
|
||
| Pharmaceuticals | 2 | $112B |
|
||
| Media / Entertainment | 2 | $69B |
|
||
Price history
+270.9% since first listed4 events — show timeline
- 2026-04-17 Pending — OneKey® MLS as Distributed by MLS Grid
- 2026-02-27 Listed $459,000 OneKey® MLS as Distributed by MLS Grid
- 2004-09-17 Sold (Public Records) $287,000 Public Records
- 1996-08-19 Sold (Public Records) $123,750 Public Records
Property tax history
+2.6%/yrLatest (2025): $5,036 · -1.2% YoY. Source: county tax records.
Cash-flow waterfall
monthlySold comps — $/sqft
last 12 mo · ≤1 miLoading sold comps…