6939 County Road 378 · Henderson, TX
Flood risk No data
- FEMA flood zone
- —
- Chance of flooding over 30 yrs
- —
- Est. flood insurance / yr
- —
Fire risk No data
- Est. fire insurance / yr
- —
Heat risk No data
- Hot days now (above threshold)
- —
- Hot days in 30 yrs
- —
Wind risk No data
- Chance of severe wind over 30 yrs
- —
Air-quality risk No data
- Unhealthy air days now
- —
- Unhealthy air days in 30 yrs
- —
Risk factors via First Street. Map © Google.
Why this score? — see what drove the C grade
The composite is a weighted blend of 9 inputs, each scored 0–100. Each bar is that input's sub-score; the figure is the points it added to the 100-point composite (weight × sub-score).
- Cash flow +21.4/30.0
- ARV discount +7.5/15.0
- DSCR +6.8/10.0
- Appreciation +5.0/10.0
- 1% rule +4.9/10.0
- Livability +3.5/5.0
- Schools +2.8/10.0
- Rent growth +2.5/5.0
- Condition / age +2.5/5.0
$130,000
🖨 Deal sheet (PDF) 📄 Offer letter ✓ Due diligence
Listing remarks MLS
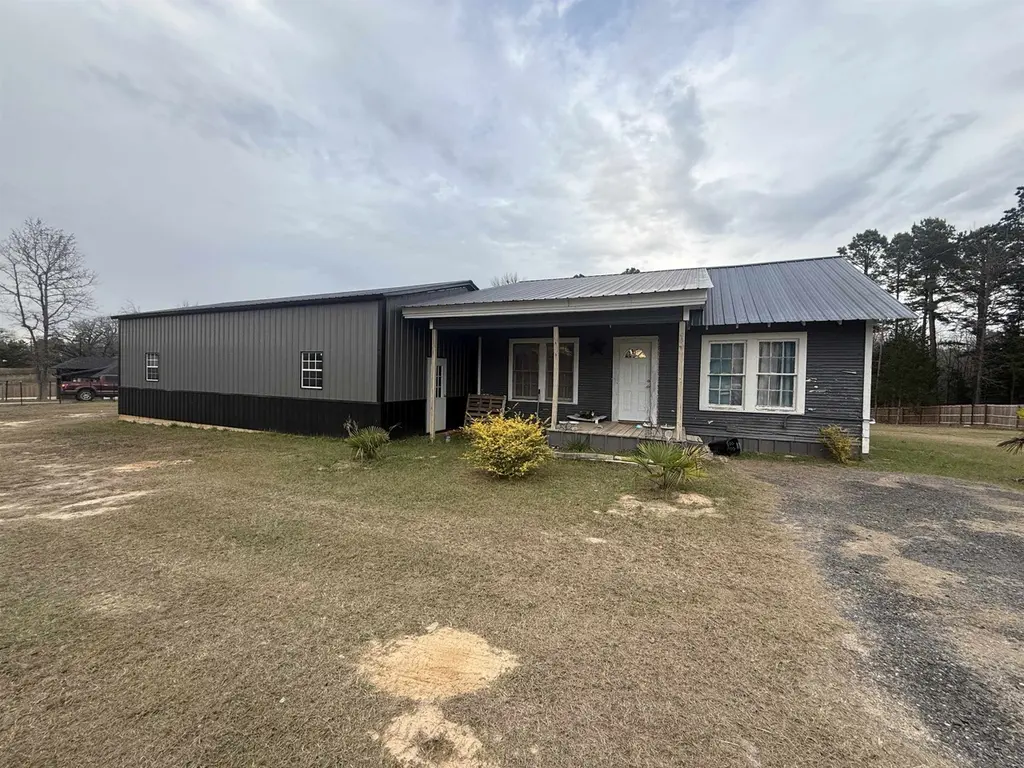
Well-maintained 2 bedroom, 1 bathroom home situated on 1 acre in a quiet country setting. Property features a new 25x40 metal shop, offering ample space for storage, projects, or a workshop. Enjoy the benefits of country living with plenty of room to expand, garden, or bring your animals. A great opportunity for those seeking space and functionality outside city limits.
Key facts
- 2 acre lot
- Listed 127 days
Neighborhood map
What this means for you Summary
Snapshot
- This is a 2-bed/1.0-bath single-family listed at $130k.
Deal economics
- At list price, monthly cash flow is $194 ($2k/yr) — positive.
- The deal already cash-flows at list — no discount required.
- To meet the 1% rule (rent ≥ 1% of price), the offer needs to be $129k (0.6% below list).
- Recommended offer: $114k (12.0% below list) — sets the bar for market timing.
- Cap rate 8.1% vs local median 2.9% in Henderson — top-decile yield for the area; either an underpriced asset or a hidden risk that comps aren't pricing in. Stress-test before assuming the spread holds.
Location & tenants
- Location reads 69/100 on livability (#408 in TX) — a middle-class / working-renter tenant base. Strengths: cost of living A+, housing A+, health & safety A+; Watch: employment D+, schools D-, crime F.
- Henderson ISD (town): math 30% / reading 35% proficiency, ranked #573 of 826 in TX (top 69%) — families likely to look elsewhere, expect single-tenant / working-renter base with shorter leases.
- Market conditions: 1 active listings in the ZIP; 4 units permitted in Rusk County in 2024 (0 in 5+ unit buildings).
Forward outlook
- In year one you build about $5k of equity ($899 loan paydown + $4k appreciation (3.0% local appreciation)).
- Rusk County population projected to shrink 5% by 2050 — rents likely to lag national; underwrite the cash flow, not the appreciation.
- At projected returns (3.0% appreciation + 3.0% rent growth), your $36k cash investment doubles in ~5 years — after that, you're playing with house money.
- By year 7, paydown + projected appreciation supports a ~$30k cash-out refi (75% LTV) — recoverable capital for the next deal without selling this one.
Negotiation context
- It's been on market 128 days — a 12% lower offer ($114k) is reasonable based on typical stale-listing flexibility.
- 6 sale attempts since 10y ago with the ask held roughly flat each time — persistent listings suggest the price (not the market) is what's stuck; bring a comps-based counter.
Questions for the listing agent
- It's been on market 128 days. Have you received any prior offers? Is the seller open to a 12% concession, seller financing, or rate buy-down credit?
- Built in 1960 — when were the roof, HVAC, electrical panel, plumbing, and water heater last replaced?
- Why hasn't it sold? Are there any deal-killer items the seller is aware of (foundation, flood, title, zoning, code violations)?
- Is there a deadline driving the sale (1031 exchange, divorce, estate, relocation)? That informs how much negotiation room exists.
- Schools are D-rated, which usually means shorter tenancies and higher turnover. Who's the typical renter profile here, and what's been the actual vacancy rate?
- Crime grade is F in this area — have there been break-ins, vandalism, or insurance claims at this property in the last 3 years? What carrier currently insures it and at what premium?
- What's the average days-on-market for RENTAL listings here right now (not sales)? A rising rental-DOM trend means longer vacancies and softer asking-rent achievability than the comps imply.
- What's the recent tenant-quality profile in this submarket — average credit score on applications, eviction rate, late-payment / NSF rate, and stable-employment percentage? A property-management company in the area should have these aggregated.
- How much new for-sale + rental construction is in the pipeline within 1–3 miles? Heavy new supply typically softens prices + rents 12–24 months out; constrained supply supports both.
Investment metrics
- 1% rule
- 0.99% ✗
- Cap rate
- 8.08%
- Cash-on-cash
- 6.39%
- DSCR
- 1.28
- GRM
- 8.4
CMA / ARV
No comps found within radius.
Projected returns pro-forma
3.0% appreciation · 3.0% rent growth · sell at horizon
- IRR
- 13.5%
- Equity multiple
- 1.77×
- Total profit
- $27,978
- Equity at exit
- $58,454
- IRR
- 15.3%
- Equity multiple
- 3.26×
- Total profit
- $82,290
- Equity at exit
- $90,084
Cash invested: $36,400 (down + closing). Projections, not guarantees.
Landlord ↔ Tenant lean methodology
- Overall (STATE)
- 87 Strongly Landlord-Friendly
- State Texas
- 87 Strongly Landlord-Friendly · R+5
- County
- — inherits STATE
- City
- — inherits STATE
ZIP-level market 75677
- Active inventory
- 1
- Price-to-rent
- 8.4×
Monthly cashflow live
- Estimated rent
- $1,292 medium interval (Pro) →
- Mortgage (P&I)
- −$682
- Tax from tax record
- −$91 /mo · $1,096/yr
- Insurance
- −$54
- HOA
- −$0
- Vacancy / Maint / Mgmt
- −$271
- Net cashflow
- $194
Break-even live
Sensitivity live
| Price | -10% $267 | -5% $231 | +0% $194 | +5% $157 | +10% $120 |
|---|---|---|---|---|---|
| Rent | -10% $92 | -5% $143 | +0% $194 | +5% $245 | +10% $296 |
| Rate | -1.0pp $259 | -0.5pp $227 | base $194 | +0.5pp $160 | +1.0pp $126 |
UW: 25.0% down · 7.5% · 30yr · 1.5% tax · 5.0% vac · 8.0% maint · 8.0% mgmt
Financing live
Cash to close
- Down payment
- $32,500
- Closing costs
- $3,900
- Reserves months
- —
- Total cash needed
- —
Loan-product check · same deal, 3 products live
Conventional
25% down · 7.5% · 30yr
- Down + closing
- —
- Monthly P&I
- —
- Monthly cashflow
- —
- DSCR
- —
- Eligible?
- —
Personal DTI + credit; lowest rate.
DSCR
20% down · 8.5% · 30yr
- Down + closing
- —
- Monthly P&I
- —
- Monthly cashflow
- —
- DSCR
- —
- Eligible?
- —
No personal income docs; deal must DSCR.
Hard money
10% down · 12.0% · 12mo
- Down + closing
- —
- Monthly P&I
- —
- Monthly cashflow
- —
- DSCR
- —
- Eligible?
- —
Short-term bridge; refi at stabilization.
Listing history 34 events
-
2026-06-19days on market $130,000 Active 128 DOM
-
2026-06-18days on market $130,000 Active 127 DOM
-
2026-06-17days on market $130,000 Active 126 DOM
-
2026-06-16days on market $130,000 Active 125 DOM
-
2026-06-15days on market $130,000 Active 124 DOM
-
2026-06-14days on market $130,000 Active 122 DOM
-
2026-06-13days on market $130,000 Active 121 DOM
-
2026-06-10days on market $130,000 Active 119 DOM
-
2026-06-09days on market $130,000 Active 118 DOM
-
2026-06-08days on market $130,000 Active 117 DOM
-
2026-06-07days on market $130,000 Active 116 DOM
-
2026-06-02days on market $130,000 Active 111 DOM
-
2026-06-01days on market $130,000 Active 110 DOM
-
2026-05-31days on market $130,000 Active 109 DOM
-
2026-05-30days on market $130,000 Active 108 DOM
-
2026-03-04price $130,000 372-char remark
Show marketing remark (372 chars)
Well-maintained 2 bedroom, 1 bathroom home situated on 1 acre in a quiet country setting. Property features a new 25x40 metal shop, offering ample space for storage, projects, or a workshop. Enjoy the benefits of country living with plenty of room to expand, garden, or bring your animals. A great opportunity for those seeking space and functionality outside city limits.
-
2026-02-11$135,000 Active 372-char remark
Show marketing remark (372 chars)
Well-maintained 2 bedroom, 1 bathroom home situated on 1 acre in a quiet country setting. Property features a new 25x40 metal shop, offering ample space for storage, projects, or a workshop. Enjoy the benefits of country living with plenty of room to expand, garden, or bring your animals. A great opportunity for those seeking space and functionality outside city limits.
-
2024-08-27soldstatus
-
2023-12-19price $469,900
-
2023-12-19price $469,900
-
2023-11-03price $484,400
-
2023-11-03price $484,400
-
2023-09-18status Active
-
2023-09-18price $489,400
-
2023-08-30historical
-
2023-08-15price $499,499
-
2023-07-09$499,400 Active
-
2023-07-08$499,500 Active
-
2017-10-06soldstatus
-
2017-10-05soldstatus
-
2017-10-05soldstatus
-
2017-08-01$35,900
-
2016-12-12$35,900
-
2011-12-20soldstatus
ⓘ Source: listings_history table (triggers on properties + properties_extension) + one-shot
backfill from property_details.listing_events for pre-trigger history.
Tax reassessment forecast TX · Resets to sale price
- Current annual tax
- $1,096 · $91/mo
- Projected year-2 tax
- $2,379 · $198/mo
- Expected delta
- +$1,283/yr (+$107/mo · 117.1%)
ⓘ Screening estimate from a state-policy table — verify with the county assessor before closing.
Nearby sold comps map
Loading sold comps map…
Walkable amenities ~0.75 mi
Loading nearby amenities…
Taxation est. · year 1
- Rental income
- $15,509
- − Mortgage interest
- −$7,282
- − Property taxes
- −$1,096
- − Insurance
- −$650
- − Repairs & maintenance
- −$1,241
- − Management
- −$1,241
- − Depreciation
- −$3,782
- Taxable income
- $218
- Est. tax owed @ 24.0%
- −$52
- After-tax cash flow
- $2,273/yr
For passive investors: Depreciation is non-cash, so a rental often shows a tax loss while cash-flowing — sheltering income. Rental losses are passive: they offset passive income freely, and up to $25,000/yr can offset ordinary (W-2) income if you actively participate and your MAGI is under $100k (phasing out to $0 by $150k); unused losses carry forward. On sale, claimed depreciation is recaptured at up to 25%, and gains may owe capital-gains tax (a 1031 exchange can defer both). Figures are a year-1 estimate at your 24.0% rate — not tax advice; consult a CPA.
Schools (NCES district)
- District
- Henderson ISD
- NCES district ID
- 4822970
- Math proficiency
- 30% ▼ -23.00%
- Reading proficiency
- 35% ▼ -13.00%
- Median HH income
- $46,296
- Composite
- 27.91/100
- National rank
- #6868
- State rank
- #573 of 826 in TX
Livability — Henderson
- Score
- 69/100
- State rank
- #408
- US rank
- #8434
Category grades
Schools grade is shown separately in the Schools card above.
Census & demographics
No demographic data for this ZIP.
Market trends
- HPI YoY
- —
- Current HPI
- —
- Rent YoY
- —
- Metro
- —
- State GDP YoY
- ▲ 3.95%
- F500 in state
- 110
Industry mix (Fortune 500 HQ in TX)
| Industry | F500 HQs | Revenue |
|---|---|---|
| Energy | 16 | $1,198B |
|
||
| Technology | 5 | $198B |
|
||
| Engineering / Construction | 4 | $72B |
|
||
| Energy Services | 3 | $60B |
|
||
| Utilities | 3 | $41B |
|
||
| Healthcare | 2 | $330B |
|
||
Price history
+262.1% since first listed19 events — show timeline
- 2026-03-04 Price Changed $130,000 LAAR
- 2026-02-11 Listed $135,000 LAAR
- 2024-08-27 Sold (Public Records) — Public Records
- 2023-12-19 Price Changed $469,900 LAAR
- 2023-12-19 Price Changed $469,900 GTAR
- 2023-11-03 Price Changed $484,400 LAAR
- 2023-11-03 Price Changed $484,400 GTAR
- 2023-09-18 Relisted — GTAR
- 2023-09-18 Price Changed $489,400 GTAR
- 2023-08-30 Delisted — GTAR
- 2023-08-15 Price Changed $499,499 LAAR
- 2023-07-09 Listed $499,400 GTAR
- 2023-07-08 Listed $499,500 LAAR
- 2017-10-06 Sold (Public Records) — Public Records
- 2017-10-05 Sold (MLS) — LAAR
- 2017-10-05 Sold (MLS) — GTAR
- 2017-08-01 Listed $35,900 GTAR
- 2016-12-12 Listed $35,900 LAAR
- 2011-12-20 Sold (Public Records) — Public Records
Property tax history
-3.4%/yrLatest (2025): $1,096 · -25.1% YoY. Source: county tax records.
Cash-flow waterfall
monthlySold comps — $/sqft
last 12 mo · ≤1 miLoading sold comps…