314 S Ohio St · King City, MO
Flood risk 1/10 · Minimal
- FEMA flood zone
- X (unshaded)
- Chance of flooding over 30 yrs
- 0.0%
- Est. flood insurance / yr
- $507 – $1,088
Fire risk 2/10 · Minimal
- Est. fire insurance / yr
- $1,054 – $1,958
Heat risk 3/10 · Minor
- Hot days now (above 105°F)
- 7 days/yr
- Hot days in 30 yrs
- 15 days/yr
Wind risk 2/10 · Minimal
- Chance of severe wind over 30 yrs
- —
Air-quality risk 2/10 · Minimal
- Unhealthy air days now
- 0 days/yr
- Unhealthy air days in 30 yrs
- 1 days/yr
Risk factors via First Street. Map © Google.
Why this score? — see what drove the D- grade
The composite is a weighted blend of 9 inputs, each scored 0–100. Each bar is that input's sub-score; the figure is the points it added to the 100-point composite (weight × sub-score).
- Cash flow +12.5/30.0
- Appreciation +5.0/10.0
- Schools +4.2/10.0
- DSCR +3.7/10.0
- Livability +3.0/5.0
- 1% rule +2.6/10.0
- Rent growth +2.5/5.0
- Condition / age +2.5/5.0
- ARV discount +0.0/15.0
$129,900
🖨 Deal sheet (PDF) 📄 Offer letter ✓ Due diligence
Listing remarks
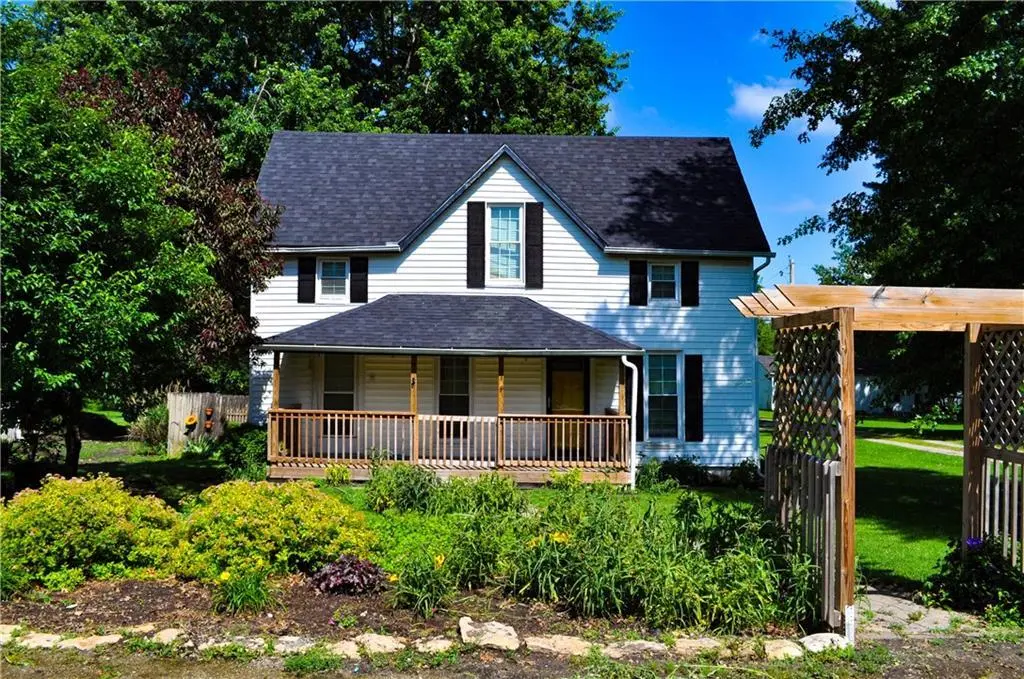
Welcome to this charming 1.5-story home located on a quiet street in the peaceful rural community of King City. Offering comfortable small-town living, this well-maintained property features two bathrooms, including one full bath and 1129 square feet of finished living space. Inside, you'll find a warm and inviting layout with plenty of character and functional living space. The home's 1.5-story design offers flexibility for bedrooms, a home office, or additional living areas to suit your needs. Outside, enjoy the benefits of a detached two-car garage, providing ample room for vehicles, storage, or a workshop. The spacious yard offers room to relax, garden, or entertain while enjoying small
Key facts
- Spacious yard
- Quiet street
- Close to downtown
Tags
Property features AI
Finance
- Other: Directions: From the 169 Hwy in King City go east on Elm St 1 block, then go south on S Ohio; house is on the east side of the road.
- HOA & community: No association fees
Exterior
- Parking: Detached 2-car garage
- Utilities: Public water; Public sewer
- Home design: Single-family residence; Residential property; Approximately 1,126 sq ft above grade; Estimated age: 101 years or older
- Construction: Vinyl siding; Composition roof
- Exterior features: Lot approximately 0.22 acres; Not in a flood plain
Interior
- Bedrooms: 2 bedrooms
- Bathrooms: 1 full bathroom
- Heating & cooling: Electric heating; Electric cooling (central)
- Interior features: Crawl space basement; 1.5-story floor plan
Neighborhood map
What this means for you Summary
Snapshot
- This is a 2-bed/3.0-bath single-family listed at $130k.
Deal economics
- At list price, monthly cash flow is $-20 ($-237/yr) — negative.
- To cash-flow at today's rent, offer at most $126k (2.7% below list).
- To meet the 1% rule (rent ≥ 1% of price), the offer needs to be $98k (24.4% below list).
- Recommended offer: $98k (24.4% below list) — sets the bar for 1% rule.
Location & tenants
- Location reads 60/100 on livability (#510 in MO) — a middle-class / working-renter tenant base. Strengths: cost of living A+, housing A+; Watch: crime F, amenities F, commute F.
- King City R-I (rural): math 45% / reading 50% proficiency, ranked #157 of 535 in MO (top 29%) — families likely to look elsewhere, expect single-tenant / working-renter base with shorter leases.
- Zoned schools: King City Elem. (math 52% / reading 52%, grade C-, #231 of 1,115 statewide, top 24%, 203 students, 43% FRL); King City High (math 32% / reading 47%, grade F, #247 of 521 statewide, top 55%, 153 students, 29% FRL) — zoned schools at 36% FRL track the district average.
- Market conditions: 12 active listings in the ZIP; 3 units permitted in Gentry County in 2024 (0 in 5+ unit buildings).
Forward outlook
- In year one you build about $899 of equity ($898 loan paydown + $1 appreciation (0.0% local appreciation)).
Negotiation context
- Only 13 days on market — expect competitive offers; lowballing is unlikely to land.
Risks & watch-outs
- Watch-outs: built in 1890 — expect roof / HVAC / electrical / plumbing capex.
Questions for the listing agent
- What do current leases actually rent for vs. the listed asking? Can we see a recent rent roll and the last 12 months of T-12 income?
- Built in 1890 — when were the roof, HVAC, electrical panel, plumbing, and water heater last replaced?
- Is there a deadline driving the sale (1031 exchange, divorce, estate, relocation)? That informs how much negotiation room exists.
- Crime grade is F in this area — have there been break-ins, vandalism, or insurance claims at this property in the last 3 years? What carrier currently insures it and at what premium?
- The area grade is low — what's the realistic commute time and amenity access for the typical tenant pool here? Any planned neighborhood developments (good or bad) we should know about?
- What's the average days-on-market for RENTAL listings here right now (not sales)? A rising rental-DOM trend means longer vacancies and softer asking-rent achievability than the comps imply.
- What's the recent tenant-quality profile in this submarket — average credit score on applications, eviction rate, late-payment / NSF rate, and stable-employment percentage? A property-management company in the area should have these aggregated.
- How much new for-sale + rental construction is in the pipeline within 1–3 miles? Heavy new supply typically softens prices + rents 12–24 months out; constrained supply supports both.
Investment metrics
- 1% rule
- 0.76% ✗
- Cap rate
- 6.11%
- Cash-on-cash
- -0.65%
- DSCR
- 0.97
- GRM
- 11.0
CMA / ARV
- ARV (on-the-fly)
- $106,970
- Comps found
- 8
Show comp detail 8 sales within ~0.75 mi
| Address | Dist | Beds/Ba | Sqft | Sold | Price | $/sf | Match |
|---|---|---|---|---|---|---|---|
| 500 S Grand Ave | 0.07mi | 2/1.0 | 1,067 (-5%) | 9mo | $115,000 | $108 | 73 |
| 314 W Vermont St | 0.35mi | 2/1.0 | 1,120 (-0%) | 3mo | $105,000 | $94 | 72 |
| 408 S Ohio St | 0.05mi | 2/1.0 | 1,207 (+7%) | 17mo | $115,000 | $95 | 63 |
| 204 S Grand Ave | 0.14mi | 2/1.0 | 1,056 (-6%) | 18mo | $109,900 | $104 | 60 |
| 608 Hampshire St | 0.46mi | 2/1.0 | 1,272 (+13%) | 0mo | $149,000 | $117 | 49 |
| 208 W Empire Ave | 0.47mi | 3/1.0 (+1) | 1,200 (+7%) | 7mo | $39,900 | $33 | 49 |
| 211 N 3rd St | 0.42mi | 3/1.5 (+1) | 1,008 (-10%) | 10mo | $80,000 | $79 | 44 |
| 204 N Prospect St | 0.38mi | 2/1.0 | 1,000 (-11%) | 23mo | $95,000 | $95 | 36 |
Match score weights: distance 35% · size 25% · config 20% · recency 20%. Top-matched comps best support the ARV.
Projected returns pro-forma
0.0% appreciation · 3.0% rent growth · sell at horizon
- IRR
- -3.0%
- Equity multiple
- 0.86×
- Total profit
- $-5,100
- Equity at exit
- $37,724
- IRR
- 2.8%
- Equity multiple
- 1.30×
- Total profit
- $10,793
- Equity at exit
- $45,350
Cash invested: $36,372 (down + closing). Projections, not guarantees.
Landlord ↔ Tenant lean methodology
- Overall (STATE)
- 81 Strongly Landlord-Friendly
- State Missouri
- 81 Strongly Landlord-Friendly · R+10
- County
- — inherits STATE
- City
- — inherits STATE
ZIP-level market 64463
- Home prices YoY
- 0.0%
- Active inventory
- 12
- Price-to-rent
- 11.0×
Monthly cashflow live
- Estimated rent
- $982 medium interval (Pro) →
- Mortgage (P&I)
- −$681
- Tax from tax record
- −$60 /mo · $724/yr
- Insurance
- −$54
- HOA
- −$0
- Vacancy / Maint / Mgmt
- −$206
- Net cashflow
- $-20
Break-even live
Sensitivity live
| Price | -10% $54 | -5% $17 | +0% $-20 | +5% $-57 | +10% $-93 |
|---|---|---|---|---|---|
| Rent | -10% $-97 | -5% $-59 | +0% $-20 | +5% $19 | +10% $58 |
| Rate | -1.0pp $46 | -0.5pp $13 | base $-20 | +0.5pp $-53 | +1.0pp $-88 |
UW: 25.0% down · 7.5% · 30yr · 1.5% tax · 5.0% vac · 8.0% maint · 8.0% mgmt
Financing live
Cash to close
- Down payment
- $32,475
- Closing costs
- $3,897
- Reserves months
- —
- Total cash needed
- —
Loan-product check · same deal, 3 products live
Conventional
25% down · 7.5% · 30yr
- Down + closing
- —
- Monthly P&I
- —
- Monthly cashflow
- —
- DSCR
- —
- Eligible?
- —
Personal DTI + credit; lowest rate.
DSCR
20% down · 8.5% · 30yr
- Down + closing
- —
- Monthly P&I
- —
- Monthly cashflow
- —
- DSCR
- —
- Eligible?
- —
No personal income docs; deal must DSCR.
Hard money
10% down · 12.0% · 12mo
- Down + closing
- —
- Monthly P&I
- —
- Monthly cashflow
- —
- DSCR
- —
- Eligible?
- —
Short-term bridge; refi at stabilization.
Listing history 11 events
-
2026-06-22days on market $129,900 Active 13 DOM
-
2026-06-21days on market $129,900 Active 12 DOM
-
2026-06-21days on market $129,900 Active 11 DOM
-
2026-06-18days on market $129,900 Active 9 DOM
-
2026-06-17days on market $129,900 Active 8 DOM
-
2026-06-16days on market $129,900 Active 7 DOM
-
2026-06-15days on market $129,900 Active 6 DOM
-
2026-06-13days on market $129,900 Active 4 DOM
-
2026-06-12days on market $129,900 Active 3 DOM
-
2026-06-09remarks 699-char remark
-
2026-06-09$129,900 Active 1 DOM
ⓘ Source: listings_history table (triggers on properties + properties_extension) + one-shot
backfill from property_details.listing_events for pre-trigger history.
Tax reassessment forecast MO · Resets to sale price
- Current annual tax
- $724 · $60/mo
- Projected year-2 tax
- $1,260 · $105/mo
- Expected delta
- +$536/yr (+$45/mo · 74.0%)
ⓘ Screening estimate from a state-policy table — verify with the county assessor before closing.
Climate risk First Street
- Flood 1/10 Low FEMA zone X (unshaded) · 0% chance over 30 yrs
- Wildfire 2/10 Low
- Heat 3/10 Moderate 7 d/yr ≥105°F today · 15 d/yr by 30 yrs out
- Wind 2/10 Low
- Air quality 2/10 Low 0 unhealthy d/yr today · 1 by 30 yrs out
Nearby sold comps map
Loading sold comps map…
Walkable amenities ~0.75 mi
Loading nearby amenities…
Taxation est. · year 1
- Rental income
- $11,786
- − Mortgage interest
- −$7,276
- − Property taxes
- −$724
- − Insurance
- −$650
- − Repairs & maintenance
- −$943
- − Management
- −$943
- − Depreciation
- −$3,779
- Taxable loss
- −$2,528
- Est. tax savings @ 24.0%
- +$607
- After-tax cash flow
- $370/yr
For passive investors: Depreciation is non-cash, so a rental often shows a tax loss while cash-flowing — sheltering income. Rental losses are passive: they offset passive income freely, and up to $25,000/yr can offset ordinary (W-2) income if you actively participate and your MAGI is under $100k (phasing out to $0 by $150k); unused losses carry forward. On sale, claimed depreciation is recaptured at up to 25%, and gains may owe capital-gains tax (a 1031 exchange can defer both). Figures are a year-1 estimate at your 24.0% rate — not tax advice; consult a CPA.
Schools (NCES district)
- District
- King City R-I
- NCES district ID
- 2916590
- Math proficiency
- 45% ▲ 5.00%
- Reading proficiency
- 50% ▬ 0.00%
- Median HH income
- $43,836
- Composite
- 42.23/100
- National rank
- #6995
- State rank
- #157 of 535 in MO
Livability — King City
- Score
- 60/100
- State rank
- #510
- US rank
- #19525
Category grades
Schools grade is shown separately in the Schools card above.
Census & demographics
- Census place
- King City, MO
- Population (ZIP)
- 1,239
Population outlook (Gentry County) Hauer SSP2
- Today (2025)
- 6,612 people
- By 2030
- 6,572 · -0.6%
- By 2040
- 6,521 · -1.4%
- By 2050
- 6,457 · -2.3%
- By 2075
- 6,346 · -4.0%
- By 2100
- 6,036 · -8.7%
Race, ethnicity, and origin ACS 2023
- Neighborhood character
- Predominantly White (95%)
- Race & ethnicity
- White 95% Asian 2% Two or more races 2% Hispanic / Latino 1%
- Common ancestry
- Lithuanian 2% Italian 2% Iranian 1%
- Foreign-born
- 2% · China
Political lean MEDSL · Gentry
- 2024 margin
- Solid R (+61.8) · D 18.7% · R 80.5%
- 2008→2024 swing
- -39.7pp toward R · 2008: -22.1pp · 2024: -61.8pp
- All cycles
- 2024: R+61.8 2020: R+60.8 2016: R+56.0 2012: R+35.0 2008: R+22.1
Not yet ingested
- Civics
- —
Market trends
- HPI YoY
- ▬ 0.00%
- Current HPI
- 176.4826
- Rent YoY
- —
- Metro
- —
- State GDP YoY
- ▲ 1.84%
- F500 in state
- 20
Industry mix (Fortune 500 HQ in MO)
| Industry | F500 HQs | Revenue |
|---|---|---|
| Healthcare | 1 | $163B |
|
||
| Insurance | 1 | $21B |
|
||
| Industrial Technology | 1 | $17B |
|
||
| Retail | 1 | $16B |
|
||
| Industrial Distribution | 1 | $10B |
|
||
| Utilities | 1 | $9B |
|
||
Price history
1 event — show timeline
- 2026-06-09 Listed $129,900 Heartland MLS as Distributed by MLS Grid
Property tax history
+2.4%/yrLatest (2025): $724 · +11.5% YoY. Source: county tax records.
Cash-flow waterfall
monthlySold comps — $/sqft
last 12 mo · ≤1 miLoading sold comps…