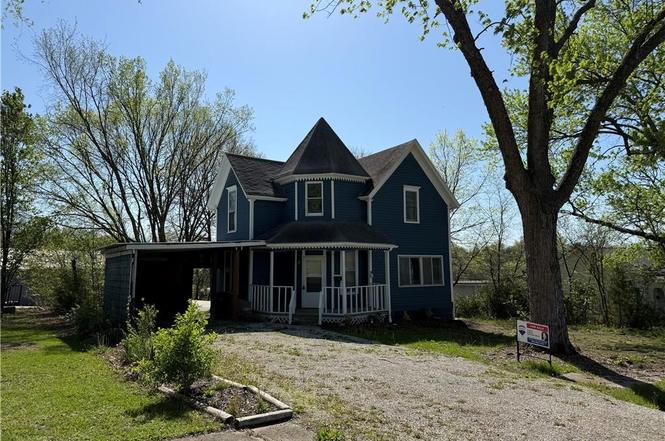
400 N 24th St · Bethany, MO
Flood risk 1/10 · Minimal
- FEMA flood zone
- X
- Chance of flooding over 30 yrs
- 0.0%
- Est. flood insurance / yr
- $473 – $860
Fire risk 4/10 · Minor
- Est. fire insurance / yr
- $1,054 – $1,958
Heat risk 3/10 · Minor
- Hot days now (above 105°F)
- 7 days/yr
- Hot days in 30 yrs
- 15 days/yr
Wind risk 2/10 · Minimal
- Chance of severe wind over 30 yrs
- —
Air-quality risk 2/10 · Minimal
- Unhealthy air days now
- 0 days/yr
- Unhealthy air days in 30 yrs
- 1 days/yr
Risk factors via First Street. Map © Google.
Why this score? — see what drove the B grade
The composite is a weighted blend of 9 inputs, each scored 0–100. Each bar is that input's sub-score; the figure is the points it added to the 100-point composite (weight × sub-score).
- Cash flow +25.4/30.0
- ARV discount +15.0/15.0
- DSCR +8.4/10.0
- Appreciation +8.3/10.0
- 1% rule +5.7/10.0
- Schools +3.5/10.0
- Livability +3.4/5.0
- Rent growth +2.5/5.0
- Condition / age +2.5/5.0
$70,000
🖨 Deal sheet (PDF) 📄 Offer letter ✓ Due diligence
Listing remarks MLS
This affordable 3-bedroom, 1-bath home is conveniently located near the town square, offering easy access to local shops and amenities. The property features an attached lean-to for additional storage and provides both front and rear parking options. With its great location and potential for added value, this home presents a great opportunity to build equity.
Key facts
- Rear parking
- Attached lean-to
- Front parking
Tags
Neighborhood map
What this means for you Summary
Snapshot
- This is a 3-bed/1.0-bath other listed at $70k.
Deal economics
- At list price, monthly cash flow is $161 ($2k/yr) — positive.
- The deal already cash-flows at list — no discount required.
- Meets the 1% rule at list price ($750 rent vs $70k).
- Recommended offer: $66k (6.0% below list) — sets the bar for market timing.
Location & tenants
- Location reads 67/100 on livability (#206 in MO) — a middle-class / working-renter tenant base. Strengths: cost of living A+, crime A, housing A; Watch: amenities F, commute F, employment F.
- South Harrison County R-II (town): math 41% / reading 42% proficiency, ranked #131 of 324 in MO (top 40%) — families likely to look elsewhere, expect single-tenant / working-renter base with shorter leases.
- Zoned schools: South Harrison Elem. (math 42% / reading 47%, grade F, #413 of 1,115 statewide, top 42%, 309 students, 60% FRL); South Harrison Middle (math 46% / reading 34%, grade F, #185 of 391 statewide, top 48%, 245 students, 58% FRL).
- Market conditions: 12 active listings in the ZIP; 1 comparable units currently listed for rent nearby; 2 units permitted in Harrison County in 2024 (0 in 5+ unit buildings).
Forward outlook
- In year one you build about $5k of equity ($484 loan paydown + $5k appreciation (6.7% local appreciation)).
- Harrison County population projected at -22% by 2050 — secular population decline; favor cash flow + early exit over multi-decade hold.
- At projected returns (6.7% appreciation + 3.0% rent growth), your $20k cash investment doubles in ~3 years — after that, you're playing with house money.
- By year 7, paydown + projected appreciation supports a ~$34k cash-out refi (75% LTV) — recoverable capital for the next deal without selling this one.
Negotiation context
- It's been on market 88 days — a 6% lower offer ($66k) is reasonable based on typical stale-listing flexibility.
- 2 sale attempts; this cycle's ask has dropped $19k (21%) from the opening price — seller is motivated, your offer sets the floor, not the list.
Risks & watch-outs
- Watch-outs: built in 1910 — expect roof / HVAC / electrical / plumbing capex.
Questions for the listing agent
- It's been on market 88 days. Have you received any prior offers? Is the seller open to a 6% concession, seller financing, or rate buy-down credit?
- Built in 1910 — when were the roof, HVAC, electrical panel, plumbing, and water heater last replaced?
- Why hasn't it sold? Are there any deal-killer items the seller is aware of (foundation, flood, title, zoning, code violations)?
- Is there a deadline driving the sale (1031 exchange, divorce, estate, relocation)? That informs how much negotiation room exists.
- Schools are D-rated, which usually means shorter tenancies and higher turnover. Who's the typical renter profile here, and what's been the actual vacancy rate?
- What's the average days-on-market for RENTAL listings here right now (not sales)? A rising rental-DOM trend means longer vacancies and softer asking-rent achievability than the comps imply.
- What's the recent tenant-quality profile in this submarket — average credit score on applications, eviction rate, late-payment / NSF rate, and stable-employment percentage? A property-management company in the area should have these aggregated.
- How much new for-sale + rental construction is in the pipeline within 1–3 miles? Heavy new supply typically softens prices + rents 12–24 months out; constrained supply supports both.
Investment metrics
- 1% rule
- 1.07% ✓
- Cap rate
- 9.06%
- Cash-on-cash
- 9.88%
- DSCR
- 1.44
- GRM
- 7.8
CMA / ARV
- ARV (median comp)
- $98,454
- List price
- $70,000
- Delta
- -28.90%
- Verdict
- UNDERPRICED
- Comps
- 10 within 1.0 mi
Projected returns pro-forma
6.7% appreciation · 3.0% rent growth · sell at horizon
- IRR
- 25.0%
- Equity multiple
- 2.70×
- Total profit
- $33,405
- Equity at exit
- $47,133
- IRR
- 23.1%
- Equity multiple
- 5.57×
- Total profit
- $89,522
- Equity at exit
- $88,313
Cash invested: $19,600 (down + closing). Projections, not guarantees.
Landlord ↔ Tenant lean methodology
- Overall (STATE)
- 81 Strongly Landlord-Friendly
- State Missouri
- 81 Strongly Landlord-Friendly · R+10
- County
- — inherits STATE
- City
- — inherits STATE
ZIP-level market 64424
- Home prices YoY
- 3.7%
- Active inventory
- 12
- Price-to-rent
- 7.8×
Monthly cashflow live
- Estimated rent
- $750 medium interval (Pro) →
- Mortgage (P&I)
- −$367
- Tax from tax record
- −$35 /mo · $419/yr
- Insurance
- −$29
- HOA
- −$0
- Vacancy / Maint / Mgmt
- −$158
- Net cashflow
- $161
Break-even live
Sensitivity live
| Price | -10% $201 | -5% $181 | +0% $161 | +5% $142 | +10% $122 |
|---|---|---|---|---|---|
| Rent | -10% $102 | -5% $132 | +0% $161 | +5% $191 | +10% $221 |
| Rate | -1.0pp $197 | -0.5pp $179 | base $161 | +0.5pp $143 | +1.0pp $125 |
UW: 25.0% down · 7.5% · 30yr · 1.5% tax · 5.0% vac · 8.0% maint · 8.0% mgmt
Financing live
Cash to close
- Down payment
- $17,500
- Closing costs
- $2,100
- Reserves months
- —
- Total cash needed
- —
Loan-product check · same deal, 3 products live
Conventional
25% down · 7.5% · 30yr
- Down + closing
- —
- Monthly P&I
- —
- Monthly cashflow
- —
- DSCR
- —
- Eligible?
- —
Personal DTI + credit; lowest rate.
DSCR
20% down · 8.5% · 30yr
- Down + closing
- —
- Monthly P&I
- —
- Monthly cashflow
- —
- DSCR
- —
- Eligible?
- —
No personal income docs; deal must DSCR.
Hard money
10% down · 12.0% · 12mo
- Down + closing
- —
- Monthly P&I
- —
- Monthly cashflow
- —
- DSCR
- —
- Eligible?
- —
Short-term bridge; refi at stabilization.
Rent comps 1 comps
| Address | Beds | Baths | Sqft | Rent | $/sqft | DOM | Units | Dist |
|---|---|---|---|---|---|---|---|---|
| 806 Railroad St Bethany, MO | 2.0 | 1.0 | 744 | $750 | $1.01 | 15d | 1 | 1.08mi |
Listing history 25 events
-
2026-06-21days on market $70,000 Active 88 DOM
-
2026-06-21days on market $70,000 Active 87 DOM
-
2026-06-18days on market $70,000 Active 85 DOM
-
2026-06-17days on market $70,000 Active 84 DOM
-
2026-06-16remarks 387-char remark
-
2026-06-16pricestatusdays on market $70,000 Active 83 DOM
-
2026-06-15days on market $78,000 Active Under Contract 82 DOM
-
2026-06-13days on market $78,000 Active Under Contract 80 DOM
-
2026-06-12days on market $78,000 Active Under Contract 79 DOM
-
2026-06-09days on market $78,000 Active Under Contract 76 DOM
-
2026-06-08days on market $78,000 Active Under Contract 75 DOM
-
2026-06-07days on market $78,000 Active Under Contract 74 DOM
-
2026-06-07days on market $78,000 Active Under Contract 73 DOM
-
2026-06-04days on market $78,000 Active Under Contract 70 DOM
-
2026-06-02days on market $78,000 Active Under Contract 69 DOM
-
2026-06-01days on market $78,000 Active Under Contract 68 DOM
-
2026-05-31days on market $78,000 Active Under Contract 67 DOM
-
2026-05-17historical Active Under Contract 361-char remark
Show marketing remark (361 chars)
This affordable 3-bedroom, 1-bath home is conveniently located near the town square, offering easy access to local shops and amenities. The property features an attached lean-to for additional storage and provides both front and rear parking options. With its great location and potential for added value, this home presents a great opportunity to build equity.
-
2026-04-28price $78,000 361-char remark
Show marketing remark (361 chars)
This affordable 3-bedroom, 1-bath home is conveniently located near the town square, offering easy access to local shops and amenities. The property features an attached lean-to for additional storage and provides both front and rear parking options. With its great location and potential for added value, this home presents a great opportunity to build equity.
-
2026-03-25$89,000 Active 361-char remark
Show marketing remark (361 chars)
This affordable 3-bedroom, 1-bath home is conveniently located near the town square, offering easy access to local shops and amenities. The property features an attached lean-to for additional storage and provides both front and rear parking options. With its great location and potential for added value, this home presents a great opportunity to build equity.
-
2025-07-16historical
-
2025-07-11price $10,000
-
2025-06-26price $50,000
-
2025-02-26$60,000 Active
-
1996-09-24soldstatus
ⓘ Source: listings_history table (triggers on properties + properties_extension) + one-shot
backfill from property_details.listing_events for pre-trigger history.
Tax reassessment forecast MO · Resets to sale price
- Current annual tax
- $419 · $35/mo
- Projected year-2 tax
- $679 · $57/mo
- Expected delta
- +$260/yr (+$22/mo · 62.0%)
ⓘ Screening estimate from a state-policy table — verify with the county assessor before closing.
Climate risk First Street
- Flood 1/10 Low FEMA zone X · 0% chance over 30 yrs
- Wildfire 4/10 Moderate
- Heat 3/10 Moderate 7 d/yr ≥105°F today · 15 d/yr by 30 yrs out
- Wind 2/10 Low
- Air quality 2/10 Low 0 unhealthy d/yr today · 1 by 30 yrs out
Nearby sold comps map
Loading sold comps map…
Walkable amenities ~0.75 mi
Loading nearby amenities…
Taxation est. · year 1
- Rental income
- $9,000
- − Mortgage interest
- −$3,921
- − Property taxes
- −$419
- − Insurance
- −$350
- − Repairs & maintenance
- −$720
- − Management
- −$720
- − Depreciation
- −$2,036
- Taxable income
- $833
- Est. tax owed @ 24.0%
- −$200
- After-tax cash flow
- $1,736/yr
For passive investors: Depreciation is non-cash, so a rental often shows a tax loss while cash-flowing — sheltering income. Rental losses are passive: they offset passive income freely, and up to $25,000/yr can offset ordinary (W-2) income if you actively participate and your MAGI is under $100k (phasing out to $0 by $150k); unused losses carry forward. On sale, claimed depreciation is recaptured at up to 25%, and gains may owe capital-gains tax (a 1031 exchange can defer both). Figures are a year-1 estimate at your 24.0% rate — not tax advice; consult a CPA.
Schools (NCES district)
- District
- South Harrison County R-II
- NCES district ID
- 2900002
- Math proficiency
- 41% ▼ -1.00%
- Reading proficiency
- 42% ▼ -5.00%
- Median HH income
- $39,716
- Composite
- 34.76/100
- National rank
- #5127
- State rank
- #131 of 324 in MO
Livability — Bethany
- Score
- 67/100
- State rank
- #206
- US rank
- #10447
Category grades
Schools grade is shown separately in the Schools card above.
Census & demographics
- Census place
- Bethany, MO
- City population
- 3,664
- Population (ZIP)
- 3,664
Population outlook (Harrison County) Hauer SSP2
- Today (2025)
- 7,893 people
- By 2030
- 7,511 · -4.8%
- By 2040
- 6,811 · -13.7%
- By 2050
- 6,131 · -22.3%
- By 2075
- 4,814 · -39.0%
- By 2100
- 3,643 · -53.8%
Race, ethnicity, and origin ACS 2023
- Neighborhood character
- Predominantly White (93%)
- Race & ethnicity
- White 93% Hispanic / Latino 3% Two or more races 3% Black 1%
- Common ancestry
- Iranian 4% Slovak 2% Lithuanian 1%
- Foreign-born
- 2% · Canada, South Korea
Political lean MEDSL · Harrison
- 2024 margin
- Solid R (+71.8) · D 13.9% · R 85.6%
- 2008→2024 swing
- -40.5pp toward R · 2008: -31.3pp · 2024: -71.8pp
- All cycles
- 2024: R+71.8 2020: R+68.0 2016: R+64.9 2012: R+44.4 2008: R+31.3
Not yet ingested
- Civics
- —
Market trends
- HPI YoY
- ▲ 6.70%
- Current HPI
- 187.1418
- Rent YoY
- —
- Metro
- —
- State GDP YoY
- ▲ 1.84%
- F500 in state
- 20
Industry mix (Fortune 500 HQ in MO)
| Industry | F500 HQs | Revenue |
|---|---|---|
| Healthcare | 1 | $163B |
|
||
| Insurance | 1 | $21B |
|
||
| Industrial Technology | 1 | $17B |
|
||
| Retail | 1 | $16B |
|
||
| Industrial Distribution | 1 | $10B |
|
||
| Utilities | 1 | $9B |
|
||
Price history
+30.0% since first listed8 events — show timeline
- 2026-05-17 Contingent — Heartland MLS as Distributed by MLS Grid
- 2026-04-28 Price Changed $78,000 Heartland MLS as Distributed by MLS Grid
- 2026-03-25 Listed $89,000 Heartland MLS as Distributed by MLS Grid
- 2025-07-16 Listing Removed — Heartland MLS as Distributed by MLS Grid
- 2025-07-11 Price Changed $10,000 Heartland MLS as Distributed by MLS Grid
- 2025-06-26 Price Changed $50,000 Heartland MLS as Distributed by MLS Grid
- 2025-02-26 Listed $60,000 Heartland MLS as Distributed by MLS Grid
- 1996-09-24 Sold (Public Records) — Public Records
Property tax history
+1.8%/yrLatest (2025): $419 · +9.8% YoY. Source: county tax records.
Cash-flow waterfall
monthlySold comps — $/sqft
last 12 mo · ≤1 miLoading sold comps…