 🏗️ New Construction
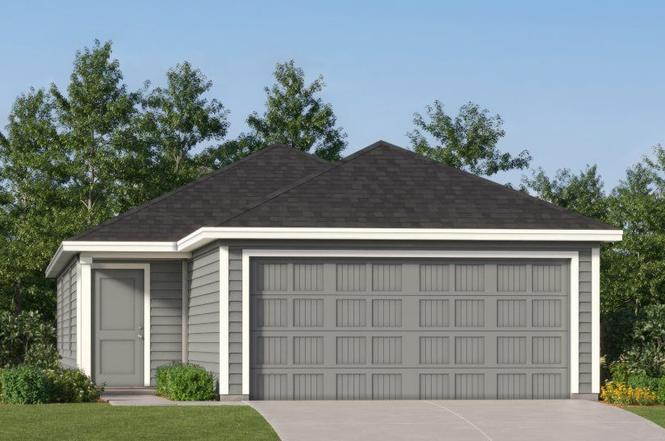
Brower Plan · San Antonio, TX
Flood risk No data
- FEMA flood zone
- —
- Chance of flooding over 30 yrs
- —
- Est. flood insurance / yr
- —
Fire risk No data
- Est. fire insurance / yr
- —
Heat risk No data
- Hot days now (above threshold)
- —
- Hot days in 30 yrs
- —
Wind risk No data
- Chance of severe wind over 30 yrs
- —
Air-quality risk No data
- Unhealthy air days now
- —
- Unhealthy air days in 30 yrs
- —
Risk factors via First Street. Map © Google.
Why this score? — see what drove the C- grade
The composite is a weighted blend of 9 inputs, each scored 0–100. Each bar is that input's sub-score; the figure is the points it added to the 100-point composite (weight × sub-score).
- Cash flow +16.9/30.0
- ARV discount +7.5/15.0
- Appreciation +7.0/10.0
- DSCR +5.3/10.0
- 1% rule +4.6/10.0
- Livability +4.0/5.0
- Rent growth +2.5/5.0
- Condition / age +2.5/5.0
- Schools +1.8/10.0
$169,999
🖨 Deal sheet (PDF) 📄 Offer letter ✓ Due diligence
Key facts
- restaurants
- Nearby shopping
- entertainment
Tags
Property features AI
Finance
- Other: Virtual tour available
- Financial info: List price $169,999; Listing status: Active
Exterior
- Parking: 2 garage spaces (2 total parking spaces)
- Home design: New construction plan named Brower; Plan-type inventory
- Construction: Living area approximately 1,213 (value provided by listing)
- Exterior features: Located at 20384 Agate Rdg, San Antonio, TX 78264
Interior
- Kitchen: Modern kitchen (details not provided)
- Bedrooms: 3 bedrooms
- Bathrooms: 2 full bathrooms
- Interior features: Open floor plan (new construction Plan: Brower)
- Laundry & utility: Laundry/utility area (details not provided)
Neighborhood map
What this means for you Summary
Snapshot
- This is a 3-bed/2.0-bath single-family listed at $170k.
Deal economics
- At list price, monthly cash flow is $92 ($1k/yr) — positive.
- To cash-flow at today's rent, offer at most $154k (9.4% below list).
- To meet the 1% rule (rent ≥ 1% of price), the offer needs to be $135k (20.7% below list).
- Recommended offer: $135k (20.7% below list) — sets the bar for 1% rule.
- Cap rate 7.1% vs local median 3.8% in San Antonio — top-decile yield for the area; either an underpriced asset or a hidden risk that comps aren't pricing in. Stress-test before assuming the spread holds.
Location & tenants
- Location reads 80/100 on livability (#31 in TX, #1,616 nationally) — a professional / high-income tenant draw. Strengths: amenities A+, commute A+, cost of living A+; Watch: crime F.
- Southside ISD (rural): math 16% / reading 25% proficiency, ranked #771 of 826 in TX (top 93%) — low school quality limits family demand, transient renter base, plan for 1-2y turnover; 76% free/reduced lunch — lower-income household profile, screen leases tightly.
- Zoned schools: Heritage El (math 25% / reading 32%, grade F, #2,706 of 4,322 statewide, top 63%, 485 students, 90% FRL); Julius L Matthey Middle (math 17% / reading 25%, grade F, #1,387 of 1,662 statewide, top 85%, 604 students, 92% FRL); Southside H S (math 18% / reading 25%, grade F, #1,377 of 1,632 statewide, top 85%, 1,685 students, 85% FRL).
- Market conditions: 359 active listings in the ZIP; 23 comparable units currently listed for rent nearby; rentals at typical pace (median 20d on market — plan ~3-4 weeks tenant-placement turnaround); 8,308 units permitted in Bexar County in 2024 (2,506 in 5+ unit buildings).
Forward outlook
- In year one you build about $7k of equity ($973 loan paydown + $6k appreciation (3.9% local appreciation)).
- Bexar County population projected at +50% by 2050 — long-run rental-demand tailwind backs the buy-and-hold thesis.
- At projected returns (3.9% appreciation + 3.0% rent growth), your $39k cash investment doubles in ~5 years — after that, you're playing with house money.
- By year 6, paydown + projected appreciation supports a ~$35k cash-out refi (75% LTV) — recoverable capital for the next deal without selling this one.
Negotiation context
- It's been on market 197 days — a 12% lower offer ($150k) is reasonable based on typical stale-listing flexibility.
Questions for the listing agent
- It's been on market 197 days. Have you received any prior offers? Is the seller open to a 21% concession, seller financing, or rate buy-down credit?
- Why hasn't it sold? Are there any deal-killer items the seller is aware of (foundation, flood, title, zoning, code violations)?
- Is there a deadline driving the sale (1031 exchange, divorce, estate, relocation)? That informs how much negotiation room exists.
- Crime grade is F in this area — have there been break-ins, vandalism, or insurance claims at this property in the last 3 years? What carrier currently insures it and at what premium?
- What's the average days-on-market for RENTAL listings here right now (not sales)? A rising rental-DOM trend means longer vacancies and softer asking-rent achievability than the comps imply.
- What's the recent tenant-quality profile in this submarket — average credit score on applications, eviction rate, late-payment / NSF rate, and stable-employment percentage? A property-management company in the area should have these aggregated.
- How much new for-sale + rental construction is in the pipeline within 1–3 miles? Heavy new supply typically softens prices + rents 12–24 months out; constrained supply supports both.
Investment metrics
- 1% rule
- 0.96% ✗
- Cap rate
- 7.08%
- Cash-on-cash
- 2.82%
- DSCR
- 1.13
- GRM
- 8.7
CMA / ARV
- ARV (on-the-fly)
- $140,708
- Comps found
- 12
Show comp detail 12 sales within ~0.75 mi
| Address | Dist | Beds/Ba | Sqft | Sold | Price | $/sf | Match |
|---|---|---|---|---|---|---|---|
| 2914 Carnelian Trl | 0.07mi | 3/2.5 | 1,189 (-2%) | 2mo | $138,999 | $117 | 90 |
| 20606 Andalusite Way | 0.13mi | 3/2.5 | 1,189 (-2%) | 2mo | $135,999 | $114 | 88 |
| 20503 Andalusite Way | 0.14mi | 3/2.5 | 1,189 (-2%) | 1mo | $137,999 | $116 | 87 |
| 20564 Andalusite Way | 0.13mi | 3/2.5 | 1,189 (-2%) | 2mo | $142,999 | $120 | 87 |
| 20511 Andalusite Way | 0.16mi | 3/2.5 | 1,189 (-2%) | 1mo | $137,999 | $116 | 87 |
| 20556 Andalusite Way | 0.13mi | 3/2.5 | 1,189 (-2%) | 3mo | $135,999 | $114 | 86 |
| 20642 Andalusite Way | 0.17mi | 3/2.5 | 1,189 (-2%) | 1mo | $157,999 | $133 | 86 |
| 20618 Andalusite Way | 0.15mi | 3/2.5 | 1,189 (-2%) | 2mo | $137,999 | $116 | 86 |
| 20626 Andalusite Way | 0.16mi | 3/2.5 | 1,360 (+12%) | 0mo | $146,999 | $108 | 70 |
| 20568 Andalusite Way | 0.13mi | 3/2.5 | 1,360 (+12%) | 3mo | $168,999 | $124 | 69 |
| 20614 Andalusite Way | 0.15mi | 3/2.5 | 1,360 (+12%) | 2mo | $148,999 | $110 | 69 |
| 2706 Jasper Stone | 0.22mi | 3/2.0 | 1,380 (+14%) | 1mo | $141,999 | $103 | 66 |
Match score weights: distance 35% · size 25% · config 20% · recency 20%. Top-matched comps best support the ARV.
Projected returns pro-forma
3.94% appreciation · 3.0% rent growth · sell at horizon
- IRR
- 12.6%
- Equity multiple
- 1.76×
- Total profit
- $30,022
- Equity at exit
- $70,890
- IRR
- 14.1%
- Equity multiple
- 3.29×
- Total profit
- $90,169
- Equity at exit
- $115,588
Cash invested: $39,398 (down + closing). Projections, not guarantees.
Landlord ↔ Tenant lean methodology
- Overall (STATE)
- 87 Strongly Landlord-Friendly
- State Texas
- 87 Strongly Landlord-Friendly · R+5
- County
- — inherits STATE
- City
- — inherits STATE
ZIP-level market 78264
- Home prices YoY
- 1.3%
- Active inventory
- 359
- Price-to-rent
- 10.5×
Monthly cashflow live
- Estimated rent
- $1,348 high interval (Pro) →
- Mortgage (P&I)
- −$738
- Tax est. 1.5%
- −$176 /mo · $2,111/yr
- Insurance
- −$59
- HOA
- −$0
- Vacancy / Maint / Mgmt
- −$283
- Net cashflow
- $92
Break-even live
Sensitivity live
| Price | -10% $190 | -5% $141 | +0% $92 | +5% $44 | +10% $-5 |
|---|---|---|---|---|---|
| Rent | -10% $-14 | -5% $39 | +0% $92 | +5% $146 | +10% $199 |
| Rate | -1.0pp $163 | -0.5pp $128 | base $92 | +0.5pp $56 | +1.0pp $19 |
UW: 25.0% down · 7.5% · 30yr · 1.5% tax · 5.0% vac · 8.0% maint · 8.0% mgmt
Financing live
Cash to close
- Down payment
- $35,177
- Closing costs
- $4,221
- Reserves months
- —
- Total cash needed
- —
Loan-product check · same deal, 3 products live
Conventional
25% down · 7.5% · 30yr
- Down + closing
- —
- Monthly P&I
- —
- Monthly cashflow
- —
- DSCR
- —
- Eligible?
- —
Personal DTI + credit; lowest rate.
DSCR
20% down · 8.5% · 30yr
- Down + closing
- —
- Monthly P&I
- —
- Monthly cashflow
- —
- DSCR
- —
- Eligible?
- —
No personal income docs; deal must DSCR.
Hard money
10% down · 12.0% · 12mo
- Down + closing
- —
- Monthly P&I
- —
- Monthly cashflow
- —
- DSCR
- —
- Eligible?
- —
Short-term bridge; refi at stabilization.
Rent comps 23 comps
| Address | Beds | Baths | Sqft | Rent | $/sqft | DOM | Units | Dist |
|---|---|---|---|---|---|---|---|---|
| 3008 Carnelian Trl San Antonio, TX | 3.0 | 2.5 | 1189 | $1,195 | $1.01 | 4d | 1 | 0.04mi |
| 2906 Carnelian Trl San Antonio, TX | 3.0 | 2.0 | 1360 | $1,550 | $1.14 | 45d | 1 | 0.04mi |
| 20447 Red Coral San Antonio, TX | 3.0 | 2.0 | 1230 | $1,320 | $1.07 | 25d | 1 | 0.05mi |
| 20356 Andalusite Way San Antonio, TX | 2.0 | 2.5 | 1013 | $1,199 | $1.18 | 19d | 1 | 0.06mi |
| 20448 Red Coral San Antonio, TX | 3.0 | 2.0 | 1129 | $1,500 | $1.33 | 25d | 1 | 0.08mi |
| 20310 Andalusite Way San Antonio, TX | 2.0 | 2.0 | 741 | $1,250 | $1.69 | 0d | 1 | 0.08mi |
| 20305 Andalusite Way San Antonio, TX | 3.0 | 2.5 | 1207 | $1,400 | $1.16 | 18d | 1 | 0.11mi |
| 20305 Andalusite Way San Antonio, TX | 3.0 | 2.5 | 1207 | $1,350 | $1.12 | 45d | 1 | 0.11mi |
| 20305 Andalusite Way San Antonio, TX | 3.0 | 2.5 | 1207 | $1,400 | $1.16 | 0d | 1 | 0.11mi |
| 20618 Andalusite Way San Antonio, TX | 3.0 | 2.0 | 1179 | $1,450 | $1.23 | 6d | 1 | 0.12mi |
| 20642 Andalusite Way San Antonio, TX | 3.0 | 2.5 | 1189 | $1,450 | $1.22 | 23d | 1 | 0.13mi |
| 20511 Andalusite Way San Antonio, TX | 3.0 | 2.5 | 1189 | $1,450 | $1.22 | 19d | 1 | 0.14mi |
| 2807 Ruby Xing San Antonio, TX | 3.0 | 2.0 | 1276 | $1,400 | $1.10 | 25d | 1 | 0.15mi |
| 3230 S Loop 1604 E Unit B1 San Antonio, TX | 2.0 | 1.0 | 768 | $895 | $1.17 | 4d | 1 | 0.43mi |
| 3230 S Loop 1604 E San Antonio, TX | 2.0 | 2.0 | 896 | $950 | $1.06 | 0d | 1 | 0.43mi |
| 20335 Campbellton Rd San Antonio, TX | 3.0 | 2.0 | 1393 | $1,450 | $1.04 | 45d | 1 | 0.49mi |
| 3230 South Loop 1604 E Unit A08 San Antonio, TX | 3.0 | 2.0 | 1216 | $995 | $0.82 | 25d | 1 | 0.52mi |
| 3230 South Loop 1604 E Unit B03 San Antonio, TX | 2.0 | 2.0 | 896 | $950 | $1.06 | 25d | 1 | 0.52mi |
| 3230 South Loop 1604 E Unit A08 San Antonio, TX | 3.0 | 2.0 | 1216 | $995 | $0.82 | 4d | 1 | 0.52mi |
| 3230 South Loop 1604 E Unit B03 San Antonio, TX | 2.0 | 2.0 | 896 | $950 | $1.06 | 4d | 1 | 0.52mi |
| 20823 Pinon Grv San Antonio, TX | 3.0 | 2.0 | 1403 | $1,650 | $1.18 | 45d | 1 | 1.02mi |
| 19230 FM 1937 #4 San Antonio, TX | 2.0 | 2.0 | 1316 | $1,450 | $1.10 | 25d | 1 | 1.12mi |
| 19230 FM 1937 #4 San Antonio, TX | 2.0 | 2.0 | 1316 | $1,450 | $1.10 | 0d | 1 | 1.12mi |
Listing history 13 events
-
2026-06-21days on market $169,999 Active 197 DOM
-
2026-06-18days on market $169,999 Active 194 DOM
-
2026-06-17days on market $169,999 Active 193 DOM
-
2026-06-16days on market $169,999 Active 192 DOM
-
2026-06-15days on market $169,999 Active 191 DOM
-
2026-06-13days on market $169,999 Active 189 DOM
-
2026-06-13days on market $169,999 Active 188 DOM
-
2026-06-09days on market $169,999 Active 185 DOM
-
2026-06-08days on market $169,999 Active 184 DOM
-
2026-06-07days on market $169,999 Active 183 DOM
-
2026-06-04days on market $169,999 Active 180 DOM
-
2026-06-03days on market $169,999 Active 179 DOM
-
2026-06-02$169,999 Active 178 DOM
ⓘ Source: listings_history table (triggers on properties + properties_extension) + one-shot
backfill from property_details.listing_events for pre-trigger history.
Nearby sold comps map
Loading sold comps map…
Walkable amenities ~0.75 mi
Loading nearby amenities…
Taxation est. · year 1
- Rental income
- $16,175
- − Mortgage interest
- −$7,882
- − Property taxes
- −$2,111
- − Insurance
- −$704
- − Repairs & maintenance
- −$1,294
- − Management
- −$1,294
- − Depreciation
- −$4,093
- Taxable loss
- −$1,203
- Est. tax savings @ 24.0%
- +$289
- After-tax cash flow
- $1,398/yr
For passive investors: Depreciation is non-cash, so a rental often shows a tax loss while cash-flowing — sheltering income. Rental losses are passive: they offset passive income freely, and up to $25,000/yr can offset ordinary (W-2) income if you actively participate and your MAGI is under $100k (phasing out to $0 by $150k); unused losses carry forward. On sale, claimed depreciation is recaptured at up to 25%, and gains may owe capital-gains tax (a 1031 exchange can defer both). Figures are a year-1 estimate at your 24.0% rate — not tax advice; consult a CPA.
Schools (NCES district)
- District
- Southside ISD
- NCES district ID
- 4840920
- Math proficiency
- 16% ▼ -15.00%
- Reading proficiency
- 25% ▼ -2.00%
- Median HH income
- $43,526
- Composite
- 17.68/100
- National rank
- #9027
- State rank
- #771 of 826 in TX
Livability — San Antonio
- Score
- 80/100
- State rank
- #31
- US rank
- #1616
Category grades
Schools grade is shown separately in the Schools card above.
Census & demographics
- City population
- 1,806,925
- Population (ZIP)
- 11,702
Population outlook (Bexar County) Hauer SSP2
- Today (2025)
- 2,336,851 people
- By 2030
- 2,560,728 · +9.6%
- By 2040
- 3,020,569 · +29.3%
- By 2050
- 3,493,522 · +49.5%
- By 2075
- 4,668,459 · +99.8%
- By 2100
- 5,533,242 · +136.8%
Race, ethnicity, and origin ACS 2023
- Neighborhood character
- Predominantly Hispanic (80%)
- Race & ethnicity
- Hispanic / Latino 80% Two or more races 35% White 17% Black 2% Native American 1%
- Hispanic origin (detail)
- Mexican 73%
- Common ancestry
- Lithuanian 1% Serbian 1% Greek 1%
- Foreign-born
- 14% · Canada
- Languages at home
- 48% English-only · Spanish 51% Tagalog/Filipino 0%
Political lean MEDSL · Bexar
- 2024 margin
- Lean D (+9.8) · D 54.3% · R 44.6% · Other 1.1%
- 2008→2024 swing
- +4.2pp toward D · 2008: 5.6pp · 2024: 9.8pp
- All cycles
- 2024: D+9.8 2020: D+18.2 2016: D+13.5 2012: D+4.6 2008: D+5.6
Not yet ingested
- Civics
- —
Market trends
- HPI YoY
- ▲ 3.94%
- Current HPI
- 298.8446
- Rent YoY
- —
- Metro
- —
- State GDP YoY
- ▲ 3.95%
- F500 in state
- 110
Industry mix (Fortune 500 HQ in TX)
| Industry | F500 HQs | Revenue |
|---|---|---|
| Energy | 16 | $1,198B |
|
||
| Technology | 5 | $198B |
|
||
| Engineering / Construction | 4 | $72B |
|
||
| Energy Services | 3 | $60B |
|
||
| Utilities | 3 | $41B |
|
||
| Healthcare | 2 | $330B |
|
||
Cash-flow waterfall
monthlySold comps — $/sqft
last 12 mo · ≤1 miLoading sold comps…