 🏗️ New Construction
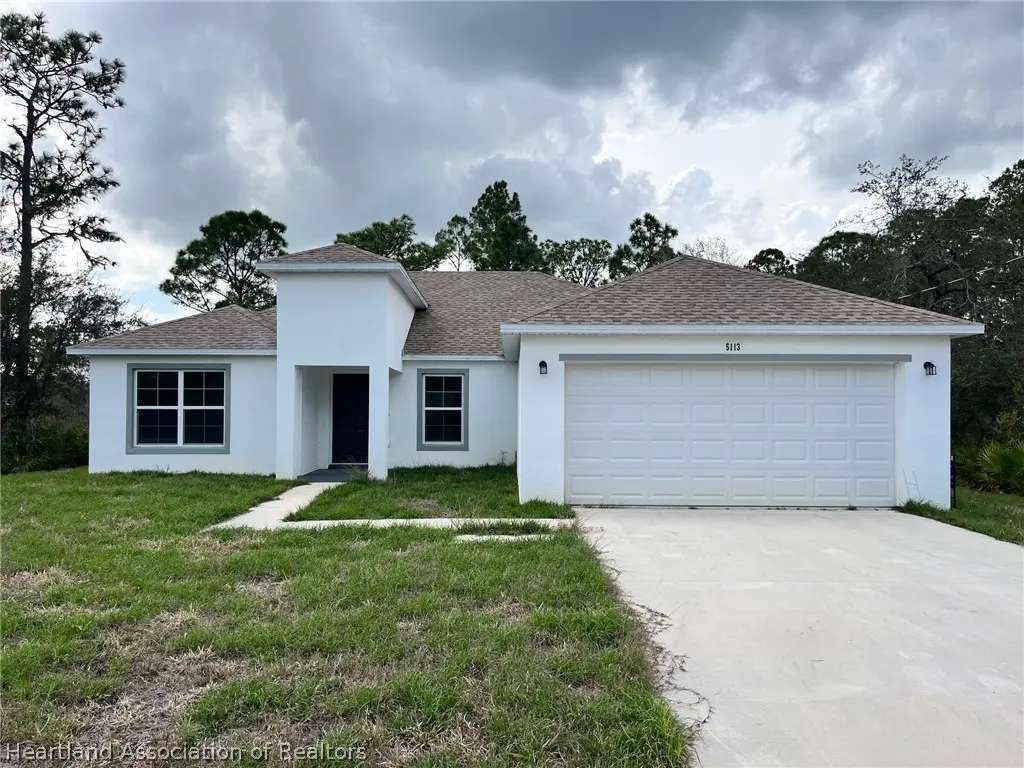
5113 Trevino Ave · Avon Park, FL
Flood risk 1/10 · Minimal
- FEMA flood zone
- X (unshaded)
- Chance of flooding over 30 yrs
- 0.0%
- Est. flood insurance / yr
- $507 – $1,088
Fire risk 4/10 · Minor
- Est. fire insurance / yr
- $947 – $1,759
Heat risk 8/10 · Major
- Hot days now (above 107°F)
- 7 days/yr
- Hot days in 30 yrs
- 25 days/yr
Wind risk 9/10 · Severe
- Chance of severe wind over 30 yrs
- 99.0%
Air-quality risk 2/10 · Minimal
- Unhealthy air days now
- 2 days/yr
- Unhealthy air days in 30 yrs
- 2 days/yr
Risk factors via First Street. Map © Google.
Why this score? — see what drove the D- grade
The composite is a weighted blend of 9 inputs, each scored 0–100. Each bar is that input's sub-score; the figure is the points it added to the 100-point composite (weight × sub-score).
- Cash flow +10.6/30.0
- ARV discount +7.5/15.0
- Schools +3.6/10.0
- Livability +3.6/5.0
- DSCR +3.1/10.0
- Rent growth +2.9/5.0
- Condition / age +2.5/5.0
- 1% rule +1.9/10.0
- Appreciation +0.0/10.0
$294,900
🖨 Deal sheet (PDF) 📄 Offer letter ✓ Due diligence
Listing remarks MLS
Residential Lot. Paved Road. Electric near by.
Key facts
- Split floorplan
- Ensuite bathroom
- Open concept layout
Tags
Property features AI
Finance
- HOA & community: Community clubhouse; Community golf; Community playground; Community pool
Exterior
- Parking: 2-car garage
- Utilities: Private well water; Septic tank sewer
- Home design: Single-family residence; One story; New construction
- Construction: Block and concrete construction; Shingle roof
- Exterior features: Front porch; Rear porch; Community pool access
Interior
- Flooring: Vinyl flooring
- Bathrooms: 2 full bathrooms
- Heating & cooling: Central electric heating; Central electric cooling
- Interior features: Vinyl flooring; 11 total rooms
Neighborhood map
What this means for you Summary
Snapshot
- This is a 4-bed/2.0-bath land listed at $295k.
Deal economics
- At list price, monthly cash flow is $-143 ($-2k/yr) — negative.
- To cash-flow at today's rent, offer at most $270k (8.6% below list).
- To meet the 1% rule (rent ≥ 1% of price), the offer needs to be $204k (31.0% below list).
- Recommended offer: $204k (31.0% below list) — sets the bar for 1% rule.
- Cap rate 5.7% vs local median 3.8% in Avon Park — top-decile yield for the area; either an underpriced asset or a hidden risk that comps aren't pricing in. Stress-test before assuming the spread holds.
Location & tenants
- Location reads 71/100 on livability (#407 in FL) — a middle-class / working-renter tenant base. Strengths: cost of living A+, housing A+, health & safety A+; Watch: crime D+, amenities F, commute F.
- Highlands (other): math 45% / reading 43% proficiency, ranked #54 of 73 in FL (top 74%) — families likely to look elsewhere, expect single-tenant / working-renter base with shorter leases; 68% free/reduced lunch — lower-income household profile, screen leases tightly.
- Zoned schools: Sun 'N Lake Elementary School (math 63% / reading 59%, grade B, #653 of 2,144 statewide, top 31%, 618 students, 67% FRL); Hill-Gustat Middle School (math 53% / reading 50%, grade C, #232 of 571 statewide, top 41%, 705 students, 63% FRL); Avon Park High School (math 35% / reading 39%, grade F, #340 of 667 statewide, top 52%, 928 students, 67% FRL) — zoned schools at 66% FRL track the district average.
- Market conditions: Rents rising (+1.6%/yr); 705 active listings in the ZIP; 980 units permitted in Highlands County in 2024 (80 in 5+ unit buildings).
- This rent runs 35% of the median local income ($70k/yr) — at the standard rent-burdened threshold; future hikes will face affordability resistance.
Forward outlook
- Local home prices are declining (-3.0%/yr); year-one equity from $2k of loan paydown is wiped out by about $9k of value loss. Plan a longer hold.
Negotiation context
- It's been on market 57 days — a 3% lower offer ($286k) is reasonable based on typical stale-listing flexibility.
- 2 sale attempts since 5y ago with the ask held roughly flat each time — persistent listings suggest the price (not the market) is what's stuck; bring a comps-based counter.
- Current owner paid $13k; list at $295k implies a 2168% gain — meaningful room to come down on a strong offer.
Risks & watch-outs
- Climate carrying-cost: severe wind risk, 99% chance of damaging wind over 30y; extreme-heat days projected 7→25/yr by 2055 (HVAC capex compounding) — expect insurance premiums to compound above CPI over the hold.
Questions for the listing agent
- What do current leases actually rent for vs. the listed asking? Can we see a recent rent roll and the last 12 months of T-12 income?
- It's been on market 57 days. Have you received any prior offers? Is the seller open to a 31% concession, seller financing, or rate buy-down credit?
- Is there a deadline driving the sale (1031 exchange, divorce, estate, relocation)? That informs how much negotiation room exists.
- Schools are F-rated, which usually means shorter tenancies and higher turnover. Who's the typical renter profile here, and what's been the actual vacancy rate?
- Crime grade is D in this area — have there been break-ins, vandalism, or insurance claims at this property in the last 3 years? What carrier currently insures it and at what premium?
- The area grade is low — what's the realistic commute time and amenity access for the typical tenant pool here? Any planned neighborhood developments (good or bad) we should know about?
- What's the average days-on-market for RENTAL listings here right now (not sales)? A rising rental-DOM trend means longer vacancies and softer asking-rent achievability than the comps imply.
- What's the recent tenant-quality profile in this submarket — average credit score on applications, eviction rate, late-payment / NSF rate, and stable-employment percentage? A property-management company in the area should have these aggregated.
- How much new for-sale + rental construction is in the pipeline within 1–3 miles? Heavy new supply typically softens prices + rents 12–24 months out; constrained supply supports both.
Investment metrics
- 1% rule
- 0.69% ✗
- Cap rate
- 5.71%
- Cash-on-cash
- -2.08%
- DSCR
- 0.91
- GRM
- 12.1
CMA / ARV
No comps found within radius.
Projected returns pro-forma
-3.0% appreciation · 1.65% rent growth · sell at horizon
- IRR
- -21.1%
- Equity multiple
- 0.28×
- Total profit
- $-59,771
- Equity at exit
- $43,971
- IRR
- -17.6%
- Equity multiple
- 0.09×
- Total profit
- $-75,264
- Equity at exit
- $25,498
Cash invested: $82,572 (down + closing). Projections, not guarantees.
Landlord ↔ Tenant lean methodology
- Overall (STATE)
- 87 Strongly Landlord-Friendly
- State Florida
- 87 Strongly Landlord-Friendly · R+3
- County
- — inherits STATE
- City
- — inherits STATE
ZIP-level market 33872
- Home prices YoY
- -25.8%
- Rents YoY
- 1.6%
- Active inventory
- 705
- Price-to-rent
- 12.1×
Monthly cashflow live
- Estimated rent
- $2,035 medium interval (Pro) →
- Mortgage (P&I)
- −$1,546
- Tax from tax record
- −$81 /mo · $976/yr
- Insurance
- −$123
- HOA
- −$0
- Vacancy / Maint / Mgmt
- −$427
- Net cashflow
- $-143
Break-even live
Sensitivity live
| Price | -10% $24 | -5% $-60 | +0% $-143 | +5% $-227 | +10% $-310 |
|---|---|---|---|---|---|
| Rent | -10% $-304 | -5% $-223 | +0% $-143 | +5% $-63 | +10% $18 |
| Rate | -1.0pp $5 | -0.5pp $-68 | base $-143 | +0.5pp $-219 | +1.0pp $-297 |
UW: 25.0% down · 7.5% · 30yr · 1.5% tax · 5.0% vac · 8.0% maint · 8.0% mgmt
Financing live
Cash to close
- Down payment
- $73,725
- Closing costs
- $8,847
- Reserves months
- —
- Total cash needed
- —
Loan-product check · same deal, 3 products live
Conventional
25% down · 7.5% · 30yr
- Down + closing
- —
- Monthly P&I
- —
- Monthly cashflow
- —
- DSCR
- —
- Eligible?
- —
Personal DTI + credit; lowest rate.
DSCR
20% down · 8.5% · 30yr
- Down + closing
- —
- Monthly P&I
- —
- Monthly cashflow
- —
- DSCR
- —
- Eligible?
- —
No personal income docs; deal must DSCR.
Hard money
10% down · 12.0% · 12mo
- Down + closing
- —
- Monthly P&I
- —
- Monthly cashflow
- —
- DSCR
- —
- Eligible?
- —
Short-term bridge; refi at stabilization.
Listing history 20 events
-
2026-06-21days on market $294,900 Active 57 DOM
-
2026-06-19days on market $294,900 Active 55 DOM
-
2026-06-18days on market $294,900 Active 54 DOM
-
2026-06-17days on market $294,900 Active 53 DOM
-
2026-06-16days on market $294,900 Active 52 DOM
-
2026-06-15days on market $294,900 Active 51 DOM
-
2026-06-14days on market $294,900 Active 49 DOM
-
2026-06-10days on market $294,900 Active 46 DOM
-
2026-06-09days on market $294,900 Active 45 DOM
-
2026-06-08days on market $294,900 Active 44 DOM
-
2026-06-07days on market $294,900 Active 43 DOM
-
2026-06-02days on market $294,900 Active 38 DOM
-
2026-06-01days on market $294,900 Active 37 DOM
-
2026-05-31days on market $294,900 Active 36 DOM
-
2026-05-30days on market $294,900 Active 35 DOM
-
2026-04-26$294,900 Active
-
2023-03-22soldstatus $13,000 Closed 46-char remark
Show marketing remark (46 chars)
Residential Lot. Paved Road. Electric near by.
-
2023-02-20historical Active Under Contract 46-char remark
Show marketing remark (46 chars)
Residential Lot. Paved Road. Electric near by.
-
2021-11-10$14,800 Active 46-char remark
Show marketing remark (46 chars)
Residential Lot. Paved Road. Electric near by.
-
2005-03-14soldstatus $18,000
ⓘ Source: listings_history table (triggers on properties + properties_extension) + one-shot
backfill from property_details.listing_events for pre-trigger history.
Tax reassessment forecast FL · Resets to sale price
- Current annual tax
- $976 · $81/mo
- Projected year-2 tax
- $2,448 · $204/mo
- Expected delta
- +$1,471/yr (+$123/mo · 150.7%)
ⓘ Screening estimate from a state-policy table — verify with the county assessor before closing.
Climate risk First Street
- Flood 1/10 Low FEMA zone X (unshaded) · 0% chance over 30 yrs
- Wildfire 4/10 Moderate
- Heat 8/10 Severe 7 d/yr ≥107°F today · 25 d/yr by 30 yrs out
- Wind 9/10 Extreme 99% chance of damaging wind over 30 yrs
- Air quality 2/10 Low 2 unhealthy d/yr today · 2 by 30 yrs out
Nearby sold comps map
Loading sold comps map…
Walkable amenities ~0.75 mi
Loading nearby amenities…
Taxation est. · year 1
- Rental income
- $24,420
- − Mortgage interest
- −$16,519
- − Property taxes
- −$976
- − Insurance
- −$1,474
- − Repairs & maintenance
- −$1,954
- − Management
- −$1,954
- − Depreciation
- −$8,579
- Taxable loss
- −$7,036
- Est. tax savings @ 24.0%
- +$1,689
- After-tax cash flow
- $-28/yr
For passive investors: Depreciation is non-cash, so a rental often shows a tax loss while cash-flowing — sheltering income. Rental losses are passive: they offset passive income freely, and up to $25,000/yr can offset ordinary (W-2) income if you actively participate and your MAGI is under $100k (phasing out to $0 by $150k); unused losses carry forward. On sale, claimed depreciation is recaptured at up to 25%, and gains may owe capital-gains tax (a 1031 exchange can defer both). Figures are a year-1 estimate at your 24.0% rate — not tax advice; consult a CPA.
Schools (NCES district)
- District
- Highlands
- NCES district ID
- 1200840
- Math proficiency
- 45% ▼ -7.00%
- Reading proficiency
- 43% ▼ -3.00%
- Median HH income
- $35,276
- Composite
- 36.42/100
- National rank
- #4672
- State rank
- #54 of 73 in FL
Livability — Avon Park
- Score
- 71/100
- State rank
- #407
- US rank
- #7205
Category grades
Schools grade is shown separately in the Schools card above.
Census & demographics
- County
- Highlands County · 98,898 people
- City population
- 25,501
- Metro
- Sebring-Avon Park, FL
- Population (ZIP)
- 13,746
- Household income
- $69,578
- Rent vs Own
- Severe rent burden
- 222.0
Population outlook (Highlands County) Hauer SSP2
- Today (2025)
- 99,674 people
- By 2030
- 99,615 · -0.1%
- By 2040
- 99,342 · -0.3%
- By 2050
- 98,242 · -1.4%
- By 2075
- 93,291 · -6.4%
- By 2100
- 79,894 · -19.8%
Race, ethnicity, and origin ACS 2023
- Neighborhood character
- Majority White (65%)
- Race & ethnicity
- White 65% Hispanic / Latino 22% Two or more races 11% Black 5% Asian 4% Native American 1%
- Hispanic origin (detail)
- Mexican 5% Puerto Rican 9% Cuban 3%
- Common ancestry
- Romanian 2% Russian 2% Slovak 2%
- Foreign-born
- 12% · Canada, Jamaica
- Languages at home
- 79% English-only · Spanish 16% Other Asian/Pacific 2% Other Indo-European 1%
Political lean MEDSL · Highlands
- 2024 margin
- Solid R (+40.8) · D 29.3% · R 70.1%
- 2008→2024 swing
- -22.7pp toward R · 2008: -18.1pp · 2024: -40.8pp
- All cycles
- 2024: R+40.8 2020: R+34.4 2016: R+32.0 2012: R+23.0 2008: R+18.1
Not yet ingested
- Civics
- —
Market trends
- HPI YoY
- ▼ -78.20%
- Current HPI
- 225.3761
- Rent YoY
- ▲ 1.65%
- Metro
- Sebring-Avon Park, FL
- State GDP YoY
- ▲ 3.28%
- F500 in state
- 36
Industry mix (Fortune 500 HQ in FL)
| Industry | F500 HQs | Revenue |
|---|---|---|
| Industrial Technology | 2 | $29B |
|
||
| Insurance | 2 | $17B |
|
||
| Retail | 1 | $60B |
|
||
| Technology Distribution | 1 | $58B |
|
||
| Homebuilding | 1 | $35B |
|
||
| Technology Manufacturing | 1 | $35B |
|
||
Price history
+1538.3% since first listed5 events — show timeline
- 2026-04-26 Listed $294,900 HAOR as distributed by MLS GRID
- 2023-03-22 Sold (MLS) $13,000 HAOR as distributed by MLS GRID
- 2023-02-20 Contingent — HAOR as distributed by MLS GRID
- 2021-11-10 Listed $14,800 HAOR as distributed by MLS GRID
- 2005-03-14 Sold (Public Records) $18,000 Public Records
Property tax history
+30.3%/yrLatest (2025): $976 · +106.5% YoY. Source: county tax records.
Cash-flow waterfall
monthlySold comps — $/sqft
last 12 mo · ≤1 miLoading sold comps…