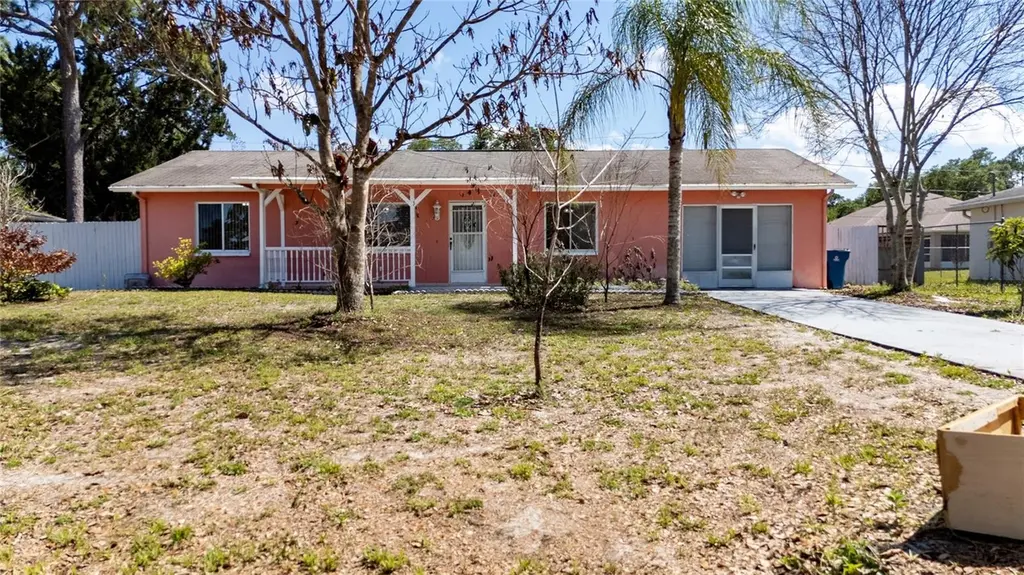
660 Fernandina St NW · Palm Bay, FL
Flood risk 1/10 · Minimal
- FEMA flood zone
- X (unshaded)
- Chance of flooding over 30 yrs
- 0.0%
- Est. flood insurance / yr
- $507 – $1,088
Fire risk 2/10 · Minimal
- Est. fire insurance / yr
- $947 – $1,759
Heat risk 10/10 · Severe
- Hot days now (above 106°F)
- 7 days/yr
- Hot days in 30 yrs
- 22 days/yr
Wind risk 10/10 · Severe
- Chance of severe wind over 30 yrs
- 99.0%
Air-quality risk 1/10 · Minimal
- Unhealthy air days now
- 0 days/yr
- Unhealthy air days in 30 yrs
- 0 days/yr
Risk factors via First Street. Map © Google.
Why this score? — see what drove the C- grade
The composite is a weighted blend of 9 inputs, each scored 0–100. Each bar is that input's sub-score; the figure is the points it added to the 100-point composite (weight × sub-score).
- Cash flow +19.2/30.0
- ARV discount +7.5/15.0
- DSCR +6.1/10.0
- 1% rule +5.1/10.0
- Schools +4.7/10.0
- Livability +3.6/5.0
- Rent growth +2.7/5.0
- Condition / age +2.5/5.0
- Appreciation +0.0/10.0
$199,000
🖨 Deal sheet 📄 Offer letter ✓ Due diligence
Listing remarks
Under contract-accepting backup offers. Excellent investment opportunity in rapidly growing Palm Bay! This oversized residential lot located at 660 Fernandina St NW offers the perfect opportunity for investors, or future homeowners looking to secure land in one of the fastest-developing areas of Brevard County. Conveniently located near shopping, schools, parks, restaurants, and major roadways, with easy access to I-95 and the beaches. New construction is booming throughout the area, making this a prime location for future appreciation. No HOA. Whether you're planning to build now or hold for future value, this property presents outstanding potential in a high-demand market. Don’t mis
Key facts
- Easy access to i95
- Prime location
- No hoa
Tags
Property features AI
Finance
- Other: Homestead exempt; Zoning: RS2
- HOA & community: Senior community
Exterior
- Parking: 1-car garage
- Utilities: Public water; Public sewer; Electricity connected; Cable available; Sewer connected; Water connected
- Home design: Single-family residence; 1 story; North-facing; Entry level: One
- Construction: Stucco and frame construction; Shingle roof; Slab foundation; Built using conventional materials
- Exterior features: Front porch; Patio; Private mailbox; Storage; Paved lot; Fruit trees
Interior
- Kitchen: Range; Refrigerator
- Bedrooms: 3 bedrooms
- Flooring: Carpet; Ceramic tile
- Bathrooms: 2 full bathrooms
- Heating & cooling: Central heating; Central air conditioning
- Interior features: Ceiling fans
- Laundry & utility: Laundry in garage; Washer; Dryer
Neighborhood map
What this means for you Summary
Snapshot
- This is a 3-bed/2.0-bath single-family listed at $199k.
Deal economics
- At list price, monthly cash flow is $216 ($3k/yr) — positive.
- The deal already cash-flows at list — no discount required.
- Meets the 1% rule at list price ($2k rent vs $199k).
- Recommended offer: $196k (1.5% below list) — sets the bar for market timing.
Location & tenants
- Location reads 72/100 on livability (#366 in FL) — a middle-class / working-renter tenant base. Strengths: cost of living A+, housing A+; Watch: schools C-, employment D+, amenities F.
- Brevard (suburban): math 53% / reading 57% proficiency, ranked #19 of 73 in FL (top 26%) — acceptable for families but not a draw, mixed tenant base, ~2y average lease.
- Market conditions: Rents flat; 739 active listings in the ZIP; 12 comparable units currently listed for rent nearby; rentals at typical pace (median 24d on market — plan ~3-4 weeks tenant-placement turnaround); solid renter incomes; 4,602 units permitted in Brevard County in 2024 (702 in 5+ unit buildings).
- This rent runs 32% of the median local income ($75k/yr) — at the standard rent-burdened threshold; future hikes will face affordability resistance.
Forward outlook
- Local home prices are declining (-3.0%/yr); year-one equity from $1k of loan paydown is wiped out by about $6k of value loss. Plan a longer hold.
- Brevard County population projected at +15% by 2050 — modest demand growth; plan on rents tracking national, not racing it.
Negotiation context
- It's been on market 25 days — a 2% lower offer ($196k) is reasonable based on typical stale-listing flexibility.
- Current owner paid $57k; list at $199k implies a 249% gain — meaningful room to come down on a strong offer.
Risks & watch-outs
- Climate carrying-cost: severe wind risk, 99% chance of damaging wind over 30y; extreme-heat days projected 7→22/yr by 2055 (HVAC capex compounding) — expect insurance premiums to compound above CPI over the hold.
Questions for the listing agent
- Is there a deadline driving the sale (1031 exchange, divorce, estate, relocation)? That informs how much negotiation room exists.
- What's the average days-on-market for RENTAL listings here right now (not sales)? A rising rental-DOM trend means longer vacancies and softer asking-rent achievability than the comps imply.
- What's the recent tenant-quality profile in this submarket — average credit score on applications, eviction rate, late-payment / NSF rate, and stable-employment percentage? A property-management company in the area should have these aggregated.
- How much new for-sale + rental construction is in the pipeline within 1–3 miles? Heavy new supply typically softens prices + rents 12–24 months out; constrained supply supports both.
Investment metrics
- 1% rule
- 1.01% ✓
- Cap rate
- 7.60%
- Cash-on-cash
- 4.65%
- DSCR
- 1.21
- GRM
- 8.2
CMA / ARV
No comps found within radius.
Projected returns pro-forma
-3.0% appreciation · 0.93% rent growth · sell at horizon
- IRR
- -11.4%
- Equity multiple
- 0.60×
- Total profit
- $-22,561
- Equity at exit
- $29,672
- IRR
- -5.5%
- Equity multiple
- 0.68×
- Total profit
- $-17,978
- Equity at exit
- $17,206
Cash invested: $55,720 (down + closing). Projections, not guarantees.
Landlord ↔ Tenant lean methodology
- Overall (STATE)
- 87 Strongly Landlord-Friendly
- State Florida
- 87 Strongly Landlord-Friendly · R+3
- County
- — inherits STATE
- City
- — inherits STATE
ZIP-level market 32907
- Home prices YoY
- -10.1%
- Rents YoY
- 0.9%
- Active inventory
- 739
- Price-to-rent
- 8.2×
Monthly cashflow live
- Estimated rent
- $2,014 high interval (Pro) →
- Mortgage (P&I)
- −$1,044
- Tax est. 1.5%
- −$249 /mo · $2,985/yr
- Insurance
- −$83
- HOA
- −$0
- Vacancy / Maint / Mgmt
- −$423
- Net cashflow
- $216
Break-even live
UW: 25.0% down · 7.5% · 30yr · 1.5% tax · 5.0% vac · 8.0% maint · 8.0% mgmt
Financing live
Cash to close
- Down payment
- $49,750
- Closing costs
- $5,970
- Reserves months
- —
- Total cash needed
- —
Loan-product check · same deal, 3 products live
Conventional
25% down · 7.5% · 30yr
- Down + closing
- —
- Monthly P&I
- —
- Monthly cashflow
- —
- DSCR
- —
- Eligible?
- —
Personal DTI + credit; lowest rate.
DSCR
20% down · 8.5% · 30yr
- Down + closing
- —
- Monthly P&I
- —
- Monthly cashflow
- —
- DSCR
- —
- Eligible?
- —
No personal income docs; deal must DSCR.
Hard money
10% down · 12.0% · 12mo
- Down + closing
- —
- Monthly P&I
- —
- Monthly cashflow
- —
- DSCR
- —
- Eligible?
- —
Short-term bridge; refi at stabilization.
Rent comps 12 comps
| Address | Beds | Baths | Sqft | Rent | $/sqft | DOM | Units | Dist |
|---|---|---|---|---|---|---|---|---|
| 874 Altona St NW Palm Bay, FL | 3.0 | 2.0 | 1488 | $1,955 | $1.31 | 23d | 1 | 0.45mi |
| 890 Serenade St NW Palm Bay, FL | 3.0 | 2.0 | 901 | $1,850 | $2.05 | 23d | 1 | 0.50mi |
| 1374 Jupiter Blvd NW Palm Bay, FL | 3.0 | 2.0 | 1500 | $1,895 | $1.26 | 23d | 1 | 0.63mi |
| 496 Iroquois Ave NW Palm Bay, FL | 3.0 | 2.0 | 1128 | $1,950 | $1.73 | 23d | 1 | 1.02mi |
| 154 Daffodil Dr SW Palm Bay, FL | 3.0–4.0 | 2.0–3.0 | 1384 | $1,649 | $1.19 | 14d | 6 | 1.11mi |
| 124 Evergreen St NE Palm Bay, FL | 3.0 | 2.0 | 1283 | $1,855 | $1.45 | 23d | 1 | 1.12mi |
| 1147 Jericho Ave NW Palm Bay, FL | 3.0 | 2.0 | 1352 | $1,700 | $1.26 | 23d | 1 | 1.22mi |
| 751 Winchell St SW Palm Bay, FL | 3.0 | 2.0 | 1160 | $1,960 | $1.69 | 19d | 1 | 1.33mi |
| 916 Spring St NW Palm Bay, FL | 3.0 | 2.0 | 1494 | $1,800 | $1.20 | 23d | 1 | 1.39mi |
| 347 Americana Blvd NE Palm Bay, FL | 3.0 | 2.0 | 1372 | $1,900 | $1.38 | 14d | 1 | 1.43mi |
| 271 Wendover Rd SW Palm Bay, FL | 3.0 | 2.0 | 1425 | $1,900 | $1.33 | 23d | 1 | 1.48mi |
| 1388 Hazel St NW Palm Bay, FL | 3.0 | 2.0 | 1475 | $1,894 | $1.28 | 14d | 1 | 1.50mi |
Listing history 7 events
-
2026-06-03status $199,000 Pending 25 DOM
-
2026-06-02days on market $199,000 Active 25 DOM
-
2026-06-01days on market $199,000 Active 24 DOM
-
2026-05-31days on market $199,000 Active 23 DOM
-
2026-05-31days on market $199,000 Active 22 DOM
-
2026-05-08$199,000 Active
-
2001-10-30soldstatus $57,000
ⓘ Source: listings_history table (triggers on properties + properties_extension) + one-shot
backfill from property_details.listing_events for pre-trigger history.
Climate risk First Street
- Flood 1/10 Low FEMA zone X (unshaded) · 0% chance over 30 yrs
- Wildfire 2/10 Low
- Heat 10/10 Extreme 7 d/yr ≥106°F today · 22 d/yr by 30 yrs out
- Wind 10/10 Extreme 99% chance of damaging wind over 30 yrs
- Air quality 1/10 Low 0 unhealthy d/yr today · 0 by 30 yrs out
Nearby sold comps map
Loading sold comps map…
Walkable amenities ~0.75 mi
Loading nearby amenities…
Taxation est. · year 1
- Rental income
- $24,173
- − Mortgage interest
- −$11,147
- − Property taxes
- −$2,985
- − Insurance
- −$995
- − Repairs & maintenance
- −$1,934
- − Management
- −$1,934
- − Depreciation
- −$5,789
- Taxable loss
- −$611
- Est. tax savings @ 24.0%
- +$147
- After-tax cash flow
- $2,740/yr
For passive investors: Depreciation is non-cash, so a rental often shows a tax loss while cash-flowing — sheltering income. Rental losses are passive: they offset passive income freely, and up to $25,000/yr can offset ordinary (W-2) income if you actively participate and your MAGI is under $100k (phasing out to $0 by $150k); unused losses carry forward. On sale, claimed depreciation is recaptured at up to 25%, and gains may owe capital-gains tax (a 1031 exchange can defer both). Figures are a year-1 estimate at your 24.0% rate — not tax advice; consult a CPA.
Schools (NCES district)
- District
- Brevard
- NCES district ID
- 1200150
- Math proficiency
- 53% ▼ -9.00%
- Reading proficiency
- 57% ▼ -4.00%
- Median HH income
- $49,426
- Composite
- 46.86/100
- National rank
- #2370
- State rank
- #19 of 73 in FL
Livability — Palm Bay
- Score
- 72/100
- State rank
- #366
- US rank
- #6458
Category grades
Schools grade is shown separately in the Schools card above.
Census & demographics
- Census place
- Palm Bay, FL
- County
- Brevard County · 602,871 people
- City population
- 132,211
- Metro
- Palm Bay-Melbourne-Titusville, FL
- Population (ZIP)
- 49,080
- Household income
- $75,311
- Rent vs Own
- Severe rent burden
- 702.0
Population outlook (Brevard County) Hauer SSP2
- Today (2025)
- 623,254 people
- By 2030
- 648,420 · +4.0%
- By 2040
- 690,009 · +10.7%
- By 2050
- 715,669 · +14.8%
- By 2075
- 775,744 · +24.5%
- By 2100
- 776,687 · +24.6%
Race, ethnicity, and origin ACS 2023
- Neighborhood character
- Diverse neighborhood (Simpson 0.62)
- Race & ethnicity
- White 56% Hispanic / Latino 21% Black 15% Two or more races 14% Asian 2%
- Hispanic origin (detail)
- Mexican 2% Puerto Rican 9% Cuban 2% Dominican 3%
- Common ancestry
- Romanian 2% Lithuanian 2% Hispanic 2%
- Foreign-born
- 16% · Canada, Jamaica
- Languages at home
- 77% English-only · Spanish 17% French/Haitian/Cajun 2% Other Indo-European 1%
Political lean MEDSL · Brevard
- 2024 margin
- Strong R (+20.8) · D 39.1% · R 59.9% · Other 1.0%
- 2008→2024 swing
- -10.4pp toward R · 2008: -10.4pp · 2024: -20.8pp
- All cycles
- 2024: R+20.8 2020: R+16.4 2016: R+19.8 2012: R+12.7 2008: R+10.4
Not yet ingested
- Civics
- —
Market trends
- HPI YoY
- ▼ -34.79%
- Current HPI
- 308.9719
- Rent YoY
- ▲ 0.93%
- Metro
- Palm Bay-Melbourne-Titusville, FL
- State GDP YoY
- ▲ 3.28%
- F500 in state
- 36
Industry mix (Fortune 500 HQ in FL)
| Industry | F500 HQs | Revenue |
|---|---|---|
| Industrial Technology | 2 | $29B |
|
||
| Insurance | 2 | $17B |
|
||
| Retail | 1 | $60B |
|
||
| Technology Distribution | 1 | $58B |
|
||
| Homebuilding | 1 | $35B |
|
||
| Technology Manufacturing | 1 | $35B |
|
||
Price history
+249.1% since first listed2 events — show timeline
- 2026-05-08 Listed $199,000 Stellar MLS as Distributed by MLS Grid
- 2001-10-30 Sold (Public Records) $57,000 Public Records
Property tax history
+2.8%/yrLatest (2025): $351 · +5.7% YoY. Source: county tax records.
Cash-flow waterfall
monthlySold comps — $/sqft
last 12 mo · ≤1 miLoading sold comps…